Dynamic Liquidity HeatMap Profile [BigBeluga]🔵 OVERVIEW
The Dynamic Liquidity HeatMap Profile is a smart-flow liquidity tracker that maps where stop-loss clusters and resting limit orders are likely positioned.
Instead of traditional volume profiles based only on executed transactions, this tool projects probable liquidity pools — areas where traders are trapped or positioned and where smart money may hunt stops or fill orders.
It dynamically scans recent price swings, builds liquidity zones above and below price, and visualizes them as a heat map + histogram — highlighting areas with the greatest liquidity attraction.
Orange highlights the highest-concentration liquidity (POC), making potential sweep targets obvious.
🔵 CONCEPTS
Liquidity pools form above swing highs (buy stops) and below swing lows (sell stops).
Market makers & large players often push price into these zones to trigger stops and capture liquidity.
The indicator uses recent volatility + volume expansion to estimate where these pools exist.
Horizontal heat bars show depth and intensity of probable liquidity.
Profile side histogram displays buy-side vs sell-side liquidity distribution.
🔵 FEATURES
Dynamic Liquidity Detection — finds potential stop-loss clusters from recent swing behavior.
Dual-Side Heatmap — split liquidity view above (short stops) and below (long stops) current price.
Volume-Weighted Levels — higher volatility & volume = deeper liquidity expectation.
Real-Time Heat Coloring
• Lime = liquidity below price (potential buy-side fuel)
• Blue = liquidity above price (potential sell-side fuel)
• Orange = peak liquidity (POC)
Liquidity Profile Histogram — plotted at right side, layered by strength.
Auto-Cleaning Engine — removes invalidated liquidity after breaks.
Adjustable lookback window and bin resolution .
🔵 HOW TO USE
Look for price moving toward dense liquidity zones — high probability of wick raids or sweeps.
Orange POC often acts as magnet — strong target zone for smart money.
Combine with SFP / BOS logic to time reversals after liquidity hunts.
In trend, price repeatedly sweeps opposite-side liquidity before continuation.
Use liquidity walls as bias filters — heavy liquidity above often precedes downward move, and vice-versa.
Great for scalping sessions, indices, FX, BTC, ETH.
🔵 CONCLUSION
The Dynamic Liquidity HeatMap Profile gives traders a tactical edge by revealing where the market’s hidden liquidity resides.
It highlights where shorts and longs are positioned, identifies likely sweep zones, and marks the most attractive liquidity magnet (POC).
Use it to anticipate stop hunts, avoid getting trapped, and align with smart-money flow instead of fighting it.
볼륨

Liquidity sweep zone [Liquidation heatmap]Liquidity Sweep Zone : Capturing Liquidity Hotspots with Multi-OI Data and Volume
Overview:
The "Liquidity Sweep Zone " indicator comprehensively analyzes changes in Open Interest (OI) and volume data from major cryptocurrency exchanges to visualize potential liquidity sweep areas in real-time. This script identifies price levels where long or short positions are heavily liquidated or new liquidity enters the market, marking these as 'liquidity hotspots'. It assists traders in identifying these critical price levels to predict potential market reversals or trend accelerations. As its name suggests, it effectively illustrates market liquidity flows in a manner similar to a liquidation heatmap.
Features and Originality:
Multi-OI Data Source Integration and OI Delta Analysis:
Multi-Exchange Data: Utilizes integrated real-time Open Interest (OI) data from five major exchanges: Binance, Bybit, OKX, Bitget, and HTX. This approach reduces market bias that might arise from relying on single-exchange data, providing a more comprehensive understanding of overall market position changes.
Accurate Data Requests: Employs the request.security() function to fetch OI data for the current timeframe. Crucially, it uses lookahead=barmerge.lookahead_off and gaps=barmerge.gaps_on settings to entirely eliminate potential lookahead bias during data requests, ensuring the integrity and accuracy of historical data.
OI Delta Calculation: Accurately calculates the change in OI (delta) for each exchange and sums them to derive the total OI delta. This total OI delta represents the net change in market participants' positions, strongly indicating significant liquidity inflow or outflow at specific price levels, especially when coinciding with price movements.
Smart Volume-Based Liquidity Zone Identification:
Filtered Volume: Considers a trade as 'filtered significant trade' when the current bar's volume (volume) is higher than its 14-period Simple Moving Average volume (ta.sma(volume, 14)). This identifies significant large-scale trading activities that genuinely impact market movements, rather than just any volume spike.
Price-Specific Liquidity Marking: When such filtered volume spikes occur, potential buy or sell liquidity lines are drawn on the chart based on the bar's close and open prices. If the close is higher than the open, a line is drawn near the low, indicating long liquidation liquidity. If the close is lower than the open, a line is drawn near the high, indicating short liquidation liquidity.
Dynamic Visualization and Strength-Based Coloring/Thickness:
Gradient Coloring: Utilizes a custom color.from_gradient() method to apply a gradient effect to liquidity lines. This gradient visually represents the 'strength' (volume or OI delta value) of the liquidity zone, with stronger liquidity areas displayed in deeper colors, enabling intuitive perception of strength.
Strength-Based Line Thickness and Color:
Liquidity lines with maximum strength are displayed as the thickest and most prominent using highLevelColor (default yellow), emphasizing them as the most crucial liquidity areas.
Second maximum strength lines are also highlighted with additional thickness and secondHighLevelColor (default yellow).
Lines with above-average strength are shown with medium thickness and lowLevelColor or midLevelColor, while below-average lines are thinner, creating a visual hierarchy based on liquidity strength.
Line Persistence and Updates: Liquidity lines extend horizontally until the current bar closes via the updateVolumeLiquidityLine and updateOILiquidityLine methods, suggesting that these price levels remain valid liquidity areas for a certain period.
Customizable Multi-Timeframe Support:
Timeframe Filtering: Allows individual selection of whether to display liquidity lines on various timeframes, ranging from 1 minute to 2 hours. This enables users to focus liquidity information on their timeframes of interest.
Timeframe-Specific Line Thickness: The thickness of liquidity lines can be individually set for each timeframe. This allows for customization based on user preference, such as thinner lines for longer timeframes and thicker lines for shorter ones.
Liquidity Position Type Filtering:
The "Liquidity positions" option allows filtering to display liquidity for 'All' positions, 'Long' positions, or 'Short' positions only. This is useful when wanting to focus solely on liquidity hotspots for a specific direction.
Alert Functionality:
Provides a feature to alert users when new high-strength volume-based liquidity zones (isNewHighVolumeLongZone, isNewHighVolumeShortZone) and OI-based liquidity zones (isNewHighOILongZone, isNewHighOIShortZone) are formed. This enables traders to react instantly to significant market changes and seize opportunities.
How to Use:
Add Indicator: Add the "Liquidity Sweep Zone " indicator to your TradingView chart.
Select OI Data Sources: In the "OI Data Sources" group, select the exchanges whose Open Interest (OI) data you wish to include in the analysis.
Display and Visualization Settings:
In the "Display" group, you can customize the visual representation by adjusting the Liquidity multiplier, Liquidity positions type, and the colors for low, mid, and high-level liquidity lines (Low level, Mid level, High level, 2nd High level).
In the "Display Liquidity on Timeframes" group, select whether to display liquidity lines on the currently used timeframe.
In the "Line Thickness by Timeframe" group, set the thickness of liquidity lines for each timeframe to adjust visual density.
In the "OI Line Display" group, you can set the visibility of OI liquidity lines, colors for OI Long and Short positions, and the OI line width.
Alert Settings (Optional): In the "Alerts" group, enable the alert function and customize the alert messages for each type of liquidity.
Chart Analysis:
Pay close attention to the liquidity lines displayed on the chart. Especially, the thickest and brightest lines indicate major liquidity hotspots where large amounts of long or short positions are concentrated.
When the price approaches or reaches these liquidity zones, anticipate potential buy/sell pressure, stop-loss triggers, position liquidations, leading to price reversals or trend accelerations in that area. This indicator effectively serves as a heatmap visually representing potential liquidation levels in the market.
Analyze OI liquidity lines and volume liquidity lines together to understand the overall market liquidity flow and the strength of specific positions.
Conceptual Background:
This script is based on the market structure principle that "smart money" or "large traders" tend to drive prices towards areas where significant liquidity (liquidations and unfulfilled orders) is concentrated. These liquidity sweeps often serve as triggers for price reversals or accelerators for existing trends.
Volume Liquidity: Abnormally high volume at specific price levels indicates that many participants previously traded at those prices. This suggests that liquidity pools, which can act as critical support or resistance levels in the future, still exist.
Open Interest (OI) Liquidity: A sharp increase in OI signifies a large build-up of new positions, while a decrease indicates the liquidation of existing positions. Particularly, when OI delta changes significantly along with price movements, it strongly suggests a large influx or liquidation of long/short positions at specific price levels. This can trigger potential liquidation cascades and effectively acts as a 'liquidation heatmap'.
By integrating these liquidity metrics, this indicator helps traders visually identify the 'hidden' order flow and potential liquidation levels in the market. It empowers them to proactively understand critical price areas that could influence market direction. This is particularly useful for enhancing short-term trading and scalping strategies in futures and margin trading.


JOEJOE VOLUME UNIVERSAL 03112025A universal volume screener that identifies when institutions are aggressively buying a stock by comparing current activity to recent averages, then recommends position sizing based on signal strength.
JOEJOE SHARK INDICATOR - Summary
🎯 Purpose
A volume-based screener that detects institutional buying activity and high-conviction trading opportunities across all global markets (Malaysia, US, Crypto).
📊 What It Does
Identifies 4 Types of Signals:
🟣 Purple Bar (A+ / High Conviction) - Best signal: Both institutional buying AND buy value surge detected
🟡 Yellow Bar (Buy Value Surge) - Strong money inflow detected
🔵 Blue Bar (Institutional Buying) - Large volume with strong buyer control
🟢🔴 Green/Red Bars - Normal volume (no special signal)
🔍 Key Innovation
Universal Design:
Works on ANY market without code changes
Uses relative comparisons (2.5x average) instead of fixed thresholds
Automatically adapts to each stock's normal behavior
Malaysian stocks, US stocks, Bitcoin - all use same logic
📈 Signal Detection Logic
Purple Bar Requirements (ALL must be met):
Volume exceeds 2x the 20-day average (institutional size)
Buy value exceeds 2.5x the 20-day average (money surge)
Price closes in top 30% of candle range (buyer strength)
Price above 50-period EMA (uptrend filter)
Short-term volume MA above long-term (sustained interest)
Candle body is at least 30% of range (decisive move)
Bullish candle (green)
⚙️ Customizable Settings
Signal Configuration:
Buy Value Surge Multiplier (default: 2.5x)
Volume Multiplier (default: 2.0x)
Buyer Strength Threshold (default: 0.7)
Lookback period (default: 20 bars)
Filters (All Toggle-able):
Trend filter with customizable MA length
Sustained interest filter (volume momentum)
Decisiveness filter (candle body size)
Option to require/not require bullish candles
Visual Customization:
All colors adjustable
Toggle markers and dashboard on/off
Volume MA display options
📊 Smart Position Sizing Feature
Calculates Signal Strength (0-100):
Combines Volume Ratio score + Buy Value Ratio score
Higher ratios = higher strength
Position Size Recommendations:
80-100 → 🔥 FULL SIZE (maximum confidence)
60-79 → 75% position (high confidence)
40-59 → 50% position (moderate confidence)
0-39 → 25% position or skip (low confidence)
Purpose: Not all A+ signals are equal - size your position based on actual signal quality
📱 Enhanced Dashboard Display
When High Conviction Signal Active:
Signal status (Active/Inactive)
Signal strength score with emoji indicator
Volume ratio (e.g., 3.2x)
Buy value ratio (e.g., 4.1x)
R/R ratio placeholder (future enhancement)
Position size recommendation with color coding
Visual Indicators:
Blue triangle "A+" marker at chart top
Color-coded position size backgrounds
Professional bordered table
All text in bright blue for visibility
🔔 Alert System
3 Alert Types:
High Conviction Signal (purple bar)
Buy Value Surge (yellow bar)
Institutional Buying (blue bar)
Alert Messages Include:
Ticker symbol
Current price
Signal type with emoji
💡 Screening Workflow
Multi-Chart Setup:
Open 4x4 or 6x3 chart grid
Load watchlist of stocks
Apply indicator to all charts
Scan top-right corners for active signals
Look for blue "A+" triangles at chart tops
Check signal strength scores
Focus on stocks with 80+ scores
🎓 Best Practices
Recommended Settings by Market:
Bursa Malaysia:
Buy Value Multiplier: 2.0-2.5
Volume Multiplier: 2.0
Timeframe: Daily
US Stocks (NYSE/NASDAQ):
Buy Value Multiplier: 2.5-3.5
Volume Multiplier: 2.5
Timeframe: Daily or 4H
Bitcoin/Crypto:
Buy Value Multiplier: 3.5-5.0
Volume Multiplier: 2.5-3.5
Timeframe: Daily or 4H
⚡ Key Advantages
Objective - Based on volume and price data, not subjective patterns
Universal - One indicator for all markets
Adaptive - Compares each stock to its own history
Risk-Aware - Built-in position sizing logic
Screener-Ready - Visual tools for scanning multiple charts
Filter-Heavy - Multiple filters reduce false signals
Customizable - Every parameter adjustable through settings
🚫 What It Doesn't Do
No price targets or stop losses
No prediction of how high price will go
No guarantee of profitability
Doesn't tell you when to exit
Doesn't account for fundamentals or news
R/R ratio currently a placeholder
🎯 Ideal Use Cases
✅ Swing trading - Catching institutional accumulation phases
✅ Stock screening - Finding high-conviction setups in watchlists
✅ Position sizing - Scaling in based on signal quality
✅ Multi-market trading - One tool for Malaysia, US, crypto
✅ End-of-day analysis - Daily timeframe scanning
❌ NOT ideal for:
Scalping (too much noise on low timeframes)
Short selling (designed for long signals)
Range-bound markets (requires uptrend)

Flow Control Oscillator (FCO)Flow Control Oscillator (FCO)
The Flow Control Oscillator (FCO) is a momentum-based indicator that combines volume analysis and money flow to determine who is in control of the market—buyers or sellers—and how strong that control is. Unlike pure price-based oscillators, FCO integrates both price action and volume distribution to provide a more complete picture of market dynamics.
How It Works
Core Components:
Money Flow Index (MFI) -
Scaled to -1 to +1 range
Measures the flow of money into and out of an asset
Identifies buying and selling pressure based on price and volume
Chaikin Money Flow (CMF) -
Already in -1 to +1 range
Measures the accumulation/distribution of volume
Shows whether volume is accumulating (buying) or distributing (selling)
Combined Flow Control Line (FCO Line) -
Equal-weighted composite of MFI and CMF
Smoothed with SMA (default: 3 periods)
Values above 0 = Buyers in control
Values below 0 = Sellers in control
Signal Line -
WMA of the FCO line (default: 6 periods)
Used for timing entries and confirming momentum shifts
Momentum Histogram-
Shows the rate of change in buyer/seller control
Weighted by ADX (Average Directional Index) when enabled
Larger bars = stronger momentum
ADX weighting filters out choppy, unreliable signals
Key Zones
Neutral Zone (-0.3 to +0.3): Balanced market, low conviction
Healthy Trend Zone (±0.3 to ±0.7): Clear control without exhaustion
Warning Zone (±0.7 to ±1.0): Extended, approaching exhaustion
Extreme Zone (beyond ±1.0): Overbought/oversold, reversal likely
What To Look For
Reversal Setups:
FCO in extreme zone (beyond ±1.0)
FCO crosses Signal line in opposite direction
Momentum histogram shrinking (weakening pressure)
Interpretation: Buyers or sellers are exhausted and losing control
Trend Strength Setups:
FCO crosses zero line (control shift)
Momentum histogram growing in the same direction
ADX confirms strong trend (no orange background)
Signal line moving in same direction as FCO
Interpretation: New control being established with building momentum
Divergences:
Price makes new high/low but FCO doesn't confirm
Indicates weakening momentum despite price movement
Early warning of potential reversal
Choppy Market Warning:
Orange background (ADX < 20)
Small momentum bars regardless of FCO position
Interpretation: Weak trend, avoid trading or use tight stops
Best Practices:
Use with context: Combine with support/resistance levels (like VWAP) for confluence
Multi-timeframe confirmation: Check higher timeframe FCO for overall bias
Wait for confirmation: Let signals develop rather than predicting turns
Respect extreme zones: Best reversal opportunities occur when FCO is beyond ±1.0
Filter with ADX: Pay attention to background coloring—avoid choppy conditions
The indicator includes comprehensive alert conditions for:
Reversal setups (extreme + cross + weakening momentum)
Trend strength signals (zero cross + growing momentum + strong ADX)
FCO/Signal crossovers
Extreme overbought/oversold conditions
Control shifts (buyers/sellers taking control)

TernTable: VolViz
VolViz - Overview
VolViz is designed to give traders an instant volume strength visualisation tool using multiple timeframes. It provides an interactive table overlay that allows users to track volume metrics across a range of custom-selected timeframes. The table can dynamically display relative volume (RVOL), average volume, and current volume for each selected timeframes in real time.
Additionally, users can toggle various features and adjust thresholds to receive alerts for both high and low volume conditions.
Key Features
* Volume Metrics: Displays three main volume-related data points across multiple timeframes: Relative Volume (RVOL), Average Volume, and Current Volume.
* Timeframe Flexibility: Supports a range of customisable timeframes from seconds, minutes, hours to daily weekly and monthly intervals up to 12 months. Users can select which timeframes to display.
* Dynamic Table: A table is dynamically updated with data for each enabled timeframe, allowing traders to quickly compare volume data across different periods.
* Optional alert System: Includes alert functionality for high and low volume conditions based on customisable thresholds. Alerts can be set for a minimum number of timeframes for a condition to trigger.
Colour Logic
The script uses specific colours to enhance the visual alert properties that represent different ranges of Relative Volume (RVOL), which are used in the table to visually highlight the volume data:
1. Red: RVOL is less than 1.0, indicating low relative volume.
2. Green: RVOL is between 1.0 and 1.2, indicating moderate relative volume.
3. Purple: RVOL is between 1.2 and 1.5, indicating above average relative volume.
4. Orange: RVOL is between 1.5 and 2.0, indicating higher relative volume.
5. Yellow: RVOL is greater than 2.0, indicating very high relative volume.
How to use
1. Inputs:
* Volume Period: Set the period for calculating the moving average of volume (14 period default).
* The script defaults to the 2m 5m 15m 30m 1h 4h 12h D W M timeframes but user defined custom timeframes can be used (comma-separated) to specify the timeframes to track ( e.g "D,W,M,3M,6M,12M”) to a max of 10 timeframes. The table dynamically adjusts its size dependant on how many timeframes the user chooses to input.
* Table Position: Choose where to display the table: Top Left, Top Right, Bottom Left, or Bottom Right.
* Maximum Decimal Places: Control how many decimal places are shown for volume data.
2. Toggles:
* Enable High Volume Alert: Toggle this to activate the high volume alert.
* Enable Low Volume Alert: Toggle this to activate the low volume alert.
* Enable Minimum Timeframes for Alerts: Toggle this to require a specific number of timeframes to meet the alert condition before triggering.
* Pane Labels: There is also an optional debug label found in the Style tab to identify / confirm the current mode selected and the number of timeframes that meet the alert mode criteria.
The Show Row toggles can be utilised to include or exclude rows to take up less space on the chart.
* Show RVOL Row: Toggle to show the relative volume row in the table.
* Show Avg Volume Row: Toggle to show the average volume row in the table.
* Show Current Volume Row: Toggle to show the current volume row in the table.
* Show Spacer Row Below Table: Toggle to show or hide a blank spacer row below the table.
* Show Spacer Row Above Header: Toggle to show or hide a blank spacer row above the header.
3. How the Table Works:
* The table is populated with the following rows:
1. Spacer Row Above Header (optional): Adds space above the table header.
2. Header Row: Displays the timeframes (e.g., "1h", "4h", "12h", etc.).
3. Relative Volume (RVOL): Shows the RVOL for each timeframe, colored according to the thresholds.
4. Average Volume: Shows the average volume for each timeframe.
5. Current Volume: Displays the current volume for each timeframe.
6. Spacer Row Below Table (optional): Adds space below the data rows.
4. Optional Visual Alerts:
* High Volume Alert: When the current volume exceeds the default or user specified threshold compared to the average volume for the enabled timeframes.
* Low Volume Alert: When the current volume is below the default or user specified threshold compared to the average volume for the enabled timeframes.
When the visual alerts trigger unobtrusive diamonds will appear on the chart. White diamonds above the bar to indicate high volume and yellow diamonds below the bar to indicate low volume. These are not trend direction nor entry or exit signals but may be used in conjunction with other indicators for contextual purposes.
Questions or comments are always welcomed and I hope it helps with your trading !

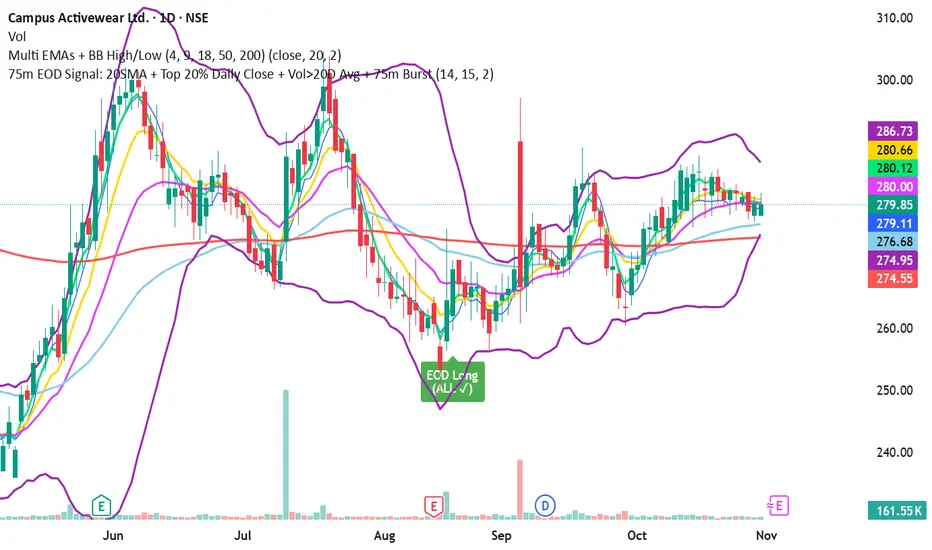
HEKO-Acumulación/Distribución/ObjetivoHEKO — Accumulation / Distribution / Targets + Pi-Cycle is an all-in-one indicator designed for anyone who wants to spot smart-buy zones (accumulation) and smart-sell zones (distribution), filter them with simple rules, and turn them into quantified targets (blue triangle)—all without prior knowledge.
What it does, in 4 points
Detects candles with buying traits (high volume, high close, positive CMF, non-extreme RSI) and selling traits (upper rejection, low close, negative CMF, high RSI).
Filters signals to show them only when price is below all the 200s (green) or above all the 200s (red), reducing “noise” in the middle zones.
Generates automatic targets from the day’s high of the green signal (visible point), and confirms with a blue triangle when that target is reached.
Logs and numbers each green-point ↔ blue-triangle pair, adds a target average, simulates an educational assessment, and optionally marks tops with Pi-Cycle.
Recommended workflow
Turn on the moving averages (MA1…MA5) and the 200-channel filter (recommended).
Adjust sensitivity: volume (multipliers), closePct (80–90%), wickFrac (35–50%), RSI Low/High if you want to filter extremes.
Watch for green signals below the 200 channel. When one appears, the system sets a target (= day’s high × (1 + %)).
Wait for the blue triangle. When it touches the target you’ll see it on price and, if you want, in the panel as well.
You can number each green-blue pair for tracking.
Use Pi-Cycle as a macro top alert (especially in BTC/crypto or, with stock mode, in equities).
Check the TG average and, if useful, the assessment (simulation) to feed back into your parameters.
Key options and why they matter
200 channel (4h and 1D): separates “cheap zones” (green) from “expensive zones” (red).
CMF and volume: quantify whether buying/selling shows real commitment.
Close within the candle: avoids “indifferent” candles and favors decisive ones.
Targets from the daily high: reduces “close” bias and gives realistic room for the chosen %.
Point-triangle pairing: traceability. You know which target comes from which signal.
Pi-Cycle: cycle warning that helps you avoid “falling in love with tops.”
Best practices
Start conservative (default parameters).
Adjust mult and closePct if you see too many or too few signals.
In very volatile assets, raise wickFrac and multDist for reds.
Review the TG average per asset: it guides you on whether your target % is ambitious or too low.
Remember: this is not a complete strategy; it’s a reading and targeting tool. Use it with risk management and your own plan.
Limits and reminders
No indicator eliminates false positives. Filters only reduce noise.
Targets are triggered by the candle’s high. A spike can hit the % instantly.
Pi-Cycle isn’t magic. It’s a historically sensible pattern—useful as an alert, not as dogma.

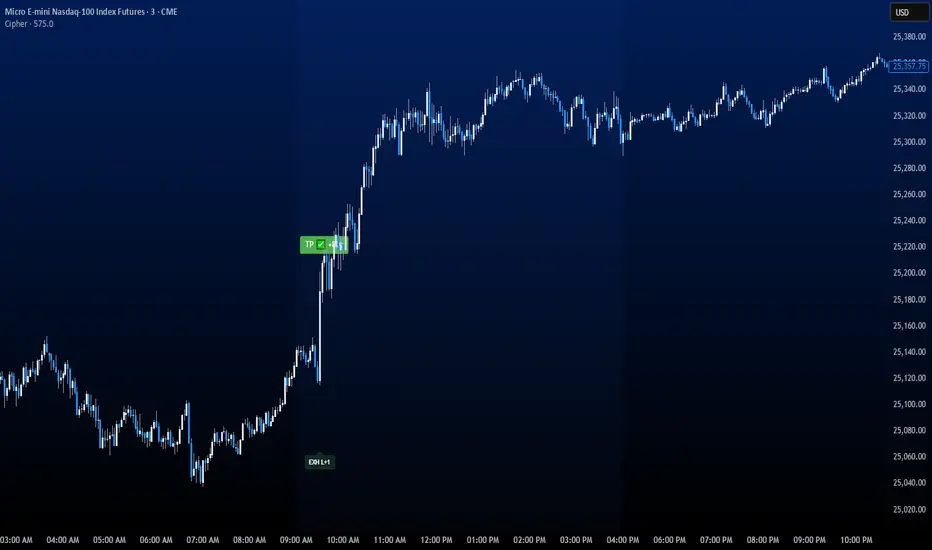
CipherThis indicator identifies potential reversal points through volume exhaustion analysis combined with multi-factor confirmation, volume distribution patterns at price extremes, market state classification based on volatility characteristics, and time-weighted probability calculations. Each component reduces false signals that single-factor indicators typically produce.
METHODOLOGY:
The system continuously monitors market conditions across multiple dimensions. When volume patterns indicate potential exhaustion at significant price levels, it checks for alignment with favorable market conditions and statistical probabilities. Signals only generate when multiple factors confirm, with entry triggered on momentum continuation beyond the exhaustion point.
COMPLETE USAGE GUIDE:
Signal Identification:
- "EXH L+2" = Long exhaustion with 2 confirmations
- "EXH S+3" = Short exhaustion with 3 confirmations
- Higher confirmation numbers indicate stronger setups
Entry Execution:
- Dashed lines mark entry trigger levels
- Entry activates when price breaks trigger within specified bar window
- Buffer setting controls distance from exhaustion bar (ticks)
Position Management:
- Automatic stop loss and target levels display on entry
- Green lines = profit targets
- Red lines = stop loss levels
- Info panel shows real-time position status
CONFIGURABLE PARAMETERS:
Timing Controls:
- Entry Buffer: 0-5 ticks (momentum confirmation distance)
- Max Bars to Wait: 3-10 bars (entry window duration)
- Session Times: Separate London/New York parameters
Sensitivity Settings:
- Volume Multiplier: 1.5-3.0 (vs 20-bar average)
- Lambda Values: Setup frequency expectations per session
- Stop Distances: Session-specific risk parameters
Risk Controls:
- Daily Win Limit: Stops after profitable day
- Daily Loss Limit: Prevents excessive drawdown
- Maximum Daily Trades: Controls overtrading
PERFORMANCE OPTIMIZATION:
Best Trading Windows:
- 10:00 AM EST: Primary reversal window
- 9:30-9:45 AM EST: Opening range exhaustion
- 3:00-4:00 AM EST: European session setups
- 2:30 PM EST: Afternoon reversal potential
Session Characteristics:
- London (2-9 AM EST): Lower frequency, cleaner setups
- New York (9 AM-4 PM EST): Higher frequency, requires filtering
- Background colors indicate active sessions
RISK PARAMETERS:
- Default Stops: 30-40 ticks (session-dependent)
- Risk:Reward Ratios: 1:1.5 to 1:3 (configurable)
- Trade Frequency: 2-4 quality setups weekly
VISUAL REFERENCE:
- Orange Background: London session active
- Blue Background: New York session active
- Yellow Markers: Exhaustion points identified
- Dashed Lines: Pending entry levels
- Solid Lines: Active trade levels
- Info Table: Statistics and system status
IMPORTANT CONSIDERATIONS:
This tool identifies potential setups based on rule-based analysis. Traders should understand that no system guarantees profits and should use appropriate risk management. The indicator works best on 3-minute and 5-minute timeframes in liquid markets. Combine with market context and price action understanding for optimal results.
TECHNICAL REQUIREMENTS:
- Best suited for index and commodites
- Optimized for 3M and 5M
- Requires volume data for proper function
- Best results with consistent market participation
Multi-Anchor VWAP | Trade Symmetry🧩 Multi-Anchor VWAP
Description:
Dynamic VWAP anchored to Session, Week, Month, Quarter, and Year — all in one view.
Full Description:
This indicator plots multiple VWAPs (Volume-Weighted Average Prices) simultaneously — each anchored to a different time period:
Session, Week, Month, Quarter, and Year.
💡 Ideal for traders who track institutional mean reversion and liquidity zones across multiple timeframes.
Features
✅ Session, Weekly, Monthly, Quarterly, and Yearly Anchored VWAPs
✅ Independent color and visibility controls for each anchor
✅ Adjustable label position and size
✅ Option to hide VWAPs on Daily or higher charts
✅ Clean and efficient performance
This tool helps you visualize volume-weighted mean levels where price often reacts — offering a clear map of bias and equilibrium across all major time horizons.

PipGuard Magic BoxPipGuard Magic Box – Multi-Timeframe EMA Regime Analyzer
Indicator published by PipGuard.
PipGuard Magic Box is a complete dashboard for market regime analysis, built on a Multi-Timeframe architecture.
This script goes beyond a simple crossover: it blends the power of the classic EMA(50) and EMA(200) with a dynamic "Warmap" and a compact MTF table , offering an immediate glance at trend coherence.
It identifies the dominant trend , filters noise, and prints "Buy" / "Sell" signals only on confirmed crossovers .
How it works: The Logic
• Core Logic (Regime):
The regime (Bullish or Bearish) is defined by the position of the EMA(50) relative to the EMA(200). The indicator waits for the candle close to validate the signal.
• Warmap (Momentum):
The colored area between the two EMAs is not static. It dynamically adapts to momentum, providing an immediate visual read on the trend's strength and direction.
• MTF Table (Coherence):
The panel summarizes the regime status across seven key timeframes (Current, 24h, 4h, 1h, 15m, 5m, 1m). This allows for a quick assessment of whether higher timeframes are aligned with the current one.
• Confirmation Signals:
"Buy" and "Sell" labels appear exclusively on confirmed crossovers . This approach prevents false signals generated by intra-bar noise and improves operational clarity.
How to Use
1. Add the script to your chart.
2. Observe the EMA 50/200 crossover and the Warmap to identify the dominant regime.
3. Check the MTF Table to verify directional coherence across different timeframes.
4. Set up Alerts to receive automatic notifications (push or sound) at the exact moment a crossover (bullish or bearish) is confirmed. Never miss a regime change again .
5. Use the "Buy" / "Sell" signals as confirmation tools to integrate into your risk management strategy.
EXAMPLE OF USE
EXAMPLE OF USE
Settings
• `EMA 50 / EMA 200 Length` → Adjusts the regime's sensitivity and responsiveness.
• `Table Text Color` → Adapts the table's text readability for light or dark backgrounds.
• Custom Alerts: Fully configurable for notifications on Bullish (💚) and Bearish (❤️🔥) crossovers.
• All visual parameters are pre-configured to ensure visual consistency and maximum clarity.
Limitations
• EMAs are lagging indicators. They are designed to confirm a regime change, not to anticipate it.
• The MTF table data updates at the close of the higher timeframe's candle , which may introduce slight update delays.
• Past performance does not guarantee future results .
Access
This script is available only via invite-only access .
To request access, use the link provided in our Signature below this publication.
Note: This script is a technical tool for market analysis. It does not guarantee profits or specific results.
Indicator published by PipGuard.

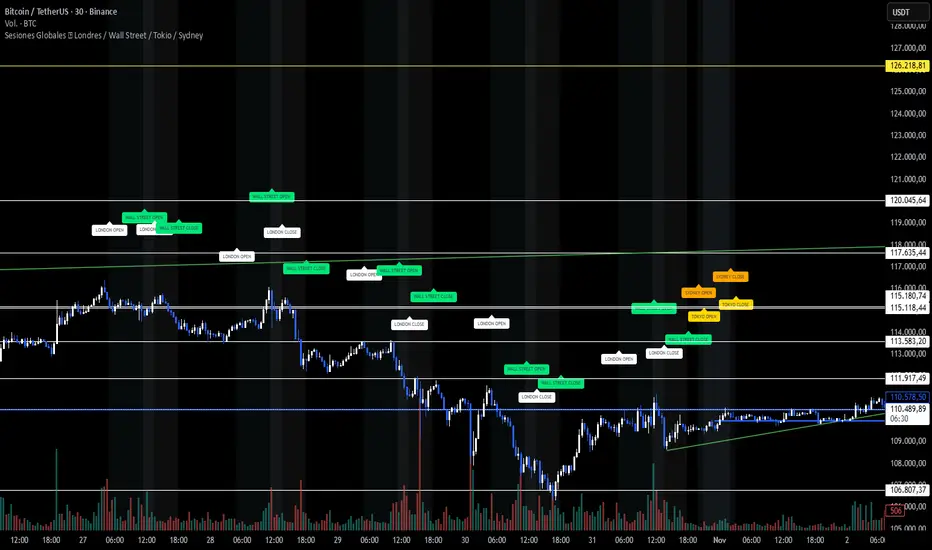
Sesiones Globales 🌍 Londres / Wall Street / Tokio / SydneyA clean visualization of the four main trading sessions — all shown in Argentina time (UTC−3) for easier global market tracking.
🕒 Sessions covered:
London 🇬🇧 — 05:00 to 13:30
Wall Street 🇺🇸 — 11:30 to 18:00
Tokyo 🇯🇵 — 21:00 to 03:00
Sydney 🇦🇺 — 20:00 to 02:00
✨ Features:
Soft background colors for each market session (non-intrusive and chart-friendly)
“OPEN” and “CLOSE” labels in matching session colors
Correct weekend handling — Tokyo and Sydney extend into early Saturday mornings (no false sessions shown)
Works on any asset — BTC, SP500, FX, or indices
Designed for dark charts and visual clarity
🎯 Why use it:
See where global liquidity overlaps, detect volatility zones, and plan your trades around real session activity — especially helpful for BTC and SP500 traders following institutional flow.
💡 Tip: All times are set to Argentina (UTC−3) by default. Adjust manually if you prefer another timezone.
Candlestick Absorption (Pure Price+Volume)📘 Candlestick Absorption (Pure Price + Volume)
An original approach to detecting hidden institutional absorption using nothing but candle structure and relative volume.
🧠 Concept
Every candle tells a story — not just in its color, but in the battle between aggressive orders and passive liquidity.
This indicator isolates those moments where one side of the market absorbs the other’s aggression — when a candle shows excess wicks on high volume but fails to extend in that direction.
Unlike traditional volume indicators or oscillators, this script focuses solely on the interaction between wick length, body size, and relative volume , giving a pure price–volume perspective of absorption and exhaustion.
⚙️ How It Works
1. Relative Volume Detection
• Compares each candle’s volume to a configurable moving average (default SMA 20).
• Marks only candles with significantly above-average activity (e.g. 1.5× SMA) as eligible for absorption.
2. Wick–Body Anatomy Analysis
• Measures the proportion of each candle’s wicks and body within its total range.
• Focuses on long wicks with small bodies , representing strong push-and-absorb behavior.
• The close must remain off the extreme by a user-defined percentage to confirm that the move was rejected.
3. Absorption Logic
• Bullish Absorption (⬆) → long lower wick, high volume, small body, close away from the low → demand absorbed selling pressure.
• Bearish Absorption (⬇) → long upper wick, high volume, small body, close away from the high → supply absorbed buying pressure.
4. Cooldown & Clarity
• A built-in cooldown prevents repetitive signals in congestion zones.
• Optional translucent absorption zones (boxes) extend forward, helping you visualize where future retests may react.
🎯 How to Use It
• Watch for Absorb ⬆ or Absorb ⬇ markers near swing highs/lows, session extremes, or fair-value gaps — these often highlight zones of institutional absorption or stop-runs.
• Combine with market structure or order-flow context rather than standalone entries.
• Use zones as potential re-entry or rejection levels when price revisits them.
• For intraday use, increase High-Volume Factor to 1.8–2.2 to filter noise.
• For higher timeframes, relax wick/body thresholds slightly to capture broader absorption events.
⸻
🔍 What Makes It Original
• Pure Price + Volume logic — no MAs, RSI, VWAP, or momentum filters.
• Uses dynamic wick-to-range ratios and relative-volume qualification instead of arbitrary thresholds.
• Adaptive visual design: the plotted boxes fade as they age, making absorption footprints visually intuitive.
• Works across any market (stocks, crypto, indices, futures) and timeframe without recalibration.
• Zero repainting. All signals are based on completed bars only.
🧩 Inputs Summary
Volume Filter : Volume SMA Length, High-Volume Factor
Defines how much higher a candle’s volume must be compared to its average
Candle Anatomy : Min Wick % of Range, Max Body % of Range, Close Off Edge %
Controls candle geometry for valid absorption
Signal Logic [/b : Cooldown Bars, color filters
Reduces clutter and false clustering
Zones : Draw Zones, Zone Forward Bars, Opacity Levels
Paints temporary liquidity footprints
Visuals : Background Tint
Highlights active absorption bars
⚠️ Important Notes
• Absorption ≠ instant reversal — it’s often a precursor to exhaustion or liquidity shift.
• Always confirm with structure, trend context, or additional confluence.
• Use at your own discretion; the script makes no performance claims.
💡 Suggested Use Cases
• Identifying trap candles at swing highs/lows.
• Spotting hidden institutional participation before reversals.
• Filtering false breakouts in tight ranges.
• Defining retest zones for Smart-Money or volume-profile strategies.

Breakout Volume AlertThis indicator helps traders identify true breakouts confirmed by strong volume.
It automatically highlights candles where the current bar’s volume is greater than 1.5× the 10-bar average volume, confirming institutional participation and momentum strength.
How It Works:
A yellow line tracks the 10-bar volume average.
When current volume exceeds 1.5× the average, the bar turns green — signaling strong buying/selling interest.
Normal or weak bars remain faded red.
You can use this with your Price Action + Multi-Timeframe strategy to validate breakouts, retests, and reversals
Best Used For:
Breakout + Retest confirmation (Intraday or Swing)
Volume spike detection before momentum moves
Filtering fake breakouts with low participation
Works perfectly with 5m / 15m / 30m / 4H charts
Settings:
Default volume average length = 1
Volume strength multiplier = 1.5×
Add alert: "Volume > 1.5x average" for instant notifications

CVD Divergence ISAK EditedCVD Divergence with Price Lines
This indicator automatically detects **divergences between Price and CVD (Cumulative Volume Delta)** directly on the chart.
It supports multiple CVD periods (5, 7, 14, 21, 28) and visually displays divergence lines on price action.
**Features:**
* Detects 🟢 *Bullish* and 🔴 *Bearish* divergences
* Supports *Periodic* and *EMA* calculation modes
* Volume filter for stronger divergence signals
* Price labels and divergence lines for clarity
* Built-in alerts for new divergence detections
Ideal for **scalping and intraday trading** (1m–1h timeframes).

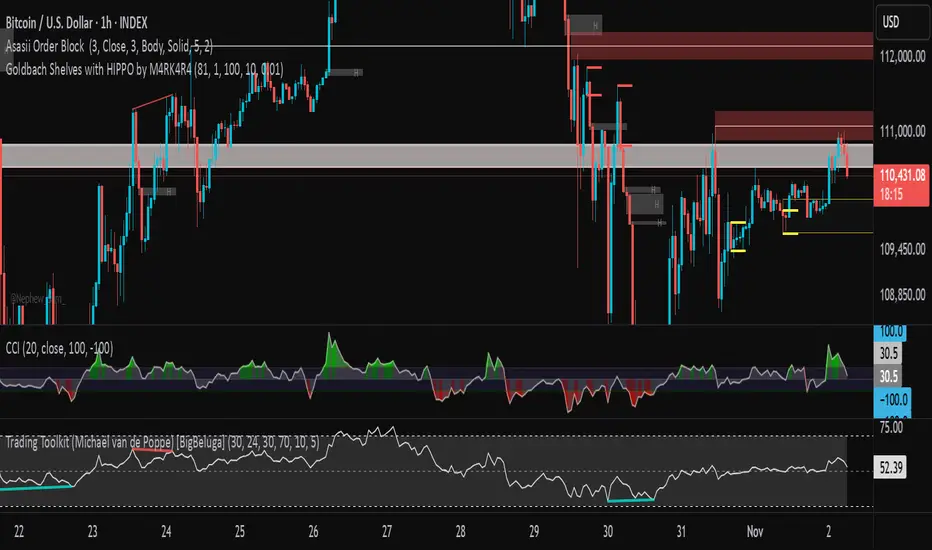
Goldbach Shelves with HIPPO by M4RK4R4Goldbach Hippo M4RK
The idea is that you are using a higher Po3 range, but trading within the smaller 3 sections, that I call "shelves", Bottom Shelf, Mid Shelf, Top Shelf. The three sections are split with the 0.33 and 0.66 Non GB levels.
Each shelf has two FV levels (gray lines), and you should TP or take most off at opposite FV level, with the stop at the NonGB lines (thick white lines), or the FV level past that.
Can also crank SL up after price goes to opposite FV. This gives you about 2.3RR, which is excellent for long term stability and automation.
Future updates:
auto Po3 range suggestion.,
current Po3 in use label (done),
section labels/tool tips,
custom colors (done)
GC-Volume Spike (골드크로스 볼륨스파이크) . V2RSI + Volume + GoldenCross + OBV + Inst + Heart
업데이트 기능추가
7일선에 봉위치에따른 색상추가
상승 하락시그널에따른 색상 다변화
시각화 기반사항 개선 등
Updated features:
Added colors based on candlestick positions to the 7-day moving average.
Diversified colors for rising and falling signals.
Improved visualization.

✝️📈📉☢️🔱NUKE is a multi-ticker signal indicator, optimized for intraday futures and stocks trading.
To use: Add to a multi-timeframe charts (e.g., 1m, 5m, 15m), select up to 5 tickers (e.g., MNQ, MES), and set an anchor mode (daily, weekly, monthly, or manual) for session resets. Enable/disable signal components like AVWAP, Price Stoch, VWEMA crosses, ADX, and BB in settings.
For trading: Monitor the dynamic table for recent LONG (L↑) or SHORT (S↓) entries with strength ☢️ (1 to 6, higher indicates stronger confluence). Enter positions in the signal direction on the chart ticker or selected ones, using multi-timeframe confirmation (e.g., anchor to daily while trading on seconds/minutes).
Apply proper risk management, such as ATR-based stops, and test in demo mode.

Directional Volume Cloud MTFThe Directional Volume Cloud MTF transforms raw volume into a visually intuitive cloud histogram that highlights directional bias and exhaustion zones.
🔍 Core Logic
- Volume bias is calculated using candle direction (bullish/bearish) and smoothed via EMA.
- Bias strength is normalized against average volume to produce a ratio from -1 to +1.
- Color and opacity dynamically reflect bias direction and strength — pale clouds indicate weak volume, while vivid clouds signal strong conviction.
Features
- Customizable bullish/bearish colors
- Dynamic opacity based on volume strength
- Declining volume signals for potential reversals
- Multi-timeframe bias overlay (e.g., daily bias on intraday chart)
📈 Use Cases
- Spot volume exhaustion before reversals
- Confirm breakout strength with bias intensity
- Compare short-term vs long-term volume pressure
Whether you're scalping intraday moves or validating swing setups, this cloud-based volume heatmap offers a clean, modular way to visualize market conviction.

Liquidation HeatMap Pro | AlphaNattLiquidation HeatMap Pro | AlphaNatt
The Liquidation HeatMap Pro by AlphaNatt is a cutting-edge visualization tool designed to map potential liquidation and high-volume zones directly onto your chart. It uses enhanced color gradients, multi-layered pivot zones, and percentile-based volume scaling to help traders identify liquidity concentrations and probable price reaction zones.
---
Understand where the market’s liquidation risk truly lies — visually.
---
🌋 Key Concept
The indicator identifies pivot highs and pivot lows across the chart, then builds layered zones around these pivots based on ATR volatility and volume intensity . Each layer is assigned a color that represents the relative strength or “heat” of liquidation risk — from cold (weak) to hot (strong).
---
🔥 Features Overview
Dynamic Heat Zones — Each pivot zone is layered with a gradient that reflects the underlying market volume, providing a multi-dimensional view of liquidity buildup.
Enhanced Color Mapping — Uses a five-step gradient from cyan → blue → purple → magenta → pink for ultra-smooth visual transitions.
Percentile-Based Volume Normalization — Automatically adjusts color scaling based on recent volume distribution (min, avg, 75th, and 90th percentiles).
Automatic Fading — When price interacts with a zone, the heatmap dynamically fades its opacity, signaling potential liquidity absorption or zone exhaustion.
Heat Scale Visualization — Displays a compact vertical color scale to the right of the chart, helping you interpret the temperature of the heatmap zones at a glance.
Optimized Performance — Smart cleanup logic removes older boxes beyond your lookback range for smooth chart performance.
---
⚙️ Adjustable Parameters
Cold Color / Hot Color — Define the endpoints of your heat spectrum.
Lookback Bars — Controls how many past bars the script analyzes and retains in memory.
Granularity Levels — Adjusts the density of the heatmap layers per zone (higher = smoother gradient).
Zone Height Multiplier — Scales the vertical range of each liquidation zone relative to ATR.
Base Transparency — Sets the overall opacity of the heatmap.
Color Balance — Fine-tune the bias between cold (cyan/blue) and hot (pink/magenta) hues.
Show Heat Scale — Toggle the on-chart color legend for easier interpretation.
---
📈 How It Works
The indicator tracks real-time volume data and smooths it over a lookback window .
It detects local pivot highs and pivot lows to anchor liquidity zones.
Each zone is layered using ATR-based height scaling and volume percentile mapping .
Colors are assigned using a nonlinear power curve that enhances high-volume areas, ensuring “hot zones” stand out clearly.
As price interacts with a zone, it gradually fades to indicate liquidity consumption.
---
💡 Practical Applications
Identify likely areas of short or long liquidation cascades .
Spot zones of high market-maker interest or hidden liquidity absorption .
Time entries near “cold” accumulation areas and watch for “hot” distribution regions.
Use it with volume-based or delta indicators to confirm institutional activity.
---
📊 Recommended Settings
Lookback: 300–500 for swing trading, 100–200 for intraday setups.
Granularity: 30–70 depending on desired smoothness.
Zone Height Multiplier: 0.5–1.0 for normal volatility pairs, 0.2–0.4 for high-volatility assets.
Transparency: 10–25 for balanced visibility.
---
🚀 Developer Notes
This indicator was built with precision and efficiency in mind, pushing the limits of TradingView’s rendering system using max_boxes_count and max_lines_count optimizations.
It’s ideal for traders who want to visualize real-time liquidation pressure and anticipate reactive price zones across any timeframe or asset.
---
📘 Summary
The Liquidation HeatMap Pro | AlphaNatt transforms the abstract concept of liquidity into a visual landscape. Whether you’re trading Bitcoin, ETH, or major altcoins, this heatmap offers unparalleled insights into where traders are likely to get liquidated — giving you the upper hand before it happens.
“Liquidity leaves footprints — this indicator paints them for you.”

ADX Color Change by BehemothI find this tool to be the most valuable and accurate entry point indicator along with moving averages and the VWAP.
ADX Color Indicator - Controls & Intraday Trading Benefits
Indicator Controls:
1. ADX Length (default: 14)
- Controls the calculation period for ADX
- Lower values (7-10) = more sensitive, faster signals (better for scalping)
- Higher values (14-20) = smoother, fewer false signals (better for swing trades)
- *Intraday tip:* Try 10-14 for most intraday timeframes
2. Show Threshold Levels (default: On)
- Displays the 20 and 25 horizontal lines
- Helps you quickly identify when ADX crosses key strength levels
3. Use Custom Timeframe (default: Off)
- Allows viewing higher timeframe ADX on lower timeframe charts
- *Example:* Trade on 5-min chart but see 15-min or 1-hour ADX
4. Custom Timeframe
- Select any timeframe: 1m, 5m, 15m, 30m, 1H, 4H, D, etc.
- *Intraday tip:* Use 15m or 1H ADX on 5m charts for better trend context
5. Show +DI and -DI (default: Off)
- Shows directional movement indicators
- Green line (+DI) > Red line (-DI) = bullish trend
- Red line (-DI) > Green line (+DI) = bearish trend
6. Show Background Zon es (default: Off)
- Visual background colors for quick trend strength identification
- Green = strong trend (ADX > 25)
- Yellow = moderate trend (ADX 20-25)
Intraday Trading Benefits:
1. Avoid Choppy Markets
- When ADX < 20 (no background color), market is ranging
- Reduces false breakout trades and whipsaws
- Save time and capital by stepping aside during low-quality setups
2. Identify High-Probability Trend Trades
- **Green line + Green zone** = strong trend building, look for pullback entries
- Yellow line crossing above 20 = early trend formation signal
- Catch trends early when ADX starts rising from below 20
3. Multi-Timeframe Analysis
- Use custom timeframe to align with higher timeframe trends
- *Example:* If 1H ADX shows green (strong trend), take breakout trades on 5m chart in same direction
- Increases win rate by trading with the bigger picture
4. Exit Signals
- When ADX turns red (falling), trend is weakening
- Consider tightening stops or taking profits
- Avoid entering new positions when ADX is declining
5. Quick Visual Confirmation
- Color coding eliminates need to analyze numbers
- Instant recognition: Green = go, Yellow = caution, Red = trend dying
- Faster decision-making during fast market moves
6. Scalping Strategy
- Set ADX length to 7-10 for sensitive signals
- Only scalp when ADX is rising (blue, yellow, or green)
- Exit when ADX turns red
7. Breakout Confirmation
- Wait for ADX to rise above 20 after a breakout
- Filters false breakouts in ranging markets
- Yellow or green color confirms momentum behind the move
Optimal Intraday Settings:
- Day Trading (5-15 min charts):** ADX Length = 10-14
- Scalping (1-5 min charts):** ADX Length = 7-10, watch custom 15m timeframe
- Swing Intraday (30min-1H charts):** ADX Length = 14-20
Simple Trading Rules:
✅ Trade: ADX rising + above 20 (yellow or green)
⚠️ Caution: ADX flat or just crossed 20
❌ Avoid:*ADX falling (red) or below 20
The key advantage is staying out of low-quality, choppy price action which is where most intraday traders lose money!

Order Flow Proxy (Delta & Cumulative)This is an indicator I build with ChatGPT, it helps to analize the momentum of the market to correlate price and volume movement.
