SR-ZnV2There are many support and resistance scripts out there. I was unable to find one that met all of my needs so I have expanded on the closest ones that I was able to discover. The ability to show persistent S/R levels by volume at various time frames automates much of the process for the user with unique and customizable features, the lastest dated of which are displayed by its time frame support/resistance strength and extend toward the right of the screen where they can be seen more clearly by price .
// Original script is thanks to tommyf1001, synapticex and additional modifications is thanks to Lij_MC. Credit to both of them for most of the logic behind this script. Since then I have made many changes to this script as noted below.
// Changed default S/R lines from plots to lines, and gave option to user to change between solid line, dashed line, or dotted line for both S/R lines.
// Added additional time frame and gave more TF options for TF1 other than current TF. Now you will have 4 time frames to plot S/R zones from.
// Gave user option to easily change line thickness for all S/R lines.
// Made it easier to change colors of S/R lines and zones by consolidating the options under settings (rather than under style).
// Added extensions to active SR Zones to extend all the way right.
// Added option to extend or not extend the previous S/R zones up to next S/R zone.
// Added optional time frame labels to active S/R zones, with left and right options as well as option to adjust how far to the right label is set.
// Fixed issue where the higher time frame S/R zone was not properly starting from the high/low of fractal. Now any higher time frame S/R will begin exactly at the High/Low points.
// Added to script a function that will prevent S/R zones from lower time frames displaying while on a higher time frame. This helps clean up the chart quite a bit.
// Created arrays for each time frame's lines and labels so that the number of S/R zones can be controlled for each time frame and limit memory consumption.
// New alert options added and customized alert messages.
볼륨

ATR Daniel# ATR Daniel - Indicator Description
## 🇬🇧 ENGLISH VERSION
### ATR Daniel - Smart Trailing Stop Manager
**ATR Daniel** is an intelligent trailing stop indicator that automatically adapts to your trading style and the asset you're trading.
#### Key Features:
**🎯 3 Trading Modes:**
- **Swing Trading** - For position trading with wider stops
- **Intraday** - For day trading with balanced parameters
- **Scalping** - For quick trades with tight stops
**📊 Automatic Asset Detection:**
The indicator automatically recognizes 3 major assets and applies optimized parameters:
- **XAUUSD (Gold)** - Lower volatility settings
- **BTCUSDT (Bitcoin)** - Medium volatility settings
- **NAS100USD (Nasdaq 100)** - Higher volatility settings
**🔧 Flexible Configuration:**
- **Auto Mode**: Applies optimal parameters based on detected asset and selected trading mode
- **Manual Mode**: Customize ATR length and multiplier to your preferences
- **Customizable Colors**: Choose your own line color
- **ON/OFF Display**: Toggle line visibility as needed
**📈 Visual Display:**
- Dynamic trailing stop line that follows price action
- Color changes based on trend direction (bullish/bearish)
- Real-time info table showing:
- Current asset
- Trading mode
- ATR value
- Stop loss distance
- Recommended SL price
- Current trend direction
- Signal arrows at trend reversals (optional)
**💡 How It Works:**
The indicator uses ATR (Average True Range) to calculate dynamic stop loss levels that adapt to market volatility. The trailing stop follows the price in trending markets while protecting your position.
**Perfect for:**
- Traders who want automated stop loss management
- Multi-asset traders (Gold, Bitcoin, Nasdaq)
- All trading styles (Swing, Intraday, Scalping)
---

Jackpot_By_Rao_Gs_Swng_Pbls🎯 Description
Jackpot_By_Rao_Gs_Swng_Pbls is a precision-based intraday and swing trading automation tool designed for NIFTY options, built to identify high-probability BUY CE and BUY PE opportunities.
The script automatically tracks ITM (In-the-Money) option pairs derived from the live NIFTY spot price and calculates breakout/breakdown setups based on recent swing highs and lows, EMA alignment, and RSI confirmation.
Once a valid breakout condition is met, the script generates:
Visual chart signals with complete trade details (Entry, Stop Loss, Targets)
Dynamic JSON alerts for webhook-based auto order placement
Automated trade management (Target, SL, and Exit logic)
It’s optimized for traders using Dhan API or compatible webhook integrations, enabling one-click or automated trade execution directly from TradingView alerts.
⚙️ Core Features
✅ Auto-calculates current ATM and ITM strike codes based on today’s open price
✅ Identifies breakout/breakdown trades from the previous swing levels
✅ Dynamic EMA-based trend filter (EMA 20 vs EMA 50)
✅ RSI check for directional strength (internally calculated)
✅ Full trade details shown on the chart with 5 target levels
✅ Auto JSON alert generation with webhook-ready payload
✅ Built-in Stop Loss and Exit handling logic
✅ Visual markers for CE (Green arrows) and PE (Red arrows)
✅ Adjustable parameters for expiry date, open price, and swing length
📈 Trade Logic Overview
🔹 BUY CE Condition (Bullish Setup):
EMA20 > EMA50 → Bullish trend confirmation
Spot closes below recent swing low
CE Option price below its recent high
Confirmation candle closes above previous open (if green) or above midpoint (if red)
🔹 BUY PE Condition (Bearish Setup):
EMA50 > EMA20 → Bearish trend confirmation
Spot closes above recent swing high
PE Option price below its recent high
Confirmation candle closes below previous close/midpoint depending on color
Each signal automatically plots a BUY label on the chart showing:
Entry Price
Stop Loss
Targets 1–5
Strike Code
Trigger Time |

Average Volume Corner BoxAn indicator that anchors a single info box to the chart’s top right corner. It compares the current volume to a selectable moving average (SMA, EMA, WMA) and displays a status (VOL > AVG or VOL < AVG), the current volume, the average volume, and percent difference. The color switches between red and green backgrounds so you can read volume at a glance without cluttering the chart with those stinky volume rectangles.
Features
• Fixed corner box anchored to the chart top right
• Choose MA type: SMA, EMA, WMA
• Selectable MA length
• Optional percent difference display
• Threshold multiplier to only flag meaningful spikes (e.g., vol > avg * 1.5)
• Configurable colors and font size

OutsiderEdge – Node Breach Engine (NBE)Overview – What is the Node Breach Engine (NBE)?
NBE is a swing/session volume-profile engine that builds profiles between pivots (or per session), tracks closed & developing POC, and prints breach signals when price challenges the control node. It quantifies node strength, buy/sell composition (CVD) at the POC and the entire profile, Value Area levels (VAH/VAL), VWAP distance, time at price, and introduces a PoV (Point of Void; the LVN located inside the Value Area): to highlight low-participation corridors where rotations or rejections often form. A lightweight EMA smoothed trend can optionally filter signals by prevailing bias.
Use it to answer fast: How strong is this node? Is the profile buy- or sell-led? Are we accepting/rejecting control? Is the developing POC migrating? Is the VA’s LVN (PoV) about to rotate back to POC or reject?
🔹 FEATURES
Volume Profile Core (Swing or Session)
Build pivot-to-pivot or session profiles with configurable row density and Value Area %.
Draw VAH/VAL with optional VA fill and optional profile window background.
Control Node (POC) – Closed & Developing
Closed POC highlighted on finished windows.
Developing POC path stitched bar-by-bar on the active segment (visual migration of control).
Optional POC row highlight and extend-until-touch behavior.
PoV – Point of Void
Detects the lowest-volume row within the current VA band (between VAL and VAH).
Plots a PoV anchor/line you can use as a rotation target or rejection boundary:
Rotations: VAH ↔ PoV (LVN) ↔ POC ↔ VAL.
Rejections: Thin participation at PoV often flips acceptance back toward POC.
Works alongside POC/VA to map acceptance vs. rejection with finer granularity than a single control node.
Node Context Tooltip (Deep Dive)
Compact tooltips on closed profiles: POC price, Node Strength % (POC/Total), CVD split (Buy%/Sell%), VWAP distance %, bars at price.
Profile Buy/Sell Overview (Stacked Bars)
Two stacked horizontal bars (Buy ▲ / Sell ▼) whose width matches the histogram and thickness is configurable.
Auto-placed above or below the profile using swing H/L logic.
Available for closed and developing profiles.
CVD at POC and Full-Profile
Quick labels for Buy% / Sell% at the POC.
Stacked bars summarize full-profile pressure at a glance.
Trend Context
Gradient EMA base vs. smoothed EMA wave for bull/bear bias.
Filter signals to trend direction (only ▲ in uptrend, only ▼ in downtrend).
Breach Signals with Practical Filters
Signals print when price touches/rejects the POC.
Filters: rejection close, ATR momentum guard, wick confirmation, ± margin tolerance, session time filter.
One-shot per bar; coded with object-limit hygiene.
Swing % Change Labels
Small labels at swing H/L showing % move across the last swing window.
Alerts
POC Breach Signal alert for automation/notifications.
🔹 USAGE
In the examples below, you see chart snapshot with labeled alerts/points of POV and POC rejections.
1 — Bearish POC Rejection (▼)
Price tags POC and closes below; ATR guard; EMA wave is bearish. Treat as trend-aligned continuation, reversals or risk tighten on longs.
2 — Bearish POV (LVN) Rejection (▼)
Price probes POV and fails to accept; low participation at PoV flips acceptance. Useful for rotation setups or partials.
3 — Bullish POV Rejection (▲)
Price tags POV and closes above; ATR guard; EMA wave is bullish. Treat as trend-aligned continuation, reversals or risk tighten on shorts.
Treat every signal as context, not as a command. The edge comes from combining location (POC/VA/PoV) with pressure (Node Strength/CVD/VWAP distance) and your structure/timing rules.
🔹 NAVIGATING MARKET CONDITIONS
Trending markets
Expect POC drift with trend; breaches tend to follow-through. Favor trend-aligned breaches; use PoV and VA for add/trim decisions.
Ranges
Frequent VA rotations VAH ↔ PoV ↔ POC ↔ VAL. Fades can work with tight invalidation; lean on PoV to avoid fighting acceptance near POC.
Regime shifts
Repeated failed breaches, PoV rejections, and developing POC re-anchoring are early tells. Adjust filters (ATR guard, wick) and window density as volatility changes.
🔹 SETTINGS SUMMARY
Profile Type: Swing / Session
Window: Present (developing) or Closed Profiles
Rows, lookback cap, Value Area %, optional background
Show POC (closed/developing), POC row highlight
VAH/VAL visibility, optional VA fill
Enable PoV detection (LVN inside VA).
Style controls; optional display with VA/POC.
Rejection close, ATR × multiplier, Wick % threshold, ± Margin %, Session time (trade inside/skip inside)
Enable EMA wave; lengths & smoothing
Toggle CVD; thickness (rows); colors; label text
Swing % change, tooltips, color controls
POC and POV Breach Alerts
🔹 GOOD PRACTICES
Think location + pressure: POC/VA/POV (where) × Node Strength/CVD/VWAP distance (how strong).
Align with HTF structure and liquidity; let POC/POV/VA act as decision levels (initiate, add, reduce, invalidate).
Calibrate row density per symbol/TF; too coarse = blind spots, too fine = noise.
Keep filters honest—if you must loosen them to force a trade, the setup isn’t there.
🔹 LIMITATIONS / DISCLAIMER
NBE does not use lookahead and does not repaint, but no indicator guarantees outcomes.
Node Strength, CVD, PoV, and thresholds are contextual, not signals on their own.
Use independent validation, position sizing, and strict risk management.
Trading involves substantial risk. This tool is for educational purposes only and is not financial advice. Past performance does not guarantee future results. You are solely responsible for your trading decisions and risk management.
Release Notes
v1.1 — PoV (Point of Void) & Profile CVD Bars
Added PoV = LVN inside Value Area as a dedicated anchor/line.
Added stacked profile Buy/Sell bars for closed & developing profiles (width-matched, thickness configurable).
Improved developing VA line/fill updates and object cleanup.
v1.0 — Initial invite-only
Swing/Session profiles; VAH/VAL + optional VA fill
Closed POC highlight + Developing POC path
Node Context Tooltip (POC price, Node Strength, CVD, VWAP distance, bars at price)
EMA wave (trend filter) + breach filters (rejection, ATR guard, wick, time, ± margin)
POC Breach Signal alert & price-panel markers

Volume Based Ranges (VBR) [SS]Here is the Volume Based Ranges or VBR indicator.
How it works
The indicator works by:
Sorting volume into buying and selling volume, then
Calculating 2 independent Z-Scores for buying and selling data, then
Identifying the high buying and selling nodes through the use of the Z-score threshold.
Tracks the average target/move based on buying and selling nodes over a designated lookforward horizon (i.e. if you want to see the average move a high selling node happens over 20 candles, you can modify the lookforward horizon to 20).
Calculates the composition from each volume node, displaying the composition information on each line (the % of buying and selling each node contains).
How to Use it
To use this indicator:
Select the Z-Score length of assessment: By default, z-score is 75 and this is usually fine to leave.
Identify the threshold trigger: This will need to be adjusted based on your timeframe. If you are using 1 minute, the data is noiser and you want more profound signals. Thresholds generally in this range should be between 5 - 7. For larger timeframes, you want to relax this threshold, to about 2 to 3. You can toggle in increments of 0.5 to find what works the best. Generally you want to see very rigorous volume node signals instead of tons of them.
Determine what you want to see: You can turn of the support and resistance lines and just have the node identification signals and the return boxes. Or, you can just have the support and resistance lines and turn off the return boxes. You can customize the information the indicator displays in the settings menu to suit what you are most interested in.
Let's look at some examples '
DIS on the hourly. We can see that the average up move from the high buying nodes has a target of 115.42, and in between there we can see the high selling and buying nodes and their compositions.
High buying (100% of the high buying volume) is around the 112.61. This means, you would expect this to be an area of retracement.
We can also see that high selling is just below that at 111.66, which can be a resistance area.
Here is a closer look at the levels specifically:
EPAM on the daily:
You can see a successful retrace back to a high volume node.
Concluding remarks
That's the indicator!
Its one that is best to get a feel for, play around and decide on the settings you like for your individual ticker.
I have included tooltip descriptions for the settings within the indicator as well.
I hope you enjoy it and find it helpful!
Thanks for reading/checking it out and as always, safe trades!

TitanEdge Algo Suite — 4H BTC & ETH (Delta Exchange Ready)TitanEdge Algo Suite — 4H BTC & ETH (Delta Exchange Ready)
TitanEdge Algo Suite is a next-generation trading system that fuses volatility-adaptive logic, order-block structure, SuperTrend direction filtering, and ATR-based exits into a single modular framework.
It’s engineered for 4-hour BTC and ETH swing trading, delivering institutional-grade entries, dynamic risk control, and precise exits.
⚙️ Core Features
1. Volatility Oscillator (0–100)
• Filters trades by volatility intensity.
• Uses ATR, Range, or Bollinger Band Width normalization.
• Trades trigger only when market volatility is high — filtering out sideways or weak trends.
• Ensures trades occur during real momentum expansions.
2. Breakout + Order Block Engine
• Detects pivot highs/lows to confirm authentic breakout levels.
• Identifies “smart money” gaps — institutional imbalance zones often leading to strong reversals or continuations.
• Captures both breakout continuations and order-block reversals.
• Works as a hybrid structure detector combining price action and volatility alignment.
3. SuperTrend Directional Filter
• Optional filter that only allows trades in the direction of the SuperTrend.
• Can automatically close trades when a SuperTrend flip occurs.
• Provides strong trend-following bias and helps avoid countertrend traps.
4. ATR-Based Stop & Trailing System
• Adaptive stop-loss and trailing logic that expands or tightens based on volatility.
• Supports three modes: StopOnly, TrailOnly, and StopAndTrail.
• Works in both ATR-based distance or percentage-based configuration.
• Keeps losing trades small and lets winning trades extend dynamically.
5. Volume-Based Exit Logic
• Detects low-volume exhaustion to identify momentum loss.
• Detects opposite-volume spikes as early reversal signals.
• Optional hybrid “Both” mode combines both detection methods for stronger reliability.
• Ideal for markets where volume surges indicate smart money exits or trap formations.
6. Session Filter & Anti-Churn Control
• Restrict trading hours (optional; not required for crypto).
• Prevents repeated signals and noise-based entries through minimum bars between trades.
• Cooldown logic ensures disciplined trading and avoids strategy overlap.
• Prevents multiple entries in a single bar and filters unconfirmed breakouts.
7. SmartMoney Preset Mode
• Institutional-grade configuration automatically adjusting volatility, ATR, and structural logic.
• Mimics smart money behavior by prioritizing clean structure and high liquidity volatility zones.
• Great for traders who want simplified institutional logic without manual tuning.
Optimized for 4H BTC & ETH
TitanEdge performs best on BTCUSDT and ETHUSDT pairs in the 4-hour timeframe.
The 4H chart captures high-volatility institutional swings, eliminates intraday noise, and provides clear order-block setups.
This timeframe aligns with BTC/ETH volatility cycles, providing consistent signals and cleaner trend confirmation.
Recommended settings for 4H charts:
• Levels Period: 25
• Volatility Filter: 20
• volatility oscillator Auto: disable ( it depend upon your plan test with Disable/enable)
• Volatility Method: BBWidth
• ATR Multiplier: 1.8
• ATR Stop %: 5
• SuperTrend ATR Length: 10
• SuperTrend Factor: 3
• ATR Mode: StopAndTrail
• Hold Bars: 1
• Volume Exit: Disable (Both)
• Session Filter: Off (Crypto runs 24/7)
Entry Logic
• Long Entry: Price breaks above resistance (pivot high), volatility above threshold, and optional SuperTrend confirmation.
• Short Entry: Price breaks below support (pivot low), volatility above threshold, and optional bearish SuperTrend confirmation.
• Additional Entry: Triggered by order-block gaps (smart money imbalances) in volatility expansion phases.
• Trades only when both direction and volatility align to ensure precision entries.
Exit Logic
• ATR Stop and Trail dynamically manage open trades.
• SuperTrend Flip forces exit on trend reversal.
• Volume Exit triggers when volume momentum drops or opposite spike occurs.
• Optional session close exit to flatten trades outside hours.
• Logic prevents premature exits with “Hold Bars” delay after entry.
Why You Need TitanEdge Algo Suite
• Trades only during high-volatility, strong-momentum phases — no false breakouts or choppy trades.
• ATR risk control automatically adjusts to each market’s volatility conditions.
• Identifies institutional order-blocks and clean breakouts for precise entries.
• SuperTrend filter adds directional bias, boosting win-rate consistency.
• Volume exit logic ensures profits are protected when market momentum fades.
• Works 24/7 across all major crypto pairs — fully automated and customizable.
• Built for 4H swing trades — fewer but higher-quality setups.
• Fully compatible with TradingView alerts and bot integration for hands-free execution.
How TitanEdge Makes Profit
• TitanEdge only trades during volatility expansion, when breakout continuation probability is statistically high.
• ATR dynamic stops prevent large losses by scaling protection according to real volatility.
• Trend filtering keeps positions aligned with major market flows.
• Order-block detection ensures entries are based on price structure rather than random signals.
• Volume-based exits secure profits early when momentum weakens.
• SmartMoney Preset provides optimal balance between trade frequency, accuracy, and drawdown control.
• The system compounds edge by maintaining trade discipline — fewer but stronger trades over time.
Delta Exchange Integration (TradingView Bot Ready)
TitanEdge is fully compatible with TradingView alert webhooks and can connect to Delta Exchange or any bot-supported broker.
Alert JSON message format:
{"symbol":"{{ticker}}","side":"{{strategy.order.action}}","qty":1,"trigger_time":"{{timenow}}","strategy_id":"code"}
qty 1 represent 1 lot so if you want to take trade with 5 lots or 0.05eth and write
{"symbol":"{{ticker}}","side":"{{strategy.order.action}}","qty":5,"trigger_time":"{{timenow}}","strategy_id":"code"}
Steps to automate:
Create an alert on TradingView using “Once Per Bar Close”.
Paste your bot or automation webhook URL.
Paste the JSON above as the message.
Configure your bot or API bridge (like PineConnector, AutoView, or WunderTrading) to route signals to Delta Exchange.
On Delta, use BTCUSD or ETHUSD Perpetual pairs with moderate leverage (3x–5x).
Enable Cross Margin for smooth drawdown handling.
Test first on Delta Testnet for safety.
Why 4H BTC & ETH Works Best
• 4H candles capture true volatility swings and filter lower-timeframe noise.
• Aligns with institutional liquidity cycles in BTC and ETH.
• ATR and volume-based stops perform optimally on larger bars.
• Smoother equity curve and less drawdown compared to intraday trading.
• Ideal for traders seeking structured, medium-term trades with high reward-to-risk.
Unique Edge
• Combines breakout, order-block, and volatility principles into one adaptive model.
• Incorporates volatility normalization (ATR/BBWidth) for multi-market adaptability.
• Dynamic ATR stops and trailing protect capital during unstable phases.
• Volume and trend exits create layered protection systems.
• 4H optimization eliminates noise and provides clear institutional alignment.
• SmartMoney preset auto-configures settings to mimic large-player behavior.
• Fully automated via webhooks — no manual execution required.
• Modular design lets you customize each component for different trading styles.
TradingView Bot Integration
TitanEdge is fully plug-and-play with all TradingView-compatible bots.
Each alert sends structured JSON data containing direction, symbol, and quantity, ready for execution on your connected broker.
You can route the data to:
• PineConnector (MT4/MT5 bridge)
• WunderTrading
• AutoView
• Custom Node/REST API handler
This makes TitanEdge a professional-grade strategy suitable for semi-automatic or fully automated crypto trading setups.
Professional Recommendations
• Timeframe: 4H
• Instruments: BTCUSDT, ETHUSDT
• Exchange: Delta Exchange (Perpetual Futures)
• Leverage: 3x–5x
• Session Filter: Off (crypto 24/7)
• Risk per trade: 0.5%–1% of total equity
• Alert Type: Once Per Bar Close
• Volatility Filter: 25–35 depending on market activity
• Always use realistic slippage and fees for backtests.
Summary
TitanEdge Algo Suite is a complete trading framework built to deliver institutional-quality precision with full automation support.
It captures powerful volatility expansions on 4H BTC and ETH charts using clean structure, adaptive stops, and directional trend filters.
Every feature — from entry logic to exits — is designed to protect capital and amplify performance through disciplined, volatility-aware execution.
TitanEdge is not just another script — it’s a professional-grade algorithm that combines volatility intelligence, structural precision, and adaptive risk control.
TitanEdge Algo Suite = Smart Logic × Trend Discipline × Adaptive Risk Control
Optimized for BTC & ETH on 4H charts. Built for traders who demand precision, control, and consistency.

VWAP (SIYL) Stdev Bands v2v2 indicator to allow for reversion-to-mean trading via the Stay In Your Lane approach.

nOI + Funding + CVD • strategynOI + Funding + CVD Strategy
Overview
This strategy is designed for cryptocurrency trading on platforms like TradingView, focusing on perpetual futures markets. It combines three key indicators—Normalized Open Interest (nOI), Funding Rate, and Cumulative Volume Delta (CVD)—to generate buy and sell signals for long and short positions. The strategy aims to capitalize on market imbalances, such as overextended open interest, funding rate extremes, and volume deltas, which often signal potential reversals or continuations in trending markets.
The script supports pyramiding (up to 10 positions), uses percentage-based position sizing (default 10% of equity per trade), and allows customization of trade directions (longs and shorts can be enabled/disabled independently). It includes multiple signal systems for entries, various exit mechanisms (including stop-loss, take-profit, time-based exits, and conditional closes based on indicators), a Martingale add-on system for averaging positions during drawdowns, and handling of opposite signals (ignore, close, or reverse).
This strategy is not financial advice; backtest thoroughly and use at your own risk. It requires data sources for Open Interest (OI) and Funding Rates, which are fetched via TradingView's security functions (e.g., from Binance for funding premiums).
Key Indicators
1. Normalized Open Interest (nOI)
Group: Open Interest
Purpose: Measures the relative level of open interest over a lookback window to identify overbought (high OI) or oversold (low OI) conditions, which can indicate potential exhaustion in trends.
Calculation:
Fetches OI data (close) from the symbol's standard ticker (e.g., "{symbol}_OI").
Normalizes OI within a user-defined window (default: 500 bars) using min-max scaling: (OI - min_OI) / (max_OI - min_OI) * 100.
Upper threshold (default: 70%): Signals potential short opportunities when crossed from above.
Lower threshold (default: 30%): Signals potential long opportunities when crossed from below.
Visualization: Plotted as a line (teal above upper, red below lower, gray in between). Horizontal lines at upper, mid (50%), lower, and a separator at 102%.
Notes: Handles non-crypto symbols by adjusting timeframe to daily if intraday. Errors if no OI data available.
2. Funding Rate
Group: Funding Rate
Purpose: Tracks the average funding rate (premium index) to detect market sentiment extremes. Positive funding suggests bull bias (longs pay shorts), negative suggests bear bias.
Calculation:
Fetches premium index data from Binance (e.g., "binance:{base}usdt_premium").
Supports lower timeframe aggregation (default: enabled, using 1-min TF) for smoother data.
Averages open and close premiums, clamps values, and scales/shifts for plotting (base: 150, scale: 1000x).
Upper threshold (default: 1.0%): Overheat for shorts.
Lower threshold (default: 1.0%): Overcool for longs.
Ultra level (default: 1.8%): Extreme for additional short signals.
Smoothing: Uses inverse weighted moving average (IWMA) or lower-TF aggregation to reduce noise.
Visualization: Shifted plot (green positive, red negative) with filled areas. Horizontal lines for overheat, overcool, base (0%), and ultra.
Notes: Custom ticker option for non-standard symbols.
3. Cumulative Volume Delta (CVD)
Group: CVD (Cumulative Volume Delta)
Purpose: Measures net buying/selling pressure via volume delta, normalized to identify divergences or confirmations with price.
Calculation:
Delta: +volume if close > open, -volume if close < open.
Cumulative: Rolling cumsum over a window (default: 500 bars), smoothed with EMA (default: 20).
Normalized: Scaled by absolute max in window (-1 to 1 range).
Scaled/shifted for plotting (base: 300 or 0 if anchored, scale: 120x).
Upper threshold (default: 1.0%): Over for shorts.
Lower threshold (default: 1.0%): Under for longs.
Visualization: Shifted plot (aqua positive, purple negative) with filled areas. Horizontal lines for over, under, and separator (default: 252).
Filter Options (for Signal A):
Enable filter (default: false).
Require sign match (Long ≥0, Short ≤0).
Require extreme zones.
Require momentum (rising/falling over N bars, default: 3).
Signal Logics for Entries
Entries are triggered by buy/sell signals from multiple systems (A, B, C, D), filtered by direction toggles and entry conditions.
Signal System A: OI + Funding (with optional CVD filter)
Enabled: Default true.
Sell (Short): nOI > upper threshold, falling over N bars (default: 3), delta ≥ threshold (default: 3%), funding > overheat, and CVD filter OK.
Buy (Long): nOI < lower threshold, rising over N bars (default: 3), delta ≥ threshold (default: 3%), funding < overcool, and CVD filter OK.
Signal System B: Short - Funding Crossunder + Filters
Enabled: Default true.
Sell (Short): Funding crosses under overheat level, optional: CVD > over, nOI < upper.
Signal System C: Short - Ultra Funding
Enabled: Default false.
Sell (Short): Funding crosses ultra level (up or down, both default true).
Signal System D: Long - Funding Crossover + Filters
Enabled: Default true.
Buy (Long): Funding crosses over overcool level, optional: CVD < under, nOI > lower.
Combined: Sell if A/B/C active; Buy if A/D active.
Entry Filters
Cooldown: Optional pause between entries (default: false, 3 bars).
Max Entries: Limit pyramiding (default: true, 6 max).
Entries only if both filters pass and direction allowed.
Opposite Signal Handling
Mode: Ignore (default), Reverse (close and enter opposite), or Close (exit only).
Processed before regular entries.
Position Management
Martingale (3 Steps):
Enabled per step (default: all true).
Triggers add-ons at loss levels (defaults: 5%, 8%, 11%) by adding % to position (default: 100% each).
Resets on position close.
Break Even:
Enabled (default: true).
Activates at profit threshold (default: 5%), sets SL better by offset (default: 0.1%).
Exit Systems
Multiple exits checked in sequence.
Exit 1: SL/TP
Enabled: Separate for long/short (default: true).
SL: % from avg price (defaults: 1% long/short).
TP: % from avg price (defaults: 2% long/short).
Exit 2: Funding
Enabled: Separate for long (up) / short (down) (default: true).
Long Exit: Funding > upper exit threshold (default: 0.8%).
Short Exit: Funding < lower exit threshold (default: 0.8%).
Exit 3: nOI
Enabled: Separate for long (up) / short (down) (default: true).
Long Exit: nOI > upper exit (default: 85%).
Short Exit: nOI < lower exit (default: 15%).
Exit 4: Global SL
Enabled: Default true.
Exit: If position loss ≥ % (default: 7%).
Exit 5: Break Even (integrated in position block)
Exit 6: Time Limit
Enabled: Separate for long/short (default: true).
Exit: After N bars in trade (defaults: 30 each).
Timer updates on add-ons if enabled (default: true).
Visual Elements
Buy/Sell Labels: Small labels ("BUY"/"SELL") on bars with signals, limited to last 30.
All indicators plotted on a separate pane (overlay=false).
Usage Notes
Backtesting: Adjust parameters based on asset/timeframe. Test on historical data.
Data Requirements: Works best on crypto perps with OI and funding data.
Risk Management: Incorporates SL/TP and global SL; monitor drawdowns with Martingale.
Customization: All thresholds, enables, and scales are inputs for fine-tuning.
Version: Pine Script v6.
For questions or improvements, contact the author. Happy trading!

LTF Volume Bubbles on HTFLTFVB HTF plots lower-timeframe volume “bubbles” directly on your higher-timeframe chart, so you can see where and how strong real intrabar activity is without dropping down a timeframe.

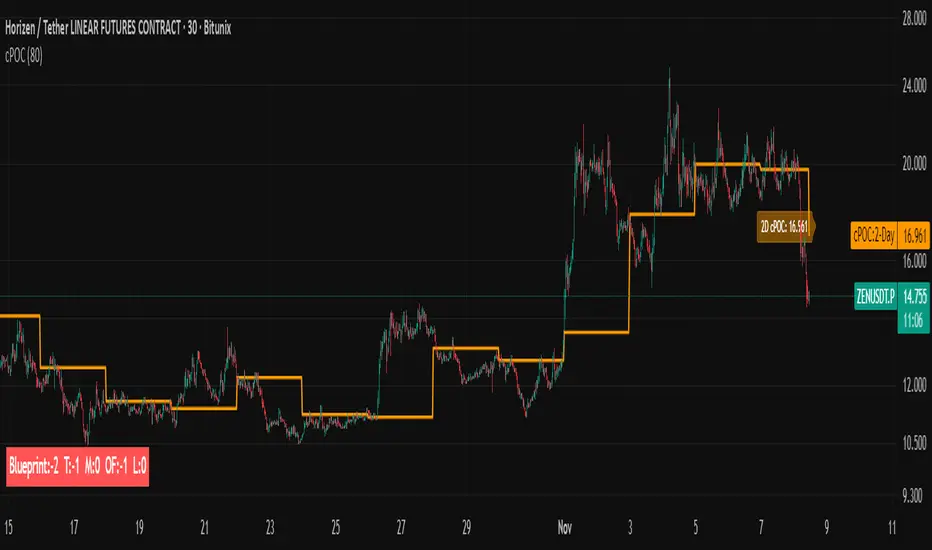
Trading Blueprint v7 Pro — VWAP-CVD, cPOC Trend MomentumTBv7 Pro is the advanced release of the Trading Blueprint framework — engineered for institutional-style intraday analysis that fuses VWAP location, CVD orderflow, composite profile bias, and momentum curvature into one cohesive system.
Core Framework
VWAP Structure → Adaptive mean anchored to session VWAP with ±1σ / ±2σ deviation envelopes for dynamic equilibrium detection.
vPOC per bar by ruckard ()
Anchored Volume Profile by DGT ()
CVD Orderflow Divergence → Smoothed delta histogram with fractal pivots identifying hidden absorption and exhaustion (patterns (Bull / Bear Div). Cumulative Volume Delta by AustrianTradingMachine )
cPOC Integration (2-Day Composite) by poopsnag (me :)→ Confirms true acceptance or rejection zones across sessions for precision bias alignment.
TMI (Trend Momentum Indicator by TradingRiot()) → Quantifies slope + mean crossover strength, providing actionable momentum confirmation (bullish / bearish support / divergence).
Bias Dashboard → Displays VWAP bias, numerical score, and dynamic color feedback for at-a-glance trade orientation.
Usage Context
Designed for professionals trading 15 m execution inside 1 h / 4 h context. Ideal for VWAP-cPOC location setups, reversion / continuation scalps, and orderflow confirmation using cumulative delta behavior.
🔧 Modules such as RSI / AO are pre-wired and easily activated for full Trading Blueprint confluence mapping.

cPOC 2 DayIt’s perfect for your 2-Day cPOC since:
It derives from volume distribution data.
It highlights market structure, value area, and composite volume behavior.
Traders searching for “cPOC,” “volume profile,” or “market profile” will find it here.
Use this if your indicator’s main function is showing POCs, VAH/VAL, or composite volume balance zones.
If your cPOC script is part of a broader system:
Trend Analysis — if it’s used for directional bias and context with VWAP/EMAs.
Support/Resistance — if the tool primarily highlights POC/VAH/VAL as static levels to trade from.
Other — only if your indicator mixes data from multiple frameworks (e.g., combines orderflow, delta, VWAP, and TPO).
Indicator Overview主力籌碼預判買賣力道 (JUMBO)Pro+ 2.0主力預判買賣力道 Pro+ 是一個先進的多維度交易分析系統,專為台灣股市投資者設計。本指標整合了趨勢、成交量、動量、價格位置和波動率五大維度,通過加權評分系統生成綜合的「Power指標」,精準預判主力資金動向。
🔧 核心技術架構
1. 多維度評分系統
趨勢維度 (30%):雙EMA系統 + MACD + ADX趨勢強度
成交量維度 (25%):OBV能量潮 + 成交量比率分析
動量維度 (20%):RSI + MFI資金流量指標
價格位置維度 (20%):VWAP + 布林通道位置分析
波動率維度 (5%):ATR波動率調整
2. 多重確認機制
趨勢確認:EMA金叉/死叉 + 超級趨勢方向
成交量確認:成交量脈衝檢測 + OBV趨勢確認
動量確認:RSI超買超賣 + MFI資金流向
位置確認:布林通道位置 + VWAP相對位置
📊 主要功能特色
訊號系統
主力佈局訊號 🟥
趨勢多頭確認 + Power > 35
成交量放大 + 動量指標多頭
RSI未超買 + 價格突破基準
主力出貨訊號 🟩
趨勢空頭確認 + Power < -35
成交量異常 + 動量指標空頭
RSI未超賣 + 價格跌破基準
Power交叉訊號 🟠🔵
黃金交叉:Power線向上穿越Power MA線
死亡交叉:Power線向下穿越Power MA線
視覺化系統
台灣股市顏色標準:紅色上漲/多頭,綠色下跌/空頭
多層級K線著色:強力訊號→普通訊號→偏多偏空→盤整
智能資訊面板:實時顯示8大關鍵指標狀態
⚙️ 參數設定說明
主要參數
EMA週期:13/55(短期/長期)
Power閾值:35(靈敏度調整)
成交量濾波:1.2倍(異常成交量檢測)
超級趨勢:10週期/3倍數(趨勢過濾)
進階參數
布林通道:20週期/2倍標準差
波動率設定:14週期ATR
動量指標:14週期RSI/MFI
🎯 交易應用策略
進場時機
強力買入:🔥標記 + Power黃金交叉
常規買入:紅色向上箭頭 + Power > 35
確認買入:多重條件同時滿足
出場時機
強力賣出:💧標記 + Power死亡交叉
常規賣出:綠色向下箭頭 + Power < -35
風險控制:趨勢反轉 + 動量減弱
風險管理
止損設定:ATR波動率參考
倉位控制:Power數值強度分級
訊號過濾:ADX趨勢強度確認
📈 指標優勢
高準確率:多重條件過濾,減少假訊號
及時性:領先指標預判主力動向
完整性:涵蓋技術分析主要維度
用戶友好:直觀的視覺化設計
自定義:參數可調適應不同交易風格
🎯 Indicator Overview
Main Force Prediction Buying/Selling Strength Pro+ is an advanced multi-dimensional trading analysis system specifically designed for Taiwan stock market investors. This indicator integrates five key dimensions: trend, volume, momentum, price position, and volatility, generating a comprehensive "Power Indicator" through a weighted scoring system to accurately predict institutional fund movements.
🔧 Core Technical Architecture
1. Multi-Dimensional Scoring System
Trend Dimension (30%): Dual EMA system + MACD + ADX trend strength
Volume Dimension (25%): OBV accumulation + Volume ratio analysis
Momentum Dimension (20%): RSI + MFI money flow index
Price Position Dimension (20%): VWAP + Bollinger Bands position analysis
Volatility Dimension (5%): ATR volatility adjustment
2. Multi-Confirmation Mechanism
Trend Confirmation: EMA golden/death cross + SuperTrend direction
Volume Confirmation: Volume spike detection + OBV trend confirmation
Momentum Confirmation: RSI overbought/oversold + MFI money flow
Position Confirmation: Bollinger Bands position + VWAP relative position
📊 Key Features
Signal System
Institutional Accumulation Signals 🟥
Bullish trend confirmation + Power > 35
Volume expansion + Momentum indicators bullish
RSI not overbought + Price breakthrough baseline
Institutional Distribution Signals 🟩
Bearish trend confirmation + Power < -35
Abnormal volume + Momentum indicators bearish
RSI not oversold + Price breakdown below baseline
Power Cross Signals 🟠🔵
Golden Cross: Power line crosses above Power MA line
Death Cross: Power line crosses below Power MA line
Visualization System
Taiwan Market Color Standard: Red for uptrend/bullish, Green for downtrend/bearish
Multi-level Candlestick Coloring: Strong signals → Regular signals → Bias signals → Consolidation
Smart Info Panel: Real-time display of 8 key indicator statuses
⚙️ Parameter Settings
Main Parameters
EMA Periods: 13/55 (Short-term/Long-term)
Power Threshold: 35 (Sensitivity adjustment)
Volume Filter: 1.2x (Abnormal volume detection)
SuperTrend: 10 period/3 multiplier (Trend filtering)
Advanced Parameters
Bollinger Bands: 20 period/2 standard deviations
Volatility Settings: 14 period ATR
Momentum Indicators: 14 period RSI/MFI
🎯 Trading Application Strategies
Entry Timing
Strong Buy: 🔥 Mark + Power Golden Cross
Regular Buy: Red upward arrow + Power > 35
Confirmed Buy: Multiple conditions simultaneously met
Exit Timing
Strong Sell: 💧 Mark + Power Death Cross
Regular Sell: Green downward arrow + Power < -35
Risk Control: Trend reversal + Momentum weakening
Risk Management
Stop Loss Setting: ATR volatility reference
Position Sizing: Power value strength grading
Signal Filtering: ADX trend strength confirmation
📈 Indicator Advantages
High Accuracy: Multiple condition filtering reduces false signals
Timeliness: Leading indicators predict institutional movements
Completeness: Covers main dimensions of technical analysis
User-Friendly: Intuitive visualization design
Customizable: Adjustable parameters adapt to different trading styles
🔍 Professional Usage Tips
Trend Confirmation: Use in conjunction with major trend direction
Volume Validation: Ensure volume confirms price movements
Risk Management: Always use appropriate position sizing
Timeframe Analysis: Apply across multiple timeframes for confirmation
Market Context: Consider overall market conditions and sector rotation
版本: Pro+ 2.0
適用市場: 台股、亞股、全球股市
最佳時間框架: 日線、4小時線、1小時線
開發者: JUMBO Trading System
更新日期: 2025版本

1BullBear™ StatisticsOverview
1BullBear™ Statistics is a comprehensive volume delta analysis tool that transforms raw order flow data into actionable visual insights. This indicator displays seven key metrics in a clean, gradient-based heatmap format below your price chart, helping you identify significant buying and selling pressure in real-time.
Key Features: Seven Essential Metrics
Volume - Total volume per bar with threshold highlighting
Delta - Net buying/selling pressure (Buy Volume - Sell Volume)
Cumulative Delta - Session-based running total of delta
Delta Ratio - Delta expressed as a percentage of total volume
Minimum - Lowest delta value within the bar's timeframe
Maximum - Highest delta value within the bar's timeframe
Standard Deviation - Statistical measure of delta volatility within the session
Intelligent Gradient Visualization
Dynamic color intensity based on historical significance
Adaptive scaling using configurable lookback periods (10-200 bars)
Threshold-based highlighting to immediately spot extreme values
Separate bull/bear coloring for directional clarity
Customizable transparency for optimal chart integration
Flexible Configuration
Toggle any metric on/off to focus on what matters
Custom labels - rename metrics to your preference
Independent color schemes for each row
Adjustable thresholds for highlighting significant values
Multiple text sizes from tiny to huge
Session-aware calculations that reset at market open
Real-Time Updates
Confirmed bars display permanent historical data
Current bar updates in real-time as price action develops
Efficient rendering with automatic cleanup of previous bars
Handles up to 500 boxes for extensive historical analysis
How It Works
The indicator uses TradingView's native volume delta data (sourced from lower timeframe aggregation) to calculate order flow statistics. Each metric is displayed as a colored box below the chart, with gradient intensity representing the value's significance relative to recent history.
Gradient Logic:
Stronger colors = more significant values relative to the lookback period
Transparent backgrounds = values below threshold (filtered out)
Color saturation scales from 0% to your set maximum opacity
Session Management:
Cumulative Delta and Standard Deviation reset at each new trading session
Session detection uses exchange timezone for accurate daily calculations
Historical lookback maintains a rolling window for gradient intensity
I deal Use Cases
Scalping & Day Trading - Identify aggressive buying/selling in real-time
Order Flow Analysis - Understand market participant behavior
Divergence Detection - Spot when price and delta disagree
Volume Profile Context - Complement VP analysis with granular delta data
Breakout Confirmation - Verify price moves with volume delta agreement
Default Thresholds
The indicator comes pre-configured with sensible defaults for futures trading:
Volume: Highlights bars above 1,500 contracts
Delta: Flags extremes beyond ±500
Delta Ratio: Alerts on imbalances beyond ±70%
Min/Max: Range filter of ±10 for precision
Std Dev: Highlights outliers beyond ±0.7 standard deviations
Adjust these values based on your instrument and timeframe.
Technical Notes
Requires real-time volume delta data from your broker
Works best on instruments with strong volume (futures, major stocks, crypto)
Lower timeframe aggregation defaults to 1-second or 1-minute depending on chart timeframe
Optimized performance with efficient array management and conditional rendering
Compatibility
Pine Script™ v6
All timeframes supported
Best results on liquid instruments with reliable volume data
Integrates seamlessly with other TradingView indicators
Created by KweeBoss_ | Licensed under Mozilla Public License 2.0
Note: This indicator analyzes historical and real-time volume data. Past performance does not guarantee future results. Always combine with other forms of analysis and proper risk management.

Michie Breakout 1.0A precision breakout indicator built with adaptive machine learning logic and price action principles.
Designed specifically for TSLA, it detects key volatility shifts and directional momentum zones to capture high-probability breakout setups while filtering noise.
Focuses on clarity, adaptability, and accuracy — optimized for real-time intraday trading.

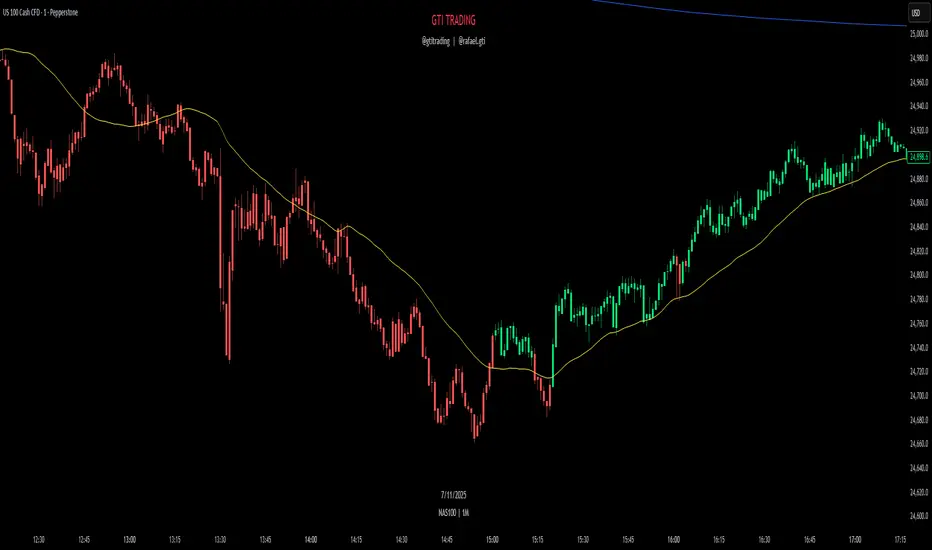
GTI TrendThe GTI Trend is a trend-detection indicator that highlights potential market direction by coloring candles based on internal analysis of higher timeframe momentum and price action behavior.
Unlike simple moving average crossovers or RSI thresholds, GTI Trend uses a proprietary blend of price positioning logic and multi-timeframe validation. Specifically, it evaluates candle structures and key breakout zones from larger timeframes to determine whether short-term movements align with higher timeframe momentum — helping traders avoid false breakouts and identify real trend continuation zones.
The result is a real-time visual cue: green candles for bullish bias and red candles for bearish bias — tuned for lower timeframes like 1m, 3m, and 5m. This helps scalpers and short-term traders align entries with broader market structure.
How It Works
GTI Trend is built around the concept of directional alignment. It compares short-term price action against higher timeframe swing zones and dynamic reference levels. When price confirms breakout behavior while staying within those zones, the candle turns green or red accordingly. This avoids the lag often seen in classic indicators.
The system dynamically adapts to market volatility, making it particularly effective in fast-moving sessions like the New York Open (typically from 10:30 AM GMT -3).
Confluence Strategy
The GTI Trend is most effective when combined with a 38-period short-term moving average. If the candle is green and the price is above the MA, this confirms a bullish continuation. Conversely, a red candle below the MA may suggest a bearish reversal.
Pairing it with VWAP is also recommended, especially in index markets, as this highlights possible support/resistance zones to validate the signal.
Recommended Markets
The GTI Trend performs best on high-volatility assets such as NASDAQ, US30, SP500, Gold (XAUUSD), and the Brazilian mini index. However, it can be applied to any asset with sufficient price movement.
VWAP Kalman FilterOverview
This indicator applies Kalman filtering techniques to Volume Weighted Average Price (VWAP) calculations, providing a statistically optimized approach to VWAP analysis. The Kalman filter reduces noise while maintaining responsiveness to genuine price movements, addressing common VWAP limitations in volatile or low-volume conditions.
Technical Implementation
Kalman Filter Mathematics
The indicator implements a state-space model for VWAP estimation:
- Prediction Step: x̂(k|k-1) = x̂(k-1|k-1) + v(k-1)
- Update Step: x̂(k|k) = x̂(k|k-1) + K(k)
- Kalman Gain: K(k) = P(k|k-1) / (P(k|k-1) + R)
Where:
- x̂ = estimated VWAP state
- K = Kalman gain (adaptive weighting factor)
- P = error covariance
- R = measurement noise
- Q = process noise
- v = optional velocity component
Core Components
Dual VWAP System
- Standard VWAP: Traditional volume-weighted calculation
- Kalman-filtered VWAP: Noise-reduced estimation with optional velocity tracking
- Real-time divergence measurement between filtered and unfiltered values
Adaptive Filtering
- Process Noise (Q): Controls adaptation to price changes (0.001-1.0)
- Measurement Noise (R): Determines smoothing intensity (0.01-5.0)
- Optional velocity tracking for momentum-based filtering
Multi-Timeframe Anchoring
- Session, Weekly, Monthly, Quarterly, and Yearly anchor periods
- Automatic Kalman state reset on anchor changes
- Maintains VWAP integrity across timeframes
Features
Visual Components
- Dual VWAP Lines: Compare filtered vs. unfiltered in real-time
- Dynamic Bands: Three-level deviation bands (1σ, 2σ, 3σ)
- Trend Coloring: Automatic color adaptation based on price position
- Cloud Visualization: Highlights divergence between standard and Kalman VWAP
- Signal Markers: Crossover and band-touch indicators
Trading Signals
- VWAP crossover detection with Kalman filtering
- Band touch alerts at multiple standard deviation levels
- Velocity-based momentum confirmation (optional)
- Divergence warnings when filtered/unfiltered values separate
Information Display
- Real-time VWAP values (both standard and filtered)
- Trend direction indicator
- Velocity/momentum reading (when enabled)
- Divergence percentage calculation
- Anchor period display
Input Parameters
VWAP Settings
- Anchor Period: Choose calculation reset period
- Band Multipliers: Customize deviation band distances
- Display Options: Toggle standard VWAP and bands
Kalman Parameters
- Length: Base period for calculations (5-200)
- Process Noise (Q: Higher values increase responsiveness
- Measurement Noise (R): Higher values increase smoothing
- Velocity Tracking: Enable momentum-based filtering
Visual Controls
- Toggle filtered/unfiltered VWAP display
- Band visibility options
- Signal markers on/off
- Cloud fill between VWAPs
- Bar coloring by trend
Use Cases
Noise Reduction
Particularly effective during:
- Low volume periods (pre-market, lunch hours)
- Volatile market conditions
- Fast-moving markets where standard VWAP whipsaws
Trend Identification
- Cleaner trend signals with reduced false crosses
- Earlier trend detection through velocity component
- Confirmation through divergence analysis
Support/Resistance
- Filtered VWAP provides more stable S/R levels
- Bands adapt to filtered values for better zone identification
- Reduced false breakout signals
Technical Advantages
1. Optimal Estimation: Mathematically optimal under Gaussian noise assumptions
2. Adaptive Response: Self-adjusting to market conditions
3. Predictive Element: Velocity component provides forward-looking insight
4. Noise Immunity: Superior noise rejection vs. simple moving average smoothing
Limitations
- Assumes linear price dynamics
- Requires parameter optimization for different instruments
- May lag during sudden volatility regime changes
- Not suitable as standalone trading system
Mathematical Background
Based on control systems theory, the Kalman filter provides recursive Bayesian estimation originally developed for aerospace applications. This implementation adapts the algorithm specifically for financial time series, maintaining VWAP's volume-weighted properties while adding statistical filtering.
Comparison with Standard VWAP
Standard VWAP Issues Addressed:
- Choppy behavior in low volume
- Whipsaws around VWAP line
- Lag in trend identification
- Noise in deviation bands
Kalman VWAP Benefits:
- Smooth yet responsive line
- Fewer false signals
- Optional momentum tracking
- Statistically optimized filtering
Alert Conditions
The indicator includes several pre-configured alert conditions:
- Bullish/Bearish VWAP crosses
- Upper/Lower band touches
- High divergence warnings
- Velocity shifts (if enabled)
---
This open-source indicator is provided as-is for educational and trading purposes. No guarantees are made regarding trading performance. Users should conduct their own testing and validation before using in live trading.

Smart Liquidity 📊 # 💎 Smart Liquidity Indicator - User Guide
## 📋 Overview
**Smart Liquidity Indicator** is an advanced technical analysis tool for analyzing liquidity and volume in financial markets. It combines several powerful analytical tools to help you make informed trading decisions.
---
## 🎯 Main Components
### 1. 📊 Volume Profile
- **Function**: Displays volume distribution across different price levels
- **Benefit**: Identify strong support and resistance zones based on trading activity
- **Elements**:
- Colored boxes representing volume density at each level
- Labels showing HIGH/LOW of the price range
- PEAK FLOW line indicating the strongest volume level
### 2. 📦 Order Blocks
- **Function**: Identify bullish and bearish Order Block zones
- **Benefit**: Potential areas for price reversal or trend continuation
- **Displayed Information**:
- Delta %: Zone strength (difference between buying and selling pressure)
- Liquidity: Accumulated liquidity in the zone
- Buy/Sell ratios within the zone
### 3. 📈 SuperTrend (Market Direction)
- **Two lines for confirmation**:
- **🎯 Current SuperTrend** (Green/Red): Current timeframe direction
- **🔄 MTF SuperTrend** (Light Green/Red): Higher timeframe direction (4H default)
- **Benefit**: Trade with the overall market trend
### 4. 📊 Dashboard (Information Panel)
- Display current market status
- Trend and momentum information
- Active Order Blocks statistics
---
## 🚀 How to Use
### 1️⃣ **Reading Volume Profile**
- **Dense boxes** = High volume accumulation areas = Strong support/resistance
- **PEAK FLOW line** = Strongest price level (POC - Point of Control)
- **HIGH/LOW Labels** = Boundaries of the analyzed price range
### 2️⃣ **Analyzing Order Blocks**
- **Positive Delta (+)** = Strong buying pressure → Reliable bullish zone
- **Negative Delta (-)** = Strong selling pressure → Reliable bearish zone
- **Delta near 0** = Balance → Weak zone, avoid it
### 3️⃣ **Using SuperTrend**
- **Current TF (Green bullish / Red bearish)**: Current timeframe direction
- **MTF (Light Green bullish / Light Red bearish)**: Higher timeframe direction
- **Best Trading**: When both lines agree on the same direction
### 4️⃣ **Suggested Strategy**
```
✅ Strong Entry Signal:
1. Order Block with strong Delta (>30% or <-30%)
2. Current SuperTrend and MTF in the same direction
3. Volume Profile confirms the level (dense box or PEAK)
4. Price tests the zone for the first time
❌ Avoid Entry When:
- Weak Delta (between -10% and +10%)
- Conflict between Current and MTF SuperTrend
- Zone tested multiple times (weakened)
```
---
## 🎨 Understanding Colors
### Order Blocks
- 🟢 **Green**: Bullish Order Block
- 🔴 **Red**: Bearish Order Block
### SuperTrend
- 🟢 **Green**: Current SuperTrend bullish (same color as Order Blocks)
- 🔴 **Red**: Current SuperTrend bearish (same color as Order Blocks)
- 🟢 **Light Green**: MTF SuperTrend bullish
- 🔴 **Light Red**: MTF SuperTrend bearish
**Note**: Each SuperTrend has different transparency levels based on trend strength
### Volume Profile
- **Gradient from light to dark**: Represents volume density (darker = higher volume)
---
## ⚡ Performance Tips
### For Maximum Speed (Current Settings):
✅ **Enabled**:
- Order Blocks: 2 zones per side
- Volume Profile: 20 levels
- SuperTrends: Both active
- Strength Delta: Displayed
❌ **Disabled** (for speed):
- Gradient Fill
- Predictive Zones
- Background Fill
- MTF Calculations (in internal calculations)
### If Indicator is Slow:
1. Reduce `Profile Rows` from 20 → 15
2. Reduce `Lookback Period` from 50 → 40
3. Reduce `Max Zones` from 2 → 1
4. Turn off `Show OB Labels` if not needed
---
## 🔄 Additional Tools
### ♻️ Reset Now
- **Location**: Visual Tweaks
- **Usage**: If Volume Profile is cluttered, enable it to redraw
- **Note**: Disable after use
### 🎯 Draw Mode
- **Live**: Direct drawing on the last candle
- **Confirmed**: Draw only on closed candles (more stable)
---
## ⚠️ Disclaimer
### 🚨 Important Notice
**This indicator is a technical analysis tool only and is not considered financial advice or a trading recommendation.**
#### 📌 Please Note:
1. **Just an Analytical Tool**:
- The indicator provides technical information based on historical data
- Past results do not guarantee future results
2. **Personal Responsibility**:
- You are solely responsible for your own trading decisions
- Conduct your own research before making any investment decision
- Use appropriate risk management (Stop Loss, Position Sizing)
3. **No Guarantees**:
- There is no guarantee of profit or success in trading
- Financial markets carry high risks
- You may lose your entire invested capital
4. **Consult a Professional**:
- Consult a licensed financial advisor before making important investment decisions
- Ensure you fully understand the risks associated with trading
5. **Proper Use**:
- The indicator is designed as an assistive tool, not an automated trading system
- Preferably combine it with your own analysis and other tools
- Do not rely on a single signal alone
#### ⚖️ Acceptance:
By using this indicator, you acknowledge and agree that:
- The indicator developer is not responsible for any financial losses
- All trading decisions are your personal responsibility
- You understand the risks associated with trading in financial markets
---
## 💡 Final Advice
**"The best traders use tools wisely, not blindly"**
- Learn how the indicator works before relying on it
- Test settings on a demo account first
- Always use Stop Loss
- Don't risk more than you can afford to lose
---
## 📞 Contact and Support
**If you need any help or have any questions, feel free to contact me.**
I'm here to help you understand and use the indicator correctly! 🤝
---
**Good Luck & Trade Safe! 🚀📈**

Price Action Scanner (v1)Price Action Scanner 1st addition, This indicator is begging developed using many combination and basing signal in price action and market volume. After years of trading I'm trying to make something simple to trade SPY, IWM and QQQ.

Liquidation Reversal Signals [AlgoAlpha]🟠 OVERVIEW
This tool detects potential liquidation-driven reversals by combining z-score analysis of up/down volume with the classic Supertrend. It watches for abnormal surges in directional volume (on a lower timeframe) and links them to trend flips on the main chart. When both align within a short window, it flags a probable reversal caused by forced liquidations. The goal is to help traders identify exhaustion points where aggressive liquidation moves may mark the end of a trend leg.
🟠 CONCEPTS
The logic revolves around Z-score normalization of up and down volume to locate statistical extremes. When up-volume z-scores exceed a threshold during a bearish Supertrend, it implies trapped shorts being squeezed; the opposite applies for long liquidations. The script tracks these liquidation spikes and monitors whether a Supertrend regime change follows soon after. If confirmed within the allowed timeout, a colored signal marks the event.
In essence:
Z-score outliers = potential forced liquidations.
Supertrend = structural regime context.
Combined = statistically confirmed reversal signals, not random flips.
This pairing reduces false positives by ensuring that both volatility structure and order-flow extremes agree before flagging a reversal.
🟠 FEATURES
Z-score detection for liquidation spikes with adjustable lookback and threshold.
Confirmation logic linking liquidations to Supertrend flips.
Alerts for liquidation spikes and confirmed reversal starts.
On-chart “No Volume” warning to avoid misreads on illiquid assets.
🟠 USAGE
Setup : Add the script to your main chart. Choose a lower timeframe (default 15m) to capture more granular liquidation flows. Adjust Z-Score Length to control how far back the script measures normal behavior and Threshold to decide what counts as extreme. Keep Timeout Bars low (e.g. 20–50) for faster reversals, or higher for slower markets.
Read the chart :
• Circles appear below bars when long liquidations occur; above bars for short liquidations.
• A Supertrend flip with a recent liquidation spike will display an arrow and color shift.
• Fills between candles and trend lines show which side dominates: green for bullish reversal, red for bearish.
• Candle color fades based on the magnitude of liquidation pressure.
Settings that matter :
• Z-Score Length : Longer smooths noise but delays signal; shorter reacts faster.
• Z-Score Threshold : Higher means only extreme liquidations trigger; lower finds smaller squeezes.
• Timeout Bars : Defines how long after a liquidation the Supertrend flip remains valid.
• Lower Timeframe : Determines the precision of volume readings; too low may increase noise.

SMC Clean: Structure + LiquidityThis indicator provides Smart Money Concepts (SMC) tools designed to help traders analyze market structure, liquidity pools, and institutional trading zones. It combines several popular SMC methods into one powerful, customizable tool, with a clean and controlled chart display.
Features and How it Works:
Swing Highs and Lows: The indicator identifies confirmed swing highs and swing lows using a lookback period (default: 15 bars). These points form the basis for market structure analysis.
Equal Highs/Equal Lows (EQH/EQL): When price action creates repeated swing highs or lows within a defined tolerance, the tool automatically marks these areas as potential liquidity pools. These are levels where multiple stop orders may accumulate, sometimes leading to significant market moves.
Liquidity Lines & Sweeps: Liquidity lines highlight unswept highs and lows, making it easy to see where price may hunt liquidity. When price crosses a swing high/low and closes back, a sweep label is shown (optional).
BOS/CHOCH Detection:
Break of Structure (BOS): Signals a continuation of the current trend if price closes beyond the previous swing point.
Change of Character (CHOCH): Highlights when price reverses and breaks a key swing from the opposite direction, hinting at a potential trend change or shift in market regime.
Only confirmed swing points are considered to avoid repainting.
Premium & Discount Zones Explained:
After a new confirmed swing high and swing low, the area between them forms a “range.”
The premium zone is the upper half (from midpoint to swing high): this is typically considered where price is “expensive” or overvalued for the current swing, and is often watched for potential sell setups.
The discount zone is the lower half (from swing low to midpoint): this is where price is “cheap” or undervalued for the current swing, commonly monitored for potential buy setups.
Colored boxes mark these zones on your chart for instant reference.
Dashboard (Movable Position):
A visually enhanced dark-themed dashboard shows the current market structure (Bullish/Bearish), liquidity bias (Buy-Side, Sell-Side, or Balanced, based on unswept levels), and last swept side (i.e., which liquidity pool was last taken by price).
Dashboard position can be set anywhere on your chart for best visibility.
Customization Options:
Enable/disable any feature individually for a cleaner chart.
Control colors, transparency, and swing sensitivity via user settings.
How to Use:
Add the indicator to your chart and adjust settings to fit your trading style.
Use swing lines and dashboard to determine current market structure and bias.
Watch equal highs/lows and liquidity lines for possible sweep events.
Use the premium/discount zones to locate optimal areas for trade entries—with institutional logic, buy when price reaches the discount (lower) zone, and look for sales in the premium (upper) zone.
Use BOS/CHOCH signals as objective confirmations of trend or regime changes. Always interpret signals in context of broader price action.
Important Notes:
This indicator is educational and analytical—NO signals are guaranteed.
All calculations are non-repainting and use only confirmed price data (no lookahead).
No claims of predicting future price movement or performance are made.
Disclaimer:
This tool is for technical analysis education only. It is not a financial advice nor a guaranteed trading system. Please test all signals and concepts before using in live markets.

Pulsar Trading System-LITE📡 Pulsar Trading System
OVERVIEW
Pulsar is a comprehensive breakout trading system that combines dynamic support/resistance detection, trend filtering, and volume confirmation to identify high-probability entry opportunities. Unlike simple breakout indicators, Pulsar uses multi-timeframe analysis and adaptive ATR-based calculations to filter false signals and provide complete trade management from entry to exit.
WHAT MAKES THIS ORIGINAL
This indicator is unique in its integration of multiple complementary systems:
-Adaptive ATR Zones: Support and resistance levels are not static—they dynamically adjust based on current market volatility (ATR), creating entry zones that expand and contract with market conditions rather than using fixed price levels.
-Multi-Timeframe SuperTrend Filter: The trend filter operates on a higher timeframe than the chart (e.g., 5-minute SuperTrend on a 1-minute chart) to prevent counter-trend trades while maintaining granular entry precision. The visual ribbon with humorous warning text ("🚫 Don't Short - Trend is Your Friend! 📈") provides immediate trend awareness.
-Intelligent Cooldown System: After any trade exit (stop loss or take profit), the system enters a configurable cooldown period, preventing overtrading during choppy or consolidating market conditions—a critical feature often missing in breakout systems.
-Dynamic Trailing Stops: The trailing stop uses ATR multipliers to lock in profits while adapting to volatility, moving only in the favorable direction and never loosening.
-Comprehensive Dashboard: Real-time analysis displays trade status, entry prices, distances to targets in both points and ATR multiples, volume confirmation status, and cooldown countdown.
HOW IT WORKS
Core Detection Logic:
Pulsar identifies breakout opportunities by monitoring price interaction with dynamically calculated support and resistance levels:
Support/Resistance Calculation: Uses ta.lowest() and ta.highest() over a configurable lookback period to identify key levels, then adds ATR-based buffers (0.5 × ATR) to create entry zones.
Breakout Conditions:
Long Entry: Price closes above support buffer AND recent low touched support AND volume exceeds threshold
Short Entry: Price closes below resistance buffer AND recent high touched resistance AND volume exceeds threshold
SuperTrend Filter: A separate higher-timeframe SuperTrend calculation determines overall trend direction. Entries only trigger when breakout direction aligns with SuperTrend (bullish breakout + bullish trend, or bearish breakout + bearish trend).
Volume Confirmation: Current volume must exceed a configurable multiple of the 14-period SMA (default 1.0×) to confirm genuine interest in the breakout.
Cooldown Mechanism: After exit, the system tracks bars elapsed and blocks new signals until the cooldown period completes, preventing rapid-fire entries in ranging markets.
Trade Management:
Stop Loss: Calculated as entry zone ± (ATR × SL Multiplier)
Take Profit 1: Entry zone ± (ATR × TP1 Multiplier)
Take Profit 2: Entry zone ± (ATR × TP2 Multiplier)
Trailing Stop (optional): Updates every bar, moving the stop closer by maintaining distance of (ATR × Trailing Multiplier) from current price, but only in favorable direction
SuperTrend Calculation:
The SuperTrend uses standard methodology:
Upper Band = (High + Low) / 2 + (Multiplier × ATR)
Lower Band = (High + Low) / 2 - (Multiplier × ATR)
Direction changes when price crosses opposite band
The ribbon visualization adds a width offset (ATR × Ribbon Width) to create a filled zone rather than a single line.
HOW TO USE
Setup:
Add Pulsar to your chart (works best on liquid instruments like NQ, ES, CL)
Configure timeframe-specific settings (see recommendations below)
Enable SuperTrend Filter for trend-following mode, or disable for pure breakout mode
Set up alerts for Entry, TP1, TP2, and Stop Loss events
Recommended Settings by Timeframe:
1-Minute Charts:
Lookback Period: 10-15
SuperTrend Timeframe: 5 min
ATR Timeframe: 5 min (for stability)
Cooldown: 8-12 bars
Trailing Stop: Enabled with 0.8-1.0 multiplier
5-Minute Charts:
Lookback Period: 15-20
SuperTrend Timeframe: 15 min
ATR Timeframe: current chart
Cooldown: 5-8 bars
Trailing Stop: Optional
15-Minute+ Charts:
Lookback Period: 20-30
SuperTrend Timeframe: 1 hour
ATR Timeframe: current chart
Cooldown: 3-5 bars
Trailing Stop: Optional
Interpreting Signals:
Long/Short Zone Box: Green (long) or red (short) box appears when breakout conditions are met
Blue Entry Line: Shows your entry price
Red/Orange SL Line: Red = fixed stop, Orange = trailing stop (moves in real-time)
Green TP Lines: TP1 (closer) and TP2 (further) targets
SuperTrend Ribbon: Green = bullish trend (favor longs), Red = bearish trend (favor shorts)
Dashboard Status: Monitor trade state, distances, volume confirmation, and cooldown
Best Practices:
Use SuperTrend Filter: Significantly reduces false signals by avoiding counter-trend trades
Enable Cooldown on Fast Timeframes: Prevents overtrading on 1-5 minute charts
Volume Confirmation is Critical: Don't lower volume multiplier below 0.9 on futures
Use Higher Timeframe ATR: On 1-minute charts, use 5-minute ATR for stability
Avoid Major News Events: Disable during FOMC, NFP, CPI releases
Scale Out Strategy: Consider taking partial profits at TP1, letting remainder run to TP2
Parameter Optimization:
Start conservative and adjust based on results:
Too many stop-outs: Increase SL multiplier or SuperTrend multiplier
Missing good trades: Decrease volume multiplier or cooldown period
Too many false signals: Increase volume multiplier, lookback period, or cooldown
Profits not protected: Enable trailing stop or reduce trailing multiplier
KEY FEATURES
✅ Dynamic ATR-Based Zones: Entry, stop loss, and take profit levels automatically adjust to market volatility
✅ Multi-Timeframe Trend Filter: Uses higher timeframe SuperTrend to eliminate counter-trend trades
✅ Volume Confirmation: Filters low-volume false breakouts
✅ Intelligent Cooldown: Prevents overtrading with configurable post-trade waiting period
✅ Trailing Stop System: Optional dynamic stops that lock in profits using ATR distance
✅ Real-Time Dashboard: 13-row analysis showing trade status, targets, distances, volume, and cooldown
✅ Visual Ribbon Warnings: Humorous trend-following reminders on SuperTrend ribbon
✅ Complete Alert System: Notifications for entries, TP1, TP2, fixed stops, and trailing stops
✅ Customizable Visuals: Adjustable colors, dashboard position, text size, and line lengths
✅ Non-Repainting: Uses lookahead = barmerge.lookahead_off for all multi-timeframe calculations
SETTINGS EXPLAINED
SuperTrend Filter:
Enable: Toggle trend filtering on/off
Timeframe: Higher timeframe for trend analysis (recommended 3-5x chart timeframe)
ATR Period: Period for ATR calculation in SuperTrend (10-14 standard)
Multiplier: Distance from center band (2.5-3.5 for most markets)
Ribbon Width: Visual thickness of trend ribbon (0.2-0.5)
Core Parameters:
Lookback Period: Bars used to identify support/resistance (lower = more sensitive)
ATR Period: Bars for Average True Range calculation (14 is standard)
ATR Timeframe: Use higher timeframe ATR for smoother calculations on fast charts
Volume Multiplier: Required volume vs average (1.0 = average, 1.5 = 50% above average)
TP/SL:
SL Multiplier: Stop loss distance in ATR units (1.0-2.0 typical)
TP1 Multiplier: First target in ATR units (1.5-2.5 typical)
TP2 Multiplier: Second target in ATR units (2.0-3.5 typical)
Trailing Stop:
Enable: Activate dynamic trailing stop
Multiplier: Distance from current price in ATR units (0.8-1.5 typical)
Cooldown:
Enable: Prevent new signals after trade exit
Bars: Number of bars to wait before allowing next trade (higher on fast timeframes)
IMPORTANT NOTES
⚠️ Not a Holy Grail: No indicator is perfect. Pulsar is a tool that requires proper risk management, position sizing, and trading discipline.
⚠️ Backtest First: Test settings on historical data before live trading. Results vary by instrument, timeframe, and market conditions.
⚠️ Market Conditions Matter: Breakout systems perform best in trending markets. Consider reducing size or disabling during known choppy periods.
⚠️ Stop Loss is Mandatory: Always use the provided stop loss levels. Markets can move against you rapidly.
⚠️ Volume Data Required: This indicator requires volume data to function properly. It will display a warning if volume is unavailable.
⚠️ No Repainting: All multi-timeframe calls use non-repainting settings. What you see in real-time is what will be plotted historically.
TECHNICAL SPECIFICATIONS
Version: Pine Script v6
Type: Indicator (overlay = true)
Max Boxes: 500 (for zone visualization)
Max Lines: 500 (for TP/SL levels)
Max Labels: Unlimited (for annotations)
Repainting: None (uses lookahead = barmerge.lookahead_off)
COMPATIBLE INSTRUMENTS
Works best on liquid instruments with reliable volume data:
✅ Futures: NQ, MNQ, ES, MES, YM, MYM, RTY, M2K, CL, GC
✅ Forex: Major pairs (EUR/USD, GBP/USD, etc.)
✅ Stocks: Large-cap stocks with high volume
⚠️ Crypto: Works but requires higher ATR multipliers
❌ Low Volume Stocks: May produce unreliable signals
SUPPORT
For questions, suggestions, or to report issues, please comment below. I actively maintain this indicator and appreciate feedback from the community.
Enjoy trading with Pulsar! 🌟

Information-Geometric Market Dynamics + MLInformation-Geometric Market Dynamics + ML (IGMD-ML)
Foreword: Beyond the Shadows on the Wall
If you have traded for any length of time, you understand the frustration of a perfect setup that fails, the whipsaw that stops you out just before a major move, or the persistent feeling that the price chart is only telling you half the story. For decades, technical analysis has focused on interpreting the shadows—the patterns left behind by price. We draw lines, apply indicators, and hope to derive future movement from this historical data.
But what if we could stop analyzing the shadows and instead measure the object casting them?
This script, Information-Geometric Market Dynamics (IGMD), introduces a new paradigm for market analysis. Its core premise is that the price chart is merely a one-dimensional projection of a much richer, higher-dimensional reality—an "information field" generated by the collective actions, beliefs, and emotions of all market participants.
This is not just another collection of indicators. It is a unified framework for measuring the geometry of this information field—its memory, its complexity, its uncertainty, its causal flows—and making high-probability decisions based on that deeper reality.
The IGMD Framework: A Multi-Kernel Approach
At the heart of IGMD are mathematical "kernels"—specialized engines that transform raw price data into meaningful measurements of abstract market properties. The framework's power lies in its ability to fuse the outputs of five distinct kernels, synthesizing their diverse perspectives into a single, coherent picture of the market's state.
The Five Core Kernels of Market Dynamics:
1. The Wavelet Kernel (The "Microscope"): Decomposes price into different frequency scales, separating short-term noise from the underlying market "thesis."
2. The Hurst Exponent Kernel (The "Memory Gauge"): Measures the market's "long-term memory" to determine if it is in a trending, mean-reverting, or random state.
3. The Fractal Dimension Kernel (The "Complexity Compass"): Quantifies the geometric complexity of the price path, acting as a primary filter for tradable vs. untradable conditions.
4. The Shannon Entropy Kernel (The "Uncertainty Meter"): Provides a pure measure of information and uncertainty, gauging market conviction and predictability.
5. The Transfer Entropy Kernel (The "Causality Probe"): Moves beyond correlation to measure the directed flow of information, assessing if a driver (like volume) is genuinely leading price.
Major Update: The Intelligence Layer & Machine Learning Integration
This version of IGMD introduces a significant advancement: an integrated machine learning (ML) engine that acts as an intelligent decision-making layer on top of the core five-kernel analysis. This is not a "black box" system but a transparent, adaptive filter designed to improve signal quality by learning from the market in real time.
How the ML Engine Works
The ML model processes the outputs from all five IGMD kernels and other market variables (like RSI and Volume) to build a comprehensive, multi-dimensional understanding of the current market state.
Core Technology: The engine uses an online logistic regression model. "Online" means it learns and updates its parameters with every new bar of data, allowing it to adapt continuously to changing market dynamics without needing to be retrained.
Non-Linear Pattern Recognition: To capture the market's complex behavior, the model projects the kernel data into a higher-dimensional space using Random Fourier Features (RFF) . This technique allows a linear model to recognize highly intricate patterns that would otherwise be invisible.
Probabilistic Filtering: The ML engine’s primary function is to act as a final confirmation filter. For every signal generated by the core IGMD system, the ML model calculates a probability score—its confidence that the price will move in the predicted direction. Signals are only displayed if they pass this confidence check.
Key Features of the ML Engine
Automated Regime Filter: The ML engine uses the Fractal Dimension and Shannon Entropy kernels to identify choppy, unpredictable markets. During these periods, the system automatically pauses new signal generation to help preserve capital.
Adaptive Confidence Threshold: To optimize performance, the ML engine features an optional self-adjusting confidence threshold. This system tracks its own rolling accuracy and adjusts its selectivity accordingly, becoming more cautious in uncertain periods and more opportunistic when its accuracy is high.
Feature Importance Monitoring: The dashboard displays which of the core IGMD features (e.g., Wave, Hurst, Entropy) the ML model is currently relying on most. This provides valuable insight into the market's character and what is driving the model's decisions.
Advanced Adaptation: The Reinforcement Learning Bandit (Experimental)
For advanced users, this version includes an experimental feature based on a Multi-Armed Bandit , a concept from reinforcement learning. When enabled, this system can automatically switch between different parameter presets (e.g., Conservative, Balanced, Aggressive) based on the current market regime. It learns over time which preset performs best under specific conditions by balancing the exploitation of known successful strategies with the exploration of others.
Fusion & Interpretation: The Field Score & Enhanced Dashboard
The Field Score: The outputs of the five kernels are fused into a single, comprehensive "Field Score" ranging from -1 (maximum bearish alignment) to +1 (maximum bullish alignment). This remains the ultimate at-a-glance metric for the market's net state.
The Enhanced Dashboard: Your mission control has been upgraded to include the ML engine's analysis. Alongside the core kernel readouts, you can now monitor:
ML Status: See if the model is active, warming up, or disabled.
ML Probability: View the model's real-time confidence for a bullish move.
Regime Status: Instantly know if the market is "Trending," "Normal," or "Choppy (Paused)."
Top Feature: Identify the most influential IGMD kernel according to the ML model.
Signal Status: See the final, ML-vetted signal.
Mastering the Controls: A Guide to the Inputs
The inputs menu gives you full control over the IGMD and ML engines.
🤖 Machine Learning Engine:
Enable ML Probability Model: The master switch for the entire ML layer.
Prediction Horizon: Set how many bars ahead you want the ML model to predict. This should align with your trading style.
ML Confidence Threshold: The minimum probability required for the ML model to approve a signal. This is your primary tool for adjusting signal quality versus frequency.
Pause in Choppy Regimes: Enable or disable the automated filter that stops trading in unfavorable conditions.
Auto-Adjust Threshold: Allow the system to self-optimize its confidence threshold based on recent accuracy.
🎰 Adaptive Parameter Bandit:
Enable Parameter Bandit: Activate the experimental reinforcement learning agent to manage strategy presets automatically.
Reading the Battlefield: On-Chart Visuals
In addition to the established pattern boxes, RR rails, and signal markers, a new visual element has been added:
ML Rejection Markers (✗): An orange '✗' will appear on the chart when the core IGMD system identifies a potential setup, but the ML model's confidence is below your defined threshold. This provides crucial feedback, showing you which signals were intelligently filtered out by the intelligence layer for having a lower probability of success.
A Methodological Distinction: What Sets IGMD Apart **
What sets this framework apart is its foundational approach. Instead of relying on traditional technical indicators, IGMD is architected as a multi-disciplinary engine that fuses concepts from signal processing, chaos theory, and information theory. It moves beyond analyzing simple price action to measure the market's underlying "information field"—quantifying its memory, complexity, and causal flows into a single, unified score. The integrated machine learning layer builds on this foundation, creating a transparent, adaptive filter that learns from market conditions in real-time. This combination of a fused, multi-dimensional analysis with a live, probabilistic intelligence layer offers a more dynamic and nuanced perspective than static, single-purpose indicators.
Development Philosophy & A Final Word
This script was designed to answer a single question: "What is the market *really* doing?" The addition of a transparent, adaptive machine learning layer is the next logical step in this pursuit—using computational intelligence to navigate the vast amount of information the core kernels provide.
This tool is offered for educational and analytical purposes and does not constitute financial advice. Its goal is to elevate market analysis from interpreting flat shadows to measuring the rich, geometric reality of the market's information field.
As the great mathematician Benoit Mandelbrot, father of fractal geometry, noted:
"Clouds are not spheres, mountains are not cones, coastlines are not circles, and bark is not smooth, nor does lightning travel in a straight line."
Neither does the market. IGMD is a tool designed to help navigate that beautiful, complex, and fractal reality.
— Dskyz, Trade with insight. Trade with anticipation.
