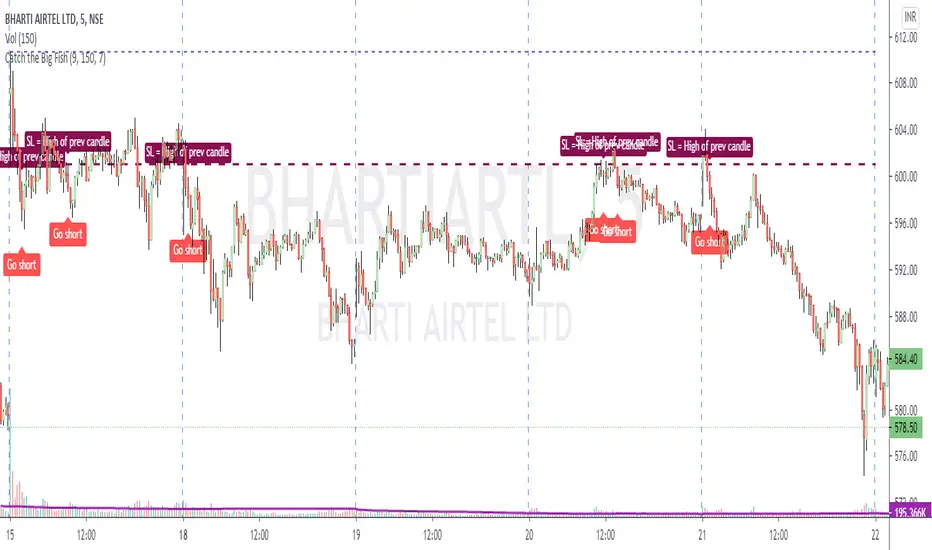
Catch the Big FishVolume based script to catch a big move. Works best on 5 min timeframe.
The default sma duration for volume is set to 150 = number of candles in 5 mins timeframe for 2 days.
Heavy volume is defined as = more than 9 times of sma.
Both parameters are configurable.
Trading strategy: Long buy at high / Short sell at low of the candle where the script gives the signal.
Important note regarding SL - for Long / Short positions respectively, the SL should be placed at low / high of previous candle, and NOT of the same candle.
Trendreversal
Trend Oscillator (Expo)Trend Oscillator (Expo) measures the overall trend strength and how strong the current price move/momentum is. The indicator is leading since it can signal a possible trend change that is yet to start. The color of the histogram and its value helps to gauge the strength and momentum of the trend.
The user can enable Bar Color that coloring the candlesticks based on the trend strength.
The user can choose between different trend calculations, such as smoothed trend, volume-weighted trend, a non-lagging trend, to mentions a few.
DIVERGENCES
All types of oscillators produce divergences and so does Trend Oscillator (Expo). Divergences occur when the oscillator deviates from the trending price action. Bullish divergence is then when the trending price makes a lower low but the oscillator makes a higher low. Bearish divergence is then when the trending price makes a higher high but the oscillator makes a lower high.
HOW TO USE
Identify the trend strength and direction
Identify current momentum
Identify potential trend reversals
Identify Overbought and Oversold areas
INDICATOR IN ACTION
1 min chart
I hope you find this indicator useful , and please comment or contact me if you like the script or have any questions/suggestions for future improvements. Thanks!
I will continually work on this indicator, so please share your experience and feedback as it will enable me to make even better improvements. Thanks to everyone that has already contacted me regarding my scripts. Your feedback is valuable for future developments!
-----------------
Disclaimer
Copyright by Zeiierman.
The information contained in my scripts/indicators/ideas does not constitute financial advice or a solicitation to buy or sell any securities of any type. I will not accept liability for any loss or damage, including without limitation any loss of profit, which may arise directly or indirectly from the use of or reliance on such information.
All investments involve risk, and the past performance of a security, industry, sector, market, financial product, trading strategy, or individual’s trading does not guarantee future results or returns. Investors are fully responsible for any investment decisions they make. Such decisions should be based solely on an evaluation of their financial circumstances, investment objectives, risk tolerance, and liquidity needs.
My scripts/indicators/strategies/ideas are only for educational purposes!
ACCESS THE INDICATOR
• Contact me on TradingView or use the links below

RSI Tops and BottomsHello Traders
This script finds Tops when RSI is in overbought area or Bottoms when RSI is in oversold area and checks the divergence between them. it checks divergence at tops/bottoms after RSI exited from OB/OS areas.
You can change overbought / oversold levels.
You can limit the time that RSI is in OB/OS area with the option "Max Number of Bars in OB/OS"
you can set the minimum/maximum distances between Tops/Bottoms with the options "Min Number of Bars between Tops/Bottoms" and "Max Number of Bars between Topss/Bottoms"
and you can set the color and line widths as you wish.
These tops or bottom must be sequential, means there mustn't be another top while checking tops or bottom while checking bottoms between them.
in next example you can see valid and invalid bottoms:
After you got signal then you better use Stop Order, a few pips higher than the high of colored candle for long positions, ( vise versa in short positions ). so you may escape from traps. ("Stop order" is filled when the price reached a pre-specified price. for example the price is now 10.0 and you set Buy Stop Order at 11.0 then if price reaches 11.0 then your buy order get filled. you can put stoploss a few pips lower than the low of colored candle or you can use ATR to decice stoploss level. how you wish)
For example in following screenshot you can see that buy stop order was not filled and you didn't take long position.
Enjoy!

TradeChartist Risk Meter™𝗧𝗿𝗮𝗱𝗲𝗖𝗵𝗮𝗿𝘁𝗶𝘀𝘁 𝗥𝗶𝘀𝗸 𝗠𝗲𝘁𝗲𝗿 is a very useful and a well designed indicator, that packs a range of Risk utility tools including Trend Based Stochastic Oscillator, Bollinger Bands %B , Volatility Risk Oscillator, RSI Oscillator and RSI Risk Oscillator, along with further visual risk assessment tools like Divergence Spotter, Trend based Strength detector among other useful extras.
===================================================================================================================
™𝗧𝗿𝗮𝗱𝗲𝗖𝗵𝗮𝗿𝘁𝗶𝘀𝘁 𝗥𝗶𝘀𝗸 𝗠𝗲𝘁𝗲𝗿 𝗨𝘀𝗲𝗿 𝗠𝗮𝗻𝘂𝗮𝗹
The user can choose from one of the following four option from the 𝗥𝗶𝘀𝗸 𝗠𝗲𝘁𝗲𝗿 𝗧𝘆𝗽𝗲 dropdown from the settings.
1. Trend Based Stochastic
2. Bollinger Bands %B
3. Volatility Risk Oscillator
4. RSI + RSI Risk Oscillator
The source price for the Risk Meter can be chosen from Sᴏᴜʀᴄᴇ dropdown. Both Trend Based Stochastic and Volatility Risk Oscillator use High/Low prices as default. Enable Usᴇ Sᴏᴜʀᴄᴇ Pʀɪᴄᴇ under respective section to use a different source price.
Users can choose to plot Risk Meter background fill by enabling or disabling Rɪsᴋ Mᴇᴛᴇʀ Bᴀᴄᴋɢʀᴏᴜɴᴅ . The background fill is based on the trend intensity and uses 2 different colour schemes based on user preference. When the Dᴇᴄɪᴅᴇʀ Tʜʀᴇsʜᴏʟᴅ is used, it uses the background fill to mask the zone. If background fill is disabled, orange colour is used to mask the zone.
All of the Risk Meter plots can be plotted as Line , Histogram or Area plots and each of the sections include the Pʟᴏᴛ Sᴛʏʟᴇ option, so the user can choose a specific type of plot style for each of the Risk Meter Oscillators, based on user preference.
===================================================================================================================
═══ 𝟭. 𝗧𝗿𝗲𝗻𝗱 𝗕𝗮𝘀𝗲𝗱 𝗦𝘁𝗼𝗰𝗵𝗮𝘀𝘁𝗶𝗰 ═══
Trend Based Stochastic Oscillator is a modified version of the classic Stochastic Oscillator with the difference being the limits and also the plot itself to an extent.
--> Trend based Stochastic is a single plot oscillates between -100 to +100 and occasionally breaches these limits and can signal extremely overbought or oversold conditions unlike classic Stochastic indicator, which has two plots and strictly oscillates between 0-100.
--> Trend based Stochastic is extremely sensitive to price action, making it possible to detect every single divergence, both regular and hidden, even with the default smoothing factor of 5
--> Risk Meter employs Dᴇᴄɪᴅᴇʀ Tʜʀᴇsʜᴏʟᴅ to let user choose the threshold limit and only from this point onwards, Risk Meter detects the divergences. This helps filter a lot of noise in addition to Price and Oscillator Pivot detection under 𝗗𝗶𝘃𝗲𝗿𝗴𝗲𝗻𝗰𝗲𝘀 section.
The user has to choose the length for the Trend based Stochastic plot by entering number of bars in Lᴏᴏᴋʙᴀᴄᴋ Lᴇɴɢᴛʜ input box (Default value is 55). The user can also change the smoothing factor from default value of 5 by entering the value in Sᴍᴏᴏᴛʜɪɴɢ input box. Smoothing is particularly useful to detect the strength, based on the trend if 𝐂𝐨𝐥𝐨𝐫 𝐙𝐨𝐧𝐞𝐬 𝐛𝐚𝐬𝐞𝐝 𝐨𝐧 𝐒𝐭𝐫𝐞𝐧𝐠𝐭𝐡 is enabled and the required trend length is entered in Tʀᴇɴᴅ Sᴛʀᴇɴɢᴛʜ Dᴇᴛᴇᴄᴛɪᴏɴ Lᴇɴɢᴛʜ . This feature splits the Risk Meter Plot into Bull and Bear zones based on the trend strength. HIgher Smoothing with default trend strength detection of 5 (upto 10) works well for sensitive price hugging scalps/swings. For longer trends, higher detection lengths can be used.
===================================================================================================================
════ 𝟮. 𝗕𝗼𝗹𝗹𝗶𝗻𝗴𝗲𝗿 𝗕𝗮𝗻𝗱𝘀 %𝗕 ═════
Bollinger Bands %B in Risk Meter oscillates between -100 to +100 rather than 0 - 1 in the classic version, with oversold/overbought levels breaching the limits and the plot is exactly the same otherwise.
Risk Meter employs Dᴇᴄɪᴅᴇʀ Tʜʀᴇsʜᴏʟᴅ for Bollinger Bands %B to let the user choose the threshold limit and only from this point onwards, Risk Meter detects the divergences. This helps filter a lot of noise in addition to Price and Oscillator Pivot detection under 𝗗𝗶𝘃𝗲𝗿𝗴𝗲𝗻𝗰𝗲𝘀 section.
The user has to choose the Simple Moving Average (SMA) length for the plot by entering number of bars in BB SMA Lᴇɴɢᴛʜ input box (Default value is 20). There is no need for Standard Deviation as the fundamental plot is exactly the same, given that the plot oscillates between -100 to +100. The user can also change the smoothing factor from default value of 5 by entering the value in Sᴍᴏᴏᴛʜɪɴɢ input box. Smoothing is particularly useful to detect the strength, based on the trend if 𝐂𝐨𝐥𝐨𝐫 𝐙𝐨𝐧𝐞𝐬 𝐛𝐚𝐬𝐞𝐝 𝐨𝐧 𝐒𝐭𝐫𝐞𝐧𝐠𝐭𝐡 is enabled and the required trend length is entered in Tʀᴇɴᴅ Sᴛʀᴇɴɢᴛʜ Dᴇᴛᴇᴄᴛɪᴏɴ Lᴇɴɢᴛʜ . This feature splits the Risk Meter Plot into Bull and Bear zones based on the trend strength. HIgher Smoothing with default trend strength detection of 5 (upto 10) works well for sensitive price hugging scalps/swings. For longer trends, higher detection lengths can be used.
===================================================================================================================
══════ 𝟯. 𝗩𝗼𝗹𝗮𝘁𝗶𝗹𝗶𝘁𝘆 𝗥𝗶𝘀𝗸 ═══════
Volatility Risk Oscillator is an original ™TradeChartist model designed to visually see the Volatility risk for the security on any time frame.
To plot Volatility Risk for the security, the user has to enter the number of bars to detect volatility risk in Lᴏᴏᴋʙᴀᴄᴋ Lᴇɴɢᴛʜ input box (Default Value is 55). The user can also change the smoothing factor from default value of 5 by entering the value in Sᴍᴏᴏᴛʜɪɴɢ input box. Smoothing is particularly useful to detect the strength based on trend if 𝐂𝐨𝐥𝐨𝐫 𝐙𝐨𝐧𝐞𝐬 𝐛𝐚𝐬𝐞𝐝 𝐨𝐧 𝐒𝐭𝐫𝐞𝐧𝐠𝐭𝐡 is enabled and required trend length is entered in Tʀᴇɴᴅ Sᴛʀᴇɴɢᴛʜ Dᴇᴛᴇᴄᴛɪᴏɴ Lᴇɴɢᴛʜ . This feature splits the Risk Meter Plot into Bull and Bear zones based on the trend strength. HIgher Smoothing with default trend strength detection of 5 (upto 10) works well for sensitive price hugging scalps/swings. For longer trends, higher detection lengths can be used.
Even though Divergences work on Volatility Risk Oscillator, it is not employed as it produces far too many and there is no set Threshold limit that can be set to filter the divergences.
===================================================================================================================
══════ 𝟰. 𝗥𝗦𝗜 𝗢𝘀𝗰𝗶𝗹𝗹𝗮𝘁𝗼𝗿 ═══════
There are two different types of RSI Oscillators in this section that can be plotted.
RSI Oscillator - Classic RSI modified to fit -100 to +100 scale rather than 0 - 100 scale. Risk Meter employs Dᴇᴄɪᴅᴇʀ Tʜʀᴇsʜᴏʟᴅ for RSI Oscillator also, to let the user choose the threshold limit and only from this point onwards, Risk Meter detects the divergences. This helps filter a lot of noise in addition to Price and Oscillator Pivot detection under 𝗗𝗶𝘃𝗲𝗿𝗴𝗲𝗻𝗰𝗲𝘀 section.
RSI Risk Oscillator - This oscillator plots the potential RSI risk based on RSI length (which can be changed in RSI Lᴇɴɢᴛʜ input box and main source price ( Sᴏᴜʀᴄᴇ ). The user can also change the smoothing factor from default value of 5 by entering the value in Sᴍᴏᴏᴛʜɪɴɢ input box. Smoothing is particularly useful to detect the strength, based on the trend if 𝐂𝐨𝐥𝐨𝐫 𝐙𝐨𝐧𝐞𝐬 𝐛𝐚𝐬𝐞𝐝 𝐨𝐧 𝐒𝐭𝐫𝐞𝐧𝐠𝐭𝐡 is enabled and the required trend length is entered in Tʀᴇɴᴅ Sᴛʀᴇɴɢᴛʜ Dᴇᴛᴇᴄᴛɪᴏɴ Lᴇɴɢᴛʜ . This feature splits the Risk Meter Plot into Bull and Bear zones based on the trend strength. Higher Smoothing with default trend strength detection of 5 (upto 10) works well for sensitive price hugging scalps/swings. For longer trends, higher detection lengths can be used.
To plot RSI Risk Oscillator, 𝐒𝐡𝐨𝐰 𝐑𝐒𝐈 𝐑𝐢𝐬𝐤 𝐎𝐬𝐜𝐢𝐥𝐥𝐚𝐭𝐨𝐫 must be enabled. Disabling this option plots normal RSI Oscillator.
The 4hr chart of BTC-USDT below shows use of RSI Risk Oscillator (Top) with RSI Oscillator (bottom).
===================================================================================================================
╔═══════ 𝗗𝗶𝘃𝗲𝗿𝗴𝗲𝗻𝗰𝗲𝘀 ═══════╗
Risk Meter detects both Regular and Hidden Bullish and Bearish Divergences at every occurence. This can be filtered by the use of Dᴇᴄɪᴅᴇʀ Tʜʀᴇsʜᴏʟᴅ in above sections. To plot divergences, enable
𝗗𝗶𝘃𝗲𝗿𝗴𝗲𝗻𝗰𝗲𝘀, Sʜᴏᴡ Rᴇɢᴜʟᴀʀ Dɪᴠᴇʀɢᴇɴᴄᴇs and Sʜᴏᴡ Hɪᴅᴅᴇɴ Dɪᴠᴇʀɢᴇɴᴄᴇs . All divergences are enabled as default.
Users can further filter Divergences by entering the number of bars to the right in Rɪɢʜᴛ ʙᴀʀs ғᴏʀ Pɪᴠᴏᴛ Cᴏɴғɪʀᴍᴀᴛɪᴏɴ input box to confirm the Price Pivot (for Regular divergences) and Oscillator Pivot (for Hidden Divergences).
The example chart of 4hr BTC-USDT chart shows the Divergences filtered by use of RSI Threshold. It is important to note that the trend intensity colour on the plot and bars (if bar colour option is enabled) will help detect if the Divergence would hold.
===================================================================================================================
╔═══════ 𝗨𝘀𝗲𝗳𝘂𝗹 𝗘𝘅𝘁𝗿𝗮𝘀 ═══════╗
Risk Meter offer two vibrant Colour Themes, namely Chilli and Flame , which can be opted from Rɪsᴋ Mᴇᴛᴇʀ Tʜᴇᴍᴇ dropdown. These themes also offer the option to plot the trend intensity on the price bars as bar colours by enabling Rɪsᴋ Mᴇᴛᴇʀ Cᴏʟᴏᴜʀ Bᴀʀs . Bar colors can also be inverted using Iɴᴠᴇʀᴛ Bᴀʀ Cᴏʟᴏᴜʀ option.
Users can also choose to use the Simple theme and choose preferred colours from Sɪᴍᴘʟᴇ Tʜᴇᴍᴇ ʙᴜʟʟ Cᴏʟᴏᴜʀ and Sɪᴍᴘʟᴇ Tʜᴇᴍᴇ ʙᴇᴀʀ Cᴏʟᴏᴜʀ colour input.
Note: The indicator does not repaint and can be confidently used for alerts and trade entries without worrying about plots disappearing after bar close.
===================================================================================================================
Example Charts
1. 89 period Trend Based Stochastic Oscillator as Histogram plot on LINK-USDT 1hr chart with Chilli Theme.
2. 89 period Volatility Risk Oscillator as Histogram plot on SPX 1hr chart with Chilli Theme.
3. 14 period RSI Risk Oscillator as Area plot on AAPL Daily Chart with Flame Theme.
4. 100 period Volatility Risk Oscillator using Trend Strength plotted as Zones on 1hr EUR-USD chart with Chilli Theme.
===================================================================================================================
Best Practice: Test with different settings first using Paper Trades before trading with real money
===================================================================================================================
This is not a free to use indicator. Get in touch with me (PM me directly if you would like trial access to test the indicator)
Premium Scripts - Trial access and Information
Trial access offered on all Premium scripts.
PM me directly to request trial access to the scripts or for more information.
===================================================================================================================

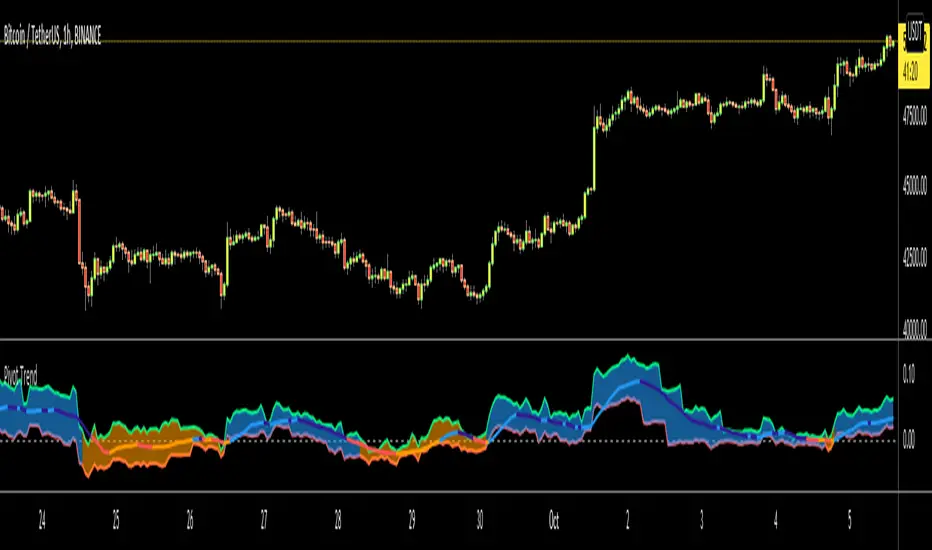
Trend Algo (Zeiierman)█ Overview
Trend Algo (Zeiierman) converts raw price movement into a cohesive, volatility-aware trend map. Rather than static moving averages, it builds an adaptive trend core that responds to market state changes, then layers regime-sensitive clouds (Infinite Sky) and horizon-bounded channels (HorizonX), plus precise trend-change and continuation signals. The result is a clean framework for reading direction, timing pullbacks, and validating momentum.
The indicator visualizes the active trend line, adaptive clouds, and stateful signals to reveal transition zones, trend acceleration, and exhaustion. It suits intraday execution, swing confirmations, and structural regime assessment.
⚪ Why This One Is Unique
Unlike conventional trend tools, this version combines volatility-normalized trend estimation, AI-style regime clustering, and horizon-bounded support/resistance channels. Its framework uses multi-phase smoothing, adaptive width scaling, and state detection that aligns entries and continuations with current market inertia—reducing whipsaw while preserving responsiveness.
█ Main features
⚪ Dynamic Clouds
The Dynamic Trend Line provides a stabilized, noise-aware trajectory of price, color-coded by directional bias. Two cloud systems overlay the core trend:
Infinite Sky (AI) — a regime-aware cloud that distinguishes fast vs. slow trend states.
HorizonX — adaptive channels that operate as dynamic support/resistance and define trend boundaries.
⚪ Candle Coloring
The candle coloring is designed to highlight trend momentum peaks, allowing you to instantly recognize when the trend is accelerating or slowing down. This visual feedback makes it easier to interpret the strength and speed of directional moves directly on the chart, seamlessly complementing the Dynamic Trend Line and Cloud systems.
⚪ Trend Change Signals & Trend Continuation Signals
The main signals are the Trend Change Signals , designed to trigger when the current trend structure begins to shift its state. These signals give you an instant sense of when a potential trend reversal or directional change might occur.
To complement them, we’ve added Trend Continuation Signals , which only activate within an established trend. These signals confirm the current direction and indicate that the trend is gaining strength and preparing for another move in the same direction.
⚪ Trend Line
Two types of trend lines are integrated: Stability and Dynamic.
The Stability Line follows the current price action in a smooth, drift-like manner — staying closer to price to act as a faster support and resistance zone.
The Dynamic Line adapts to volatility, ensuring that continuous movements within the trend are taken into account. This helps traders stay aligned with the trend and capture extended moves during periods of higher market activity.
█ How to Use
⚪ Trend Changes
Trend Change Signals appear when the current trend structure begins to shift, signaling a potential reversal or directional transition. These signals help traders anticipate moments when momentum weakens or changes direction, offering early insight into possible turning points in the market. Combine Trend Change Signals with Candle Coloring or Cloud behavior to confirm entries and strengthen trend reversal validation.
⚪ Trend Continuations
Trend Continuation Signals trigger within an established trend, confirming that the current direction remains strong. They often appear after pullbacks or pauses, suggesting that the market is ready for another move in the same direction. These signals work best when paired with the Dynamic Trend Line, allowing traders to stay confidently aligned with powerful ongoing trends.
⚪ Support and Resistance
The Stability Trend Line acts as a reactive support and resistance guide, staying close to price and highlighting areas where market reactions are most likely to occur. It offers traders a clear view of short-term structure and helps identify potential bounce or rejection zones with precision.
The Dynamic Trend Line adapts to volatility, forming flexible support and resistance zones that expand during strong momentum and contract during quieter phases, keeping the visual structure balanced and responsive to changing market conditions.
HorizonX defines the outer adaptive boundaries of the trend. These dynamic channels operate as broader support and resistance frameworks, helping traders anticipate trend exhaustion or continuation zones beyond the immediate price action.
The Infinite Sky (AI) cloud adds a regime-aware layer that distinguishes fast and slow trend states, visually framing the strength of support or resistance regions as they evolve and allowing traders to read both momentum and structure in a single glance.
█ How It Works
⚪ Dynamic Trend Core
A volatility-normalized estimator generates the primary trajectory and color state, balancing stability vs. agility by adapting to dispersion and displacement.
Calculation: Multi-phase weighted smoothing with volatility-scaled adjustments and adaptive phase control to minimize lag while preserving curvature.
⚪ Infinite Sky (AI Regime Cloud)
Differentiates fast vs. slow trend states and paints a regime-aware cloud that guides timing and risk.
Calculation: Windowed return modeling (with optional consolidation), two-pole response filtering, and distribution-center clustering to classify regimes and modulate the envelope.
⚪ HorizonX Trend Channels
Defines dynamic support/resistance “horizons” that expand/contract with conditions and filter counter-trend noise when strong-trend mode is enabled.
Calculation: A volatility-aware core that evolves with changing price dynamics, maintaining precision across all market conditions.
⚪ Trend Line & Continuations
A fast reaction line confirms pullbacks and validates continuation only when aligned with prevailing bias and structure.
Calculation: Short-horizon smoothing with phase-managed weighting, slope/position gating, and context checks against regime and horizon levels.
⚪ Impulse Detection
Identifies statistically meaningful bursts that precede expansion or warn of exhaustion after extended runs.
Calculation: Nonlinear impulse-response mapping emphasizing second-order changes in directional energy while suppressing micro-noise.
⚪ Trend Bands
Upper/lower bands visualize the active envelope for timing adds, trims, or exits within trend.
Calculation: Percentile-guided banding blended with adaptive anchors to retain structural relevance through regime shifts.
⚪ Bar Color Integration
Bars can inherit trend/gradient context to make state shifts obvious at a glance.
Calculation: Algorithmic gradient model integrating directional momentum intensity to render bar coloration in sync with market flow.
-----------------
Disclaimer
The content provided in my scripts, indicators, ideas, algorithms, and systems is for educational and informational purposes only. It does not constitute financial advice, investment recommendations, or a solicitation to buy or sell any financial instruments. I will not accept liability for any loss or damage, including without limitation any loss of profit, which may arise directly or indirectly from the use of or reliance on such information.
All investments involve risk, and the past performance of a security, industry, sector, market, financial product, trading strategy, backtest, or individual's trading does not guarantee future results or returns. Investors are fully responsible for any investment decisions they make. Such decisions should be based solely on an evaluation of their financial circumstances, investment objectives, risk tolerance, and liquidity needs.
유료 스크립트

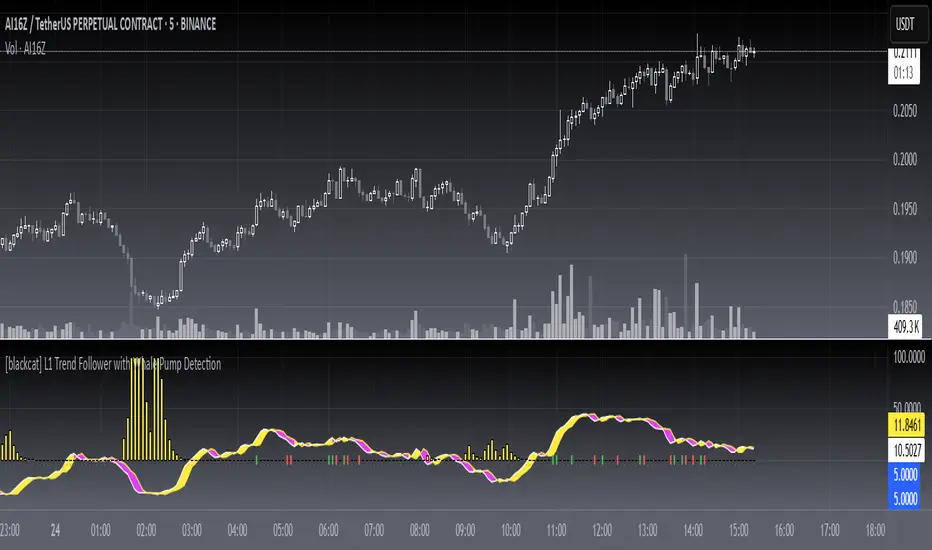
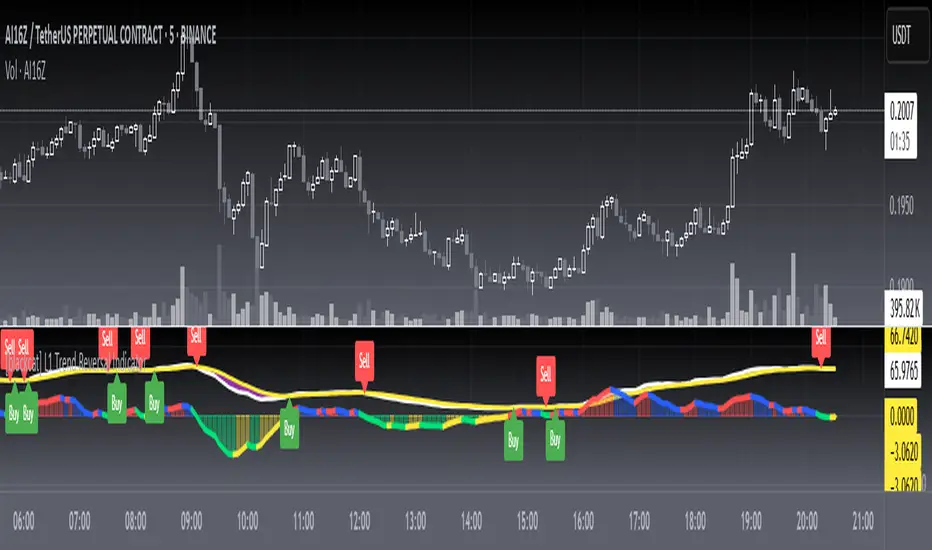
[blackcat] L1 Trend Follower with Whale Pump DetectionLevel: 1
Background
One of the biggest differences between cryptocurrency and traditional financial markets is that cryptocurrency is based on blockchain technology. Individual investors can discover the direction of the flow of large funds through on-chain transfers. These large funds are often referred to as Whale. Whale can have a significant impact on the price movements of cryptocurrencies, especially Bitcoin . Therefore, how to monitor Whale trends is of great significance both in terms of fundamentals and technical aspects.
A trend reversal occurs when the direction of a stock (or a financial trading instrument) changes and moves back in the opposite direction. Uptrends that reverse into downtrends and downtrends that reverse into uptrends are examples of trend reversals.
Function
L1 Trend Follower with Whale Pump Detection utilizes fast line and slow line to describe the trend change. To confirm the trend reversal, whale pump detector is introduced.
Key Signal
trendfollower --> trend follower fast line
trendfollower reference 2 --> trend follower slow line
var8 --> whale pump detector
Pros and Cons
Pros:
1. stable and less noise for trend reversal due to alma()
2. use whale pump detector to confirm trend reversal
Cons:
1. cross zero long and short entry signal is not so stable
2. need adjust parameters for various markets and trading pairs
Remarks
NA
Readme
In real life, I am a prolific inventor. I have successfully applied for more than 60 international and regional patents in the past 12 years. But in the past two years or so, I have tried to transfer my creativity to the development of trading strategies. Tradingview is the ideal platform for me. I am selecting and contributing some of the hundreds of scripts to publish in Tradingview community. Welcome everyone to interact with me to discuss these interesting pine scripts.
The scripts posted are categorized into 5 levels according to my efforts or manhours put into these works.
Level 1 : interesting script snippets or distinctive improvement from classic indicators or strategy. Level 1 scripts can usually appear in more complex indicators as a function module or element.
Level 2 : composite indicator/strategy. By selecting or combining several independent or dependent functions or sub indicators in proper way, the composite script exhibits a resonance phenomenon which can filter out noise or fake trading signal to enhance trading confidence level.
Level 3 : comprehensive indicator/strategy. They are simple trading systems based on my strategies. They are commonly containing several or all of entry signal, close signal, stop loss, take profit, re-entry, risk management, and position sizing techniques. Even some interesting fundamental and mass psychological aspects are incorporated.
Level 4 : script snippets or functions that do not disclose source code. Interesting element that can reveal market laws and work as raw material for indicators and strategies. If you find Level 1~2 scripts are helpful, Level 4 is a private version that took me far more efforts to develop.
Level 5 : indicator/strategy that do not disclose source code. private version of Level 3 script with my accumulated script processing skills or a large number of custom functions. I had a private function library built in past two years. Level 5 scripts use many of them to achieve private trading strategy.
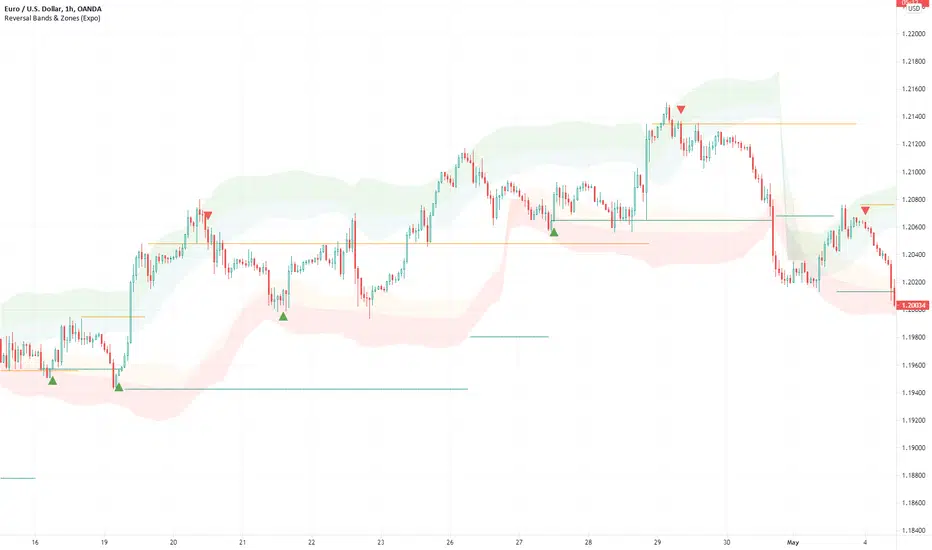
Reversal Bands & Zones (Expo) "It has never been easier to find high probability trades"
Reversal Bands & Zones (Expo) is an algorithm that analyzes the market in real-time and identifies reversal points, key market zones, and trends. The advanced and unique reversal bands act as support & resistance zones, and together with the trend tracking feature, it serves as a trend confirmation. The real-time market zones are displayed where there is a high probability of finding support/resistance. The algorithm does also map out key pivot levels based on the current market structure.
> Reversal points and key market zones have alerts.
Real-time
No repainting
Works on any market and in any timeframe
The indicator can be used standalone or as a part of your current trading strategy.
☖ Reversals
The algorithm identifies areas of potential turning points, these are displayed as Upper and Lower Reversal Cloud. When the price hits the cloud and bounces off there is a high probability that the price will reverse. If the price stays in the reversal cloud, there is a high probability that a trend is forming.
☖ Trends
Positive Trend: If the price is in or close to the upper green reversal band and above the trend- tracking line, we can be sure that the market is in a positive trend until the price crosses down from the reversal cloud and the trend tracking line.
NegativeTrend: If the price is in or close to the lower red reversal band and below the trend- tracking line, we can be sure that the market is in a negative trend until the price crosses up from the reversal cloud and the trend tracking line.
☖ Zones
"It hasn't been easier to display, in real-time, one of the most important and useful technical analysis, namely key support and resistance zones"
The algorithm analyzes the market structure in real-time and maps out key supply/resistance and demand/support zones. The user gets an instant understanding of the market structure. Support and resistance can be used to determine the range of a market, to trade reversals, bounces, or breakouts.
☖ Pivots
The indicator does also displays key pivot levels. Pivots can be used to determine the range of a market, to trade reversals, bounces, or breakouts.
HOW TO USE
- Use the indicator to identify reversals.
- Use the indicator to identify the range of the market.
- Use the indicator to identify key support/resistance zones.
- Use the indicator to identify trends.
INDICATOR IN ACTION
1-hour chart
I hope you find this indicator useful , and please comment or contact me if you like the script or have any questions/suggestions for future improvements. Thanks!
I will continually work on this indicator, so please share your experience and feedback as it will enable me to make even better improvements. Thanks to everyone that has already contacted me regarding my scripts. Your feedback is valuable for future developments!
-----------------
Disclaimer
Copyright by Zeiierman.
The information contained in my scripts/indicators/ideas does not constitute financial advice or a solicitation to buy or sell any securities of any type. I will not accept liability for any loss or damage, including without limitation any loss of profit, which may arise directly or indirectly from the use of or reliance on such information.
All investments involve risk, and the past performance of a security, industry, sector, market, financial product, trading strategy, or individual’s trading does not guarantee future results or returns. Investors are fully responsible for any investment decisions they make. Such decisions should be based solely on an evaluation of their financial circumstances, investment objectives, risk tolerance, and liquidity needs.
My scripts/indicators/ideas are only for educational purposes!
ACCESS THE INDICATOR
• Contact me on TradingView or use the links below
L1 Trend Reversal IndicatorLevel: 1
Background
A trend reversal occurs when the direction of a stock (or a financial trading instrument) changes and moves back in the opposite direction. Uptrends that reverse into downtrends and downtrends that reverse into uptrends are examples of trend reversals.
Function
L1 Trend Reversal Indicator is simple but powerful. It can be used as a basic element for many complex trading system. Although L1 Trend Reversal Indicator can't hold a candle to moving averages in indicating trend reversals, it's good at showing the strength of a trend and trend cycles.
Key Signal
My favoriate trend reversal indicator with histograms
Pros and Cons
Pros:
1. Simple but clear to see the trend reversals
2. Use histogram to indicate sub-time-frame trend changes
Cons:
1. No advanced trading skill is incorporated
2. Need improvements on sideways.
Remarks
Just be simple but powerful
Readme
In real life, I am a prolific inventor. I have successfully applied for more than 60 international and regional patents in the past 12 years. But in the past two years or so, I have tried to transfer my creativity to the development of trading strategies. Tradingview is the ideal platform for me. I am selecting and contributing some of the hundreds of scripts to publish in Tradingview community. Welcome everyone to interact with me to discuss these interesting pine scripts.
The scripts posted are categorized into 5 levels according to my efforts or manhours put into these works.
Level 1 : interesting script snippets or distinctive improvement from classic indicators or strategy. Level 1 scripts can usually appear in more complex indicators as a function module or element.
Level 2 : composite indicator/strategy. By selecting or combining several independent or dependent functions or sub indicators in proper way, the composite script exhibits a resonance phenomenon which can filter out noise or fake trading signal to enhance trading confidence level.
Level 3 : comprehensive indicator/strategy. They are simple trading systems based on my strategies. They are commonly containing several or all of entry signal, close signal, stop loss, take profit, re-entry, risk management, and position sizing techniques. Even some interesting fundamental and mass psychological aspects are incorporated.
Level 4 : script snippets or functions that do not disclose source code. Interesting element that can reveal market laws and work as raw material for indicators and strategies. If you find Level 1~2 scripts are helpful, Level 4 is a private version that took me far more efforts to develop.
Level 5 : indicator/strategy that do not disclose source code. private version of Level 3 script with my accumulated script processing skills or a large number of custom functions. I had a private function library built in past two years. Level 5 scripts use many of them to achieve private trading strategy.
Tweezer Top & Tweezer Bottom Pattern (Expo)Tweezer Top/Bottom Pattern (Expo) indicator identifies real-time Tweezer Top and Tweezer Bottom in any market and in any timeframe. This is an enhanced version of the pattern which enables higher accuracy, and noise filtering. In addition to that, Tweezer Levels can be displayed which can be used in many different ways, for instance, as a stop loss level, or to confirm the signal.
The ideal Tweezer pattern includes that the wicks should be 100% the same length. However, that rarely happens. So in this enhanced version, the user can set the maximum change that is allowed between the wicks.
To enhance the signal accuracy a Bullish engulfing and Bearish engulfing filter can be toggled on. So a signal will only be displayed if an engulfing candle is in play.
HOW TO USE
Tweezer Top/Bottom should be used together with KEY market levels or with KEY supply/demand zones.
Enter Long: if a Tweezer Bottom signal occurs at a KEY Level or on a KEY supply/demand zone.
Target: The first target should be the nearest resistance level or supply zone. The second target should be the next resistance level or supply zone, and so on.
Enter Short: if a Tweezer Top signal occurs at a KEY Level or on a KEY supply/demand zone.
Target: The first target should be the nearest support level or demand zone. The second target should be the next support level or demand zone, and so on.
Stop Loss: The Tweezer levels can be used as a stop loss.
Remember: Use the indicator together with KEY levels or KEY Supply/Demand Zones.
INDICATOR IN ACTION
4 Hour chart
I hope you find this indicator useful , and please comment or contact me if you like the script or have any questions/suggestions for future improvements. Thanks!
I will continually work on this indicator, so please share your experience and feedback as it will enable me to make even better improvements. Thanks to everyone that has already contacted me regarding my scripts. Your feedback is valuable for future developments!
-----------------
Disclaimer
Copyright by Zeiierman.
The information contained in my scripts/indicators/ideas does not constitute financial advice or a solicitation to buy or sell any securities of any type. I will not accept liability for any loss or damage, including without limitation any loss of profit, which may arise directly or indirectly from the use of or reliance on such information.
All investments involve risk, and the past performance of a security, industry, sector, market, financial product, trading strategy, or individual’s trading does not guarantee future results or returns. Investors are fully responsible for any investment decisions they make. Such decisions should be based solely on an evaluation of their financial circumstances, investment objectives, risk tolerance, and liquidity needs.
My scripts/indicators/ideas are only for educational purposes!
-----------------
ACCESS THE INDICATOR
• Contact me on TradingView or use the links below

TBS - Trend Buy and Sell IndicatorTrend Buy and Sell Indicator
TBS identifies trend based on price cross-over/cross-under to a moving average. Confirmed Up-trend is displayed in green and Down-trend in red backgrounds. Before a trend is confirmed price cross-over is displayed in blue and cross-under in orange backgrounds. Once an uptrend is confirmed, TBS suggest buys based on touch downs to a Support moving average by a green arrow under the candle . A sell is suggested by TBS by a red arrow on top of the candle when the price reaches a certain percentage above support moving average. Motivation and Tolerance levels are provided to fine tune buying and selling signals.
Example : Default settings for BTC Weekly charts are Trend Moving Average = 50, Support Moving Average = 21, Motivation Buy = 10, Tolerance Buy = 5, Motivation Sell = 50 and Tolerance Sell = 90. That means in uptrend identified by green background every time the closing price touches 10% higher than 21 week moving average value TBS suggests buy, so a trader can choose to buy 80% of intended position at this level. If the price continues to drop down and touches 5% below 21 week moving average, a trader may choose to buy another 20% at this level. In the likely scenarios of price hike from here a trader may choose to sell 80% at the Motivation Sell level 50% higher than 21 week moving average. If the price reaches Tolerance Sell level at 90% higher than 21 week moving average a trader may choose to sell remaining 20% of the position.
Note 1 : TBS suggest Buys and sells but the execution of buy and sell is up to trader's discretion for example using Stop Buy order or Limit Buy order etc.
Note 2 : TBS is designed to be a medium to long term indicator for example weekly and monthly timescales. Traders might find it useful on shorter term time-frames but its not designed for short term time frame in mind.
Note 3 : Most of the parameters in TBS indicator are configurable as Trend Moving Average and Support Moving Average vary significantly across assets. Default parameters are set for Bitcoin Weekly time frame. Traders should play around with parameters to find best fit for Trend Moving Average and Support Moving Average for the asset of interest. For example TBS is very relevant and useful for Gold Weekly time frame with Trend Moving Average = 100, Support Moving Average = 30, Motivation Buy = 1, Tolerance Buy = 0, Motivation Sell = 11 and Tolerance Sell = 20.

Buying/Selling Pressure & Trend Strength/Direction (Zeiierman)█ Overview
Buying/Selling Pressure & Trend Strength/Direction (Zeiierman) transforms price behavior into a continuous, evolving map of bullish and bearish pressure. The system breaks every candle into internal buying pressure, selling pressure, net dominance, and the broader structural trend environment. These elements combine into a unified visual structure that reveals how actively each side participates and how organized or fragmented the underlying trend has become.
Long/Short Covered visualization adds an additional layer of insight by highlighting moments when traders unwind positions, often exposing squeeze conditions, exhaustion zones, or developing turning points before they appear in price alone.
⚪ Why This One Is Unique
This system stands out because it reconstructs market pressure from multiple directional components rather than relying on a single trend or momentum source. Instead of treating bullish and bearish movement as a simple up/down outcome, it forms a dual-sided pressure environment that adapts to how each side is behaving relative to its own historical structure. This produces a fluid, context-aware representation of participation that moves with the market instead of fighting it.
The anomaly-based Long/Short Covered component adds another layer of uniqueness. Rather than flagging spikes mechanically, it evaluates how current pressure behavior deviates from expected balance and highlights when traders are being forced out of positions. This produces a highly intuitive map of squeeze events, capitulation, and exhaustion dynamics.
█ Main Features
⚪ Buying/Selling Pressure Candles
Visualize the balance between bullish and bearish pressure as oscillator-style candles. Traders use these to quickly see whether current bars are dominated by buying or selling aggression and how strong that pressure is relative to recent history.
Fast Trend: A highly responsive trend layer that reflects short-term pressure shifts. Use it as the earliest indication of changing momentum and as a guide for deciding whether to participate in the developing pressure move or wait for stronger confirmation.
Core Trend: The underlying long-term pressure trend that reveals the broader market direction. Values above zero indicate a bullish regime, while values below zero indicate a bearish regime. Use the Core Trend to align your trades in the same direction as the dominant market trend.
Strong Trend: Strong Trend highlights periods of unusually intense and extended trend movement. These moves can continue for a while, but they often signal that the trend is becoming stretched. Extended Strong Trend conditions can precede exhaustion, deeper pullbacks, or even full reversals, so traders should remain cautious when these appear.
Established Trend: Identifies areas where market pressure has matured into a well-developed directional trend. Use this as a high-confidence confirmation layer. If the Established Trend begins to fade or stop printing while the price weakens, it can be an early sign that a pullback or reversal is approaching.
⚪ Long/Short Covered
Highlights candles where the pressure structure suggests aggressive unwinding of existing positions (longs or shorts). These zones often align with sharp spikes, squeezes, or capitulation and can be used to time reversals, profit-taking, or fade extreme moves.
⚪ Pressure Changes
Pressure Cross
Pressure Cross events show clear shifts where one side’s pressure overtakes the other. They signal that the balance of force is changing, but they still require confirmation from the Fast or Established Trend before being used as entry triggers or position add-ons.
Pre Signals
Pre Signals appear even earlier and highlight the first hints of pressure building in the opposite direction. They act as early heads-up alerts that may reflect short-term fluctuations, so traders should wait for additional confirmation before treating them as meaningful trend movement.
█ How to Use
⚪ Breakout/Momentum Trading (Buying and Selling Pressure)
Buying and selling pressure is displayed directly through the pressure candlesticks. The stronger the coloring, the stronger the force behind the move. This makes it easy to see which side is in control and whether the market is building enough pressure for a breakout or continuation. Traders can use this to gauge the strength of a move and align their entries with the dominant side of the market.
Breakout Trading
When strong green pressure candles appear as the price approaches resistance, it shows that buyers are actively pushing the breakout. Likewise, strong red pressure candles during a breakdown indicate decisive selling pressure. These surges help confirm whether a breakout has real strength behind it and reduce the chances of entering weak or false moves.
Bullish Breakout
Bearish Breakout
Momentum Trading
The deeper the candle coloration, the stronger the underlying momentum. Intense green candles reflect an accelerating bullish drive, while intense red candles reflect an accelerating bearish drive. Traders can use these moments to enter in the direction of momentum, focusing on strong moves that are more likely to continue.
Note: To capture longer and more sustained momentum moves, increase the candle length above 30.
⚪ Trend Trading
The indicator provides several components to evaluate trend direction and trend maturity. The pressure candlesticks and the Core Trend form the foundation of trend detection, while the Established Trend and Strong Trend features help confirm when a trend has developed into a mature, sustained phase. These layers together help identify trends with a higher likelihood of continuation or potential exhaustion when the move becomes extended.
Note: To capture longer and more sustained trend moves, increase the candle length above 30. You can also raise the Smoothed value into the 10–30 range for additional stability.
Candlesticks or Fast Trend
The pressure candlesticks and the Fast Trend can both be used to read trend direction. When green candles dominate and extend above the +200 region, and the Fast Trend is rising while red candles stay above the −200 region, the market is operating in a bullish environment. When red candles dominate below the −200 region, and the Fast Trend is falling while green candles stay below the +200 region, the environment is bearish. Stronger candle coloration and a firmly aligned Fast Trend both signal stronger trend behavior.
Core Trend
The Core Trend complements the candlesticks by offering a clear background bias. Green histogram bars indicate bullish conditions, while red histogram bars indicate bearish conditions. Traders can use the Core Trend to validate whether the pressure structure aligns with the broader directional bias.
⚪ Pressure Changes
Pressure Changes highlight moments where buying and selling pressure begin shifting from one side to the other. These movements often appear before trend transitions, but they are not trend reversals by default. Instead, they reveal temporary or emerging changes in pressure that may or may not develop into a lasting move. Traders should treat these signals as early information that needs further confirmation.
Pressure Cross events mark clear shifts where one side’s pressure overtakes the other. These events show that the balance of force is changing, but they do not guarantee a sustained trend reversal. Traders should confirm the shift by checking alignment with the Fast Trend, Core Trend, or Established Trend before acting on the signal.
Pre Signals appear even earlier than Pressure Cross events and highlight the first hints of pressure building in the opposite direction. These signals offer early awareness but can represent short-term fluctuations rather than meaningful shifts. Traders should use them as heads-up alerts and rely on additional confirmation tools to determine whether the pressure change will evolve into a genuine trend movement.
⚪ Reversal/Pullback Trading (Long/Short Covered)
Long traders eventually need to sell, and short traders eventually need to buy back. These actions can create meaningful pressure spikes that often appear near reversal zones or trend pullback areas.
Long Covered events tend to occur when long positions are being unwound, often marking potential reversal points or areas where price may find support within an existing uptrend. This can provide early clues that the current move is losing steam or preparing to reset.
Short Covered events tend to occur when short positions are being closed, often appearing near resistance zones or within strong downtrends where the market temporarily retraces. These signals can act as early warnings of pullbacks or exhaustion within broader bearish flows.
⚪ Overbought/Oversold
When the pressure candles reach the upper or lower limits, the market may be entering an extended condition. These zones often precede pauses, pullbacks, or full reversals, depending on the broader context. Traders can treat these boundaries as early caution areas where strong moves may temporarily lose strength.
⚪ Divergence Trading
The pressure candles naturally highlight divergences. When price makes a new high or low but the pressure candles fail to confirm with equally strong activity, it suggests that buying or selling pressure is fading. These divergence patterns can help traders identify potential reversal points or weakening momentum in ongoing trends.
█ How It Works
⚪ Buying/Selling Pressure
The indicator reframes each bar through a two-channel transformation that separately models bullish and bearish pressure. Instead of interpreting movement as a single directional value, the system generates a pair of opposing pressure streams that evolve against each other. This creates a dynamic field where dominance, imbalance, acceleration, and exhaustion can be observed simultaneously.
Calculation: Constructs a bi-directional pressure surface using normalized displacement relationships, volatility-adjusted scaling, and directional competition modeling.
⚪ Adaptive Strength Normalization
To avoid flat readings, each side’s pressure is evaluated relative to its own historical envelope, producing a normalized strength scale. This allows the model to interpret current motion in the context of what has recently been “strong” or “weak,” rather than relying on static reference levels.
Calculation: Applies rolling extremum mapping and nonlinear rescaling, converting raw directional activity into a bounded strength metric that reflects real-time contextual significance.
⚪ Geometric Trend Core Engine
Trend state is derived by combining directional pressure into a geometrically structured core. This core reacts not only to direction but to symmetry, dispersion, and slope of the pressure environment. When the core flattens while pressure expands, the system recognizes structural organization, flagging strong trends.
Calculation: Uses geometric mean transformations and smoothed envelope interactions to build a stable trend backbone that identifies when movement transitions from noise into coordinated directional behavior.
⚪ Long/Short Covered Anomaly
Long/Short Covered events emerge from a comparison of expected vs. actual pressure symmetry. When bullish and bearish gradients diverge beyond a context-defined limit, the system interprets it as forced unwinding or aggressive covering. These anomalies often signal structural stress, squeezes, or capitulation.
Calculation: Implements a bidirectional gradient comparison model, where deviation from the neutral equilibrium curve produces a significance score. If this score exceeds its adaptive threshold, an anomaly event is triggered.
-----------------
Disclaimer
The content provided in my scripts, indicators, ideas, algorithms, and systems is for educational and informational purposes only. It does not constitute financial advice, investment recommendations, or a solicitation to buy or sell any financial instruments. I will not accept liability for any loss or damage, including without limitation any loss of profit, which may arise directly or indirectly from the use of or reliance on such information.
All investments involve risk, and the past performance of a security, industry, sector, market, financial product, trading strategy, backtest, or individual's trading does not guarantee future results or returns. Investors are fully responsible for any investment decisions they make. Such decisions should be based solely on an evaluation of their financial circumstances, investment objectives, risk tolerance, and liquidity needs.
유료 스크립트

TradeChartist TrendRider Companion ™TradeChartist TrendRider Companion is an exceptionally beautiful and a functional indicator that can be used as a companion with ™TradeChartist TrendRider or as a standalone indicator and can also be used with other scripts. The indicator plots the trend based on Momentum, Volatility , detecting critical zones of Support and Resistance along the way, which helps the indicator find the right trend to ride, plotting Trend Intensity and Trend Markers based on only one piece of User input - TrendRider Type (Aggressive, Normal or Laid Back).
===================================================================================================================
What does ™TradeChartist TrendRider Companion do?
TrendRider Companion plots Trend Intensity along with Bull and Bear Trend Markers on chart, which helps the user get a visual confirmation of the Trend.
TrendRider Companion paints Trend strength on price bars based on the Color Scheme, if this option is enabled from the indicator settings.
===================================================================================================================
The script is pretty straight forward to use on any chart to track the trend intensity. ™TradeChartist TrendRider uses the same logic to detect the trend but TrendRider also plots critical Support/Resistance zones, detecting any breaches or fail of those levels on a candle close before reversing the Trend Ride.
===================================================================================================================
Best Practice: Test with different settings first using Paper Trades before trading with real money
===================================================================================================================
This is not a free to use indicator. Get in touch with me (PM me directly if you would like trial access to test the indicator)
Premium Scripts - Trial access and Information
Trial access offered on all Premium scripts.
PM me directly to request trial access to the scripts or for more information.
===================================================================================================================

Market Trading Tools - Trend ReversalsOur Trend Reversals indicator is there to notify you when a trend reversal (depending on your time frame) might occur.
Trend Reversals will signal a cross shape signal (X), that will be in red when a downfall might happen and will be in green when a movement up is about or might happen. The indicator algorithm is based on 3 indicators, when these three intersect, the signal will be fired once the condition is met.
** Our Indicator does not repaint.
** It can be used on any financial market; crypto, stocks or forex. We also encourage using time frames as the 15 minutes and above. The use of a higher than 4hr time frame requires special settings and once you have access to it, you can change the parameters as you want. We have enabled our users to freely use the settings as they wish and to their own discretion.
Once you are granted access to use it, add it from going into the scripts >> invite only scripts >> enable the indicator. Once the indicator is added to your chart you will see the indicator popping up on your chart.
We believe that we have not seen a similar indicator, and we are proud of our work and we will continue updating the indicator when we believe it is necessary according to market changes. We have also enabled a function for our users to get a better view of the trend when they add the indicator to their chart. You can now view the trend background color (red&green) depending on if the price is above the EMA of your choice. you can also check whichever time interval you want that does not limit you to the time interval chosen on your chart itself.
Hope you enjoy it, Good luck and stay safe!
** If you are interested in this indicator. please use the link below to obtain access to this indicator

STOCH_HVP(picte)This indicator is made up of a stochastic oscillator and of historical volatility percentile. Historical volatility percentile basically tells you how volatile the market is based on how volatile it has been in the history.
Historical volatility is great for trading options but i have also found it to be great at finding trades with good risk/reward ratio. When market has extremely low volatility we can expect a bigger move to emerge along with expansion of volatility. But since historical volatility does not imply the direction of the market i added a stochastic oscillator with some horizontal levels i have found to serve as good support/resistance levels.
I found it useful for trading Forex pairs but it is especially powerful with bitcoin.

Trend reversal strategy "muxie2" with safety SL, about 2x PFThis is a modified version of my script muxie1.
The muxie1 is more profitable in backtesting but is more risky as the stop loss is only triggered when a reversal happens and orders 2x more in reverse direction.
The current script works the same but if loss is substancial and reaches the safety stop loss then the trade is closed.
This uses 2 EMA and Stop Loss and Take Profit,
The soft stops don't fire at the precise value but only when the trend reverses
it is actually good for 1D timeframe since 2019, it was however optimised for 1min but I am not able to share scripts for 1m.
Have equivalent code for quantum zone Ftx.
Note the stops are in dollars of btc price, so this makes sense for bitcoin only.

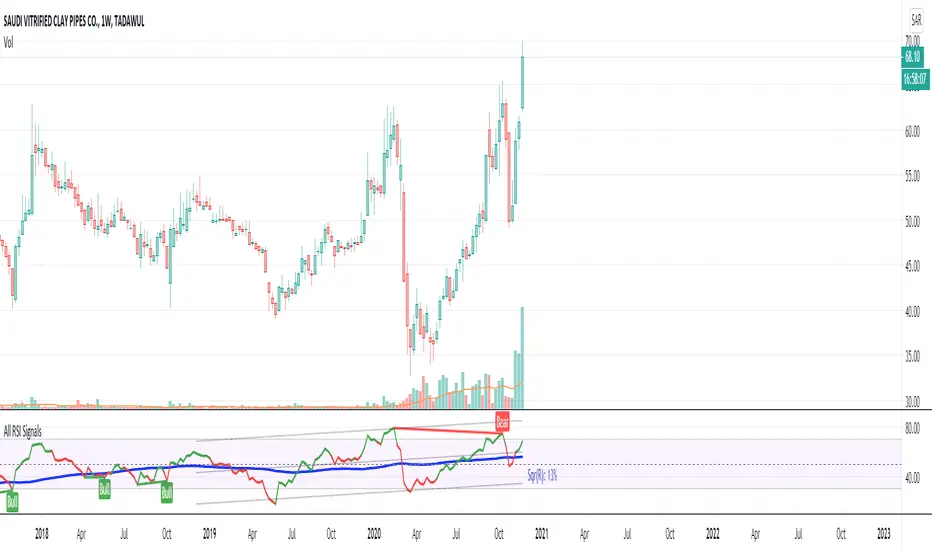
All RSI Signals v1Hi All,
RSI is a widely accepted indicator by most of the traders. I built this indicator to present all the RSI buying and selling signals that can be missed to get the best use of this indicator.
The indicator is composed of:
1. RSI
2. Stochastic RSI
3. Linear regression for the RSI
The short signals provided by the stochastic will support short term traders to catch every move and maximize the profit. The idea is that:
1. The stochastic stochastic RSI will give the RSI a colour based on the potential movement. blue colour for uptrend and red for the downtrend
2. The linear regression will provide the directions of the RSI and facilitate the indication of any divergence with the stock or commodity trend
3. Based on my tests, It's better to buy only if the RSI is between 30 to 70 and the stochastic between 20 and 60 to ensure a strong trend and capture the right amount of the revenue
Hope you enjoy it and remember that all the variables are editable to support you in customizing it based on your experience and market behaviour
EMA trend reversal strategy "muxie1" - 1.5x to 3xThis uses 2 EMA and Stop Loss and Take Profit,
The stops don't fire at the precise value but only when the trend reverses
it is actually good for 1D since 2019, it was however optimised for 1min but I am not able to share for 1m.
have equivalent code for quantum zone ftx
Great profit factor from 1.5x to 3x
Mandatory input is the position size per trade, tested with 1 btc for 100k virtual capital, remember to set it small for a low risk per trade, and even smaller if you use leverage,

Sto RSI and kijun-sen line to determine and follow the trend This script uses 25-75 treshold of stochastic RSI with the help of kijun-sen as confirmation, to find entry points to any trend either newly developed or an established one. I just realized it on the 1 hour SPX chart. Sure it can be used on other symbols. Crossing above/below 25/75 line of sto RSI is considered as buy/sell signal. Signals are evaluated whether price be above/below kijun-sen line. If a sell signal below kijun-sen is generated it is a continuation signal for downtrend, otherwise it is a countertrend signal (maybe a signal for a new downtrend). A countertrend signal must be evaluated carefully and only accepted in the right side of kijun-sen. e.g entering a sell signal generated above kijun-sen should be accepted only below the kijun-sen, vice-versa.

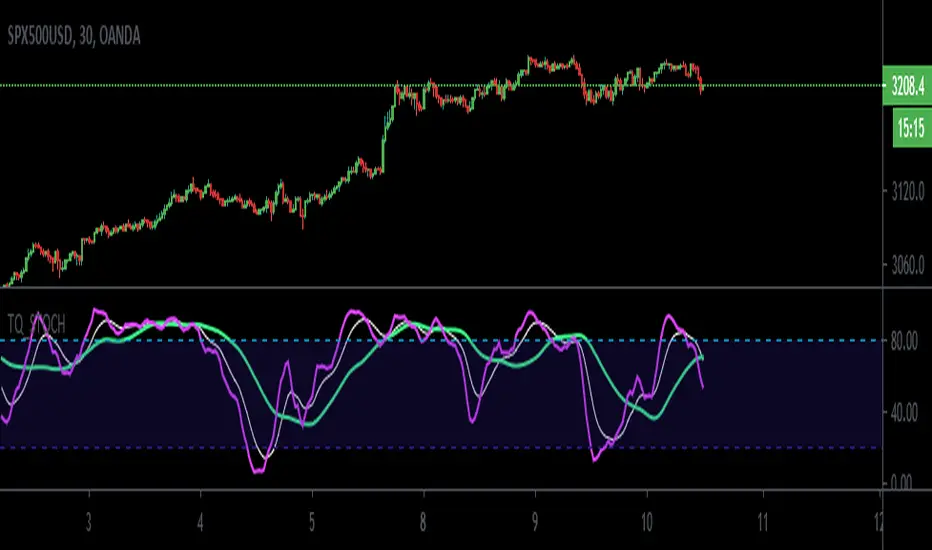
TQ_STOCHThis is a modified stochastic oscillator. It works very well with Forex pairs, traditional markets and has also proved itself profitable with BTC. The aim of this indicator is to help you predict a change in direction of the market.
When lower periods are above higher periods you are looking to buy of support and when lower periods are below higher periods you are looking to sell of resistance.
Lowest period: pink
Medium period: white
Longest period: turquoise
PERFECT LONG: pink line above the white and white above the turquoise. Turquoise should serve as support for the white line and white line should serve as support for the pink line. BUY when pink line tests the white line and bounces off.
PERFECT SHORT: pink line below the white and white below the turquoise. Turquoise should serve as resistance for the white line and white line should serve as resistance for the pink line. SELL when pink line tests the white line and bounces down.
You can also play less perfect signals where pink or white tests blue as support or where white is not above the blue line yet but you still get a test of the white from the pink. These are slightly more risky.
- SOME SIGNAL EXAMPLES:
Enjoy :)
Candlestick Reversal SystemHello Traders,
In the book "Secrets of a Pivot Boss: Revealing Proven Methods for Profiting in the Market" by Franklin Ochoa, Four different types of reversal systems were introduced and candlestick patterns are used to find reversals. I will not write a lot about the book, you should get/read it for yourself. There are many great ideas in the book, Candlesetick Reversal System, Following Trend, Time Price Opportunity, Advanced Camarilla Concepts and much more.
Reversal systems mentioned in the book are :
- Wick Reversal System
- Exteme Reversal System
- Outside Reversal System
- Doji Reversal System
I tried to add these four reversal systems to the script. If you need detailed info you better read the book ;)
Enjoy!

Bullish and Bearish Engulfing and RSI, DMI and PSAR confirmationThe study combines Bearish and Bullish Engulfing pivot strategy with strong trend confirmative indicators:
Directional Movement Index (DMI)
Parabolic SAR
RSI Bands
Engulfing patterns in market provide a useful way for traders to enter the market in anticipation of a possible reversal in the trend. Engulfing candles tend to signal a reversal of the current trend in the market. This specific pattern involves two candles with the latter candle "engulfing" the entire body of the candle before it. The engulfing candle can be bullish or bearish depending on where it forms in relation to the existing trend
The indicator can be applied to trading pairs with USD, USDT, ETH and BTC quote currencies. Indicator supports spot, futures and marginal trading exchanges. It calculates and compares values of the price action candles to define is there an engulfing and what type it is: bullish or bearish:
If there is a bullish engulfing the indicator fills price action candle with yellow color
If there is a bearish engulfing the indicator fills price action candle with purple color
Advantages of this indicator:
1. This indicator reveals presence of both types of engulfing simultaneously
2. Weak engulfment signals and market noises are filtered by RSI bands, DMI and PSAR confirmations. This allows to receive only strong and confirmed engulfments
3. This indicator includes both
Study with built-in custom alerts to use with your own software through web hook connection.
Strategy with configurable risk management settings (order size, commission, take profit, stop loss and trailing). This provides you opportunity of direct broker connection and allows to conduct backtests before applying the strategy to real account
At the chart you can see the historical price action of XBTUSD at BitMEX exchange from 9th of May 2020 till 17th of May 2020 indicator. Moments when the indicator triggered to enter a position are described with message clouds. Moments when a certain position should be closed are highlighted with circles and commented with clouds
How to use?
Long signals:
1. Apply indicator to the trading pair your are interested in
2. Once bullish engulfing conditions are met price action candle will be colored yellow.
3. Once price action breaks RSI resistance band, retraces and closes below the band the signal is finished and the position should be closed
Short signals:
1. Apply indicator to the trading pair your are interested in
2. Once bearish engulfing conditions are met price action candle will be colored purple.
3. Once price action breaks RSI support band, retraces and closes above the band the signal is finished and the position should be closed
Automatic strategy:
When conditions of long or short position from the strategy are met the script opens position.
Strategy.exit closes the position once risk management settings are met.
Strategy.close closes the position once RSI band rejection is confirmed
If you want to obtain access to the indicator please send us a personal message
Best regards,
SkyRock Signals team

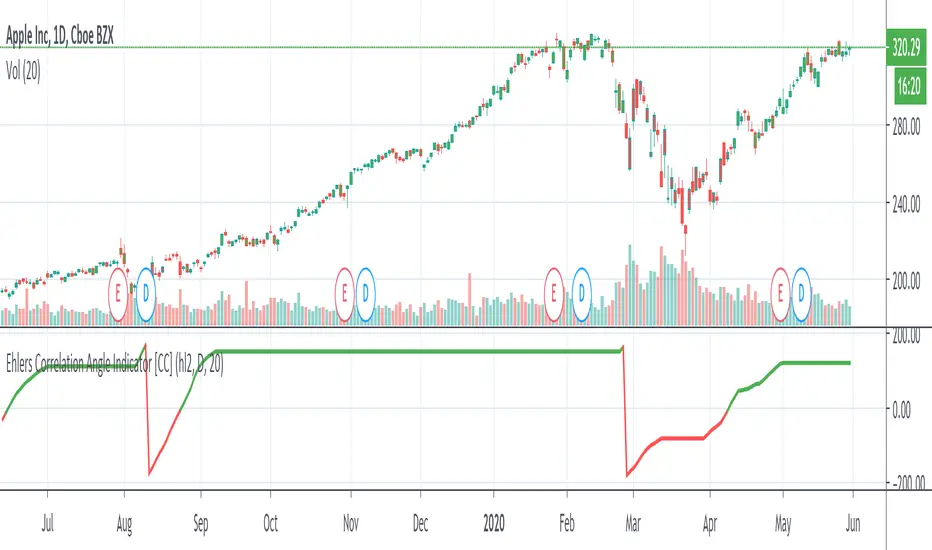
Ehlers Correlation Angle IndicatorThe Correlation Angle Indicator was created by John Ehlers (Stocks & Commodities V. 38:06 (8–15)) and this is technically three indicators in one so I'm splitting each one to a separate script. This particular indicator was designed for trend termination and simply buy when it is green and sell when it turns red.
Let me know if you would like to see me publish other scripts or if you want something custom done!
Pivot TrendHello Traders,
Another original idea is here with you. Actualy I can say that it's a breakout strategy that uses multiple Pivot Point's averages.
How it works?
- it finds the Pivot Points, you can set the length as you want
- it gets averages of Pivot Highs and Pivot Lows, you can set the number of Pivot Points to be included
- it compares the current closing price with averages of Pivot Highs and Pivot Lows
- if both are positive or negative then trend changes
You have two options:
- Pivot Point Period => is the length that is used to find Pivot Points. means it checks left/right bars if it's Pivot Point (4 by default)
- Number of PP to check => is the number of Pivot Points that the script finds and calculates the averages (3 by default)
An Example with the settings Pivot Point Period = 5 and Number of PP to check = 2
Play with settings as you wish. Comments are welcome, together we can improve it ;)
Enjoy!