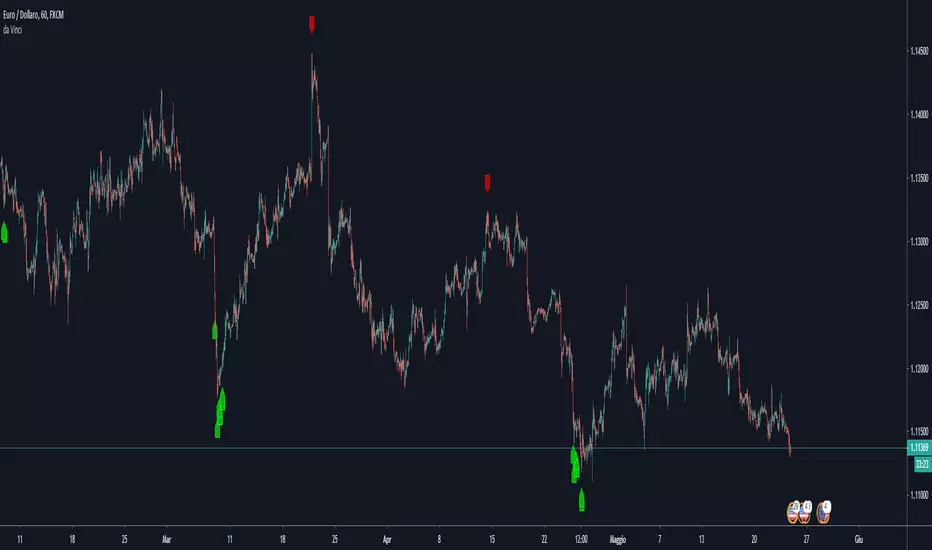
Trendreversal
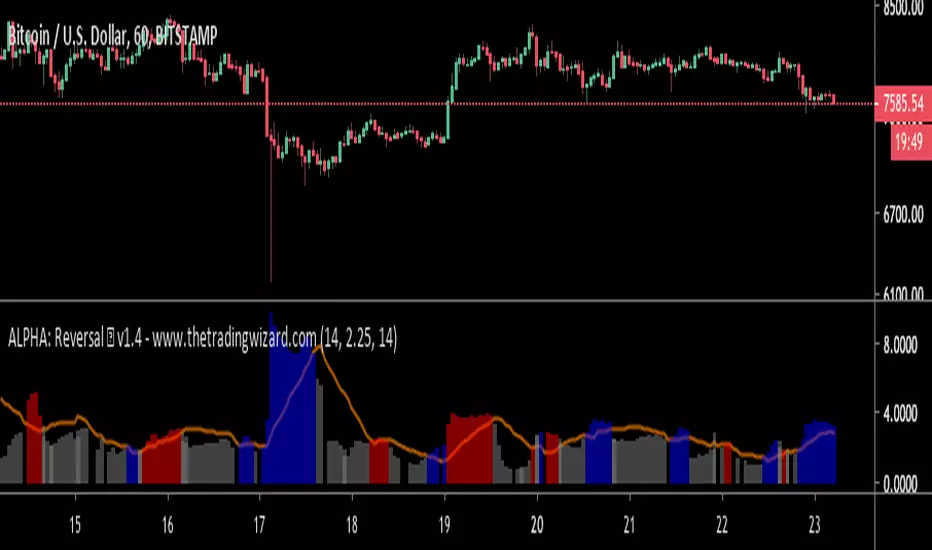
ALPHA: ReversalWhat is a divergence?
In the case of strength and momentum indicators, it is when the price deviates from the movement of the oscillator, it can have significant implications for trade management.
Divergences in an uptrend occurs when the price makes a higher high but the indicator does not. In a downtrend, divergence occurs when the price makes a lower low, but the indicator does not. When a divergence is spotted, there is a higher probability of a price reversal.
Divergences helps the trader recognize and react appropriately to a change in price action. It tells us something is changing and the trader must make a decision, such as tighten the stop-loss or take profit. Seeing divergences increases profitability by alerting the trader to protect profits or open a position.
Divergences indicate that something is changing, but it does not automatically mean the trend will reverse. It signals the trader must consider holding, tightening the stop loss, opening a position or take profit.
Introduction
The Alpha: Reversal is an indicator based off of the Stochastic, Relative Strength Index and Momentum indicator. Its sole purpose is to be able to identify divergences when they matter and identify high probability reversal areas. The formula used between the three indicators will be kept proprietary, in addition to the slight changes made on the Stochastic formula. The indicator plots the histogram with a divergence formula within a 14 period look-back on default. Additionally, there is a moving average of the histograms movement to identify the divergences when they matter.
Divergences exist on just about every candle, most of the time they are at a minuscule level. Rarely do the price and oscillator movement collude, the question becomes when do these divergences matter?
With that in mind I approached the task of finding a reliable reversal model. On default, the indicator has a moving average that measures the past histogram (the formula of the three indicators) movement to identify when a high potential trend shift may happen.
Keeping volatility in mind there is a feature called "Fixed Threshold" in settings. Various assets move at different speeds, so the indicator needs the ability to adjust to fit the assets speed. This "Threshold" option does not have a set of rules to use for each asset, the option is there though, so it may be adjusted by the analyst manually if the histogram moving average seems inaccurate due to volatility or lack thereof. In future publications (or possibly indicator updates) I plan on expanding on a fixed set of rules for various assets. This will take considerable time to research and backtest the various values needed for an asset's speed, so for now the default MA can be used until you are comfortable with adjusting the threshold level manually.
The look-back period on the histogram and threshold MA can be adjusted to whichever time period you would like. However, the default 14 is typically what is best considering the inputs of the three underlying indicators.
Analysis
The indicator is actually quite simple to read. When the price spikes blue, there is a high probability of reversal, same goes for red but in the opposite fashion. Now as always, you should use this indicator as an analysis tool and not rely on it by itself. Many times Cryptocurrencies couldn't care less about strength or oversold/overbought and volume explodes out of nowhere, I highly recommend you use price action in addition to Alpha: Exhaustion and Alpha: Volume with this tool. Oh wait, Alpha: Volume is not out yet.... SOON. :)
Point is, use proper analysis techniques with this indicator, nothing is perfect. NOTHING. But the Alpha: Reversal is a great tool to use for not only the beginner trader, but the advanced also. There is a ton of ways to use this indicator beyond the high probability reversal areas, I am discovering some really neat patterns within my new formula that I plan on expanding on in future publications, i.e. dead cat bounces and relief candles plus a few more.
Conclusion
The Alpha: Reversal is a great analysis tool that I now use on all my charts, as time goes on I plan on holding classes for its users on a regular basis to expand on the various techniques that can be implemented in addition to publishing research relevant to its purpose.
Access to the indicator can be purchased on my site www.thetradingwizard.com with either a monthly option for this & the Alpha: Exhaustion (), or a lifetime subscription independently. All updates and changes will be done automatically and included for every user. The Alpha series is designed to help you make your analysis easier to comprehend and more accurate, I really think this one will be enjoyed by many for years to come, I have enjoyed designing and using this immensely. As always, please make your own decisions when trading and use proper analysis techniques.
Note: The options within the Alpha: Reversal allow the indicator to be used on any timeframe & any asset. As with any indicator, the higher the timeframe, the higher the accuracy.
Disclaimer
Nothing in this post is to be used or construed as financial advice. This post is meant as an educational post to explain the functions of the indicator.
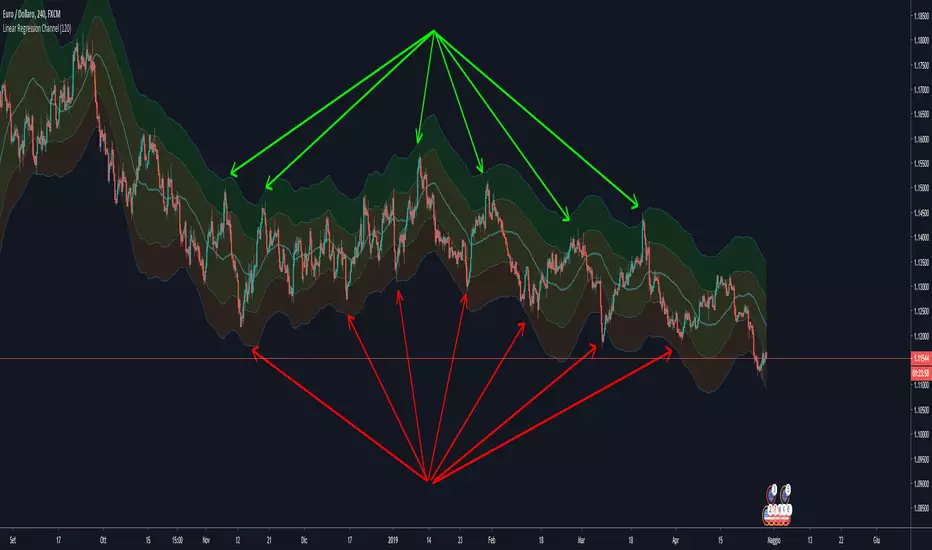
linear regression channelThe linear regression indicator is used for trend identification and trend following in a similar fashion to moving averages.
Best time frames to use the indicator: H1/H4
Trend is your FriendTesting "Trend is your Friend" indicator on the top 10 stocks in ASX300 for this year 2018-2019
Let's see how this indicator performs. If indicator works there should be lots of buy and hold during up trend then sells at momentum reversal near the peaks of prices to maximize profits. Buy and hold (uptrend) = green triangles; Sell (downtrend)=pink triangles. This should ride the trend/friend for benefits.
Top stocks and their gains for the year below.
1. NEA Nearmap +200%
2. CUV Clinuvel + 189%
3. APT Afterpay +153%
4. AMI Aurelia Metals + 137%
5. BVS Bravura Solution +133%
6. APX Appen +120%
7. IEL Idp Education +110%
8. NHC New Hope Corporation +88%
9. IFM Infomedia +87%
10. IPH +77%

Volume ImpactVolume Impact (The area)
Average Volume (The thick line, xTrigger)
Volume Impact = Volume Chance - Average Volume
It provides very reliable buy sell signals. Buy(green) when increasing, sell(red) when decreasing. Volume Impact might drop before the actual price so it has an early warning potential.
Before trend changes volume average diverges from the prices. It moves reverse to the prices.
Also before trend changes, volume impact peaks diverges from price peaks. So you know a big drop is coming.
Klinger Volume Oscillator inspired this indicator... This data is there but it is more difficult to interpret.
In summary, you can foresee trend changes.
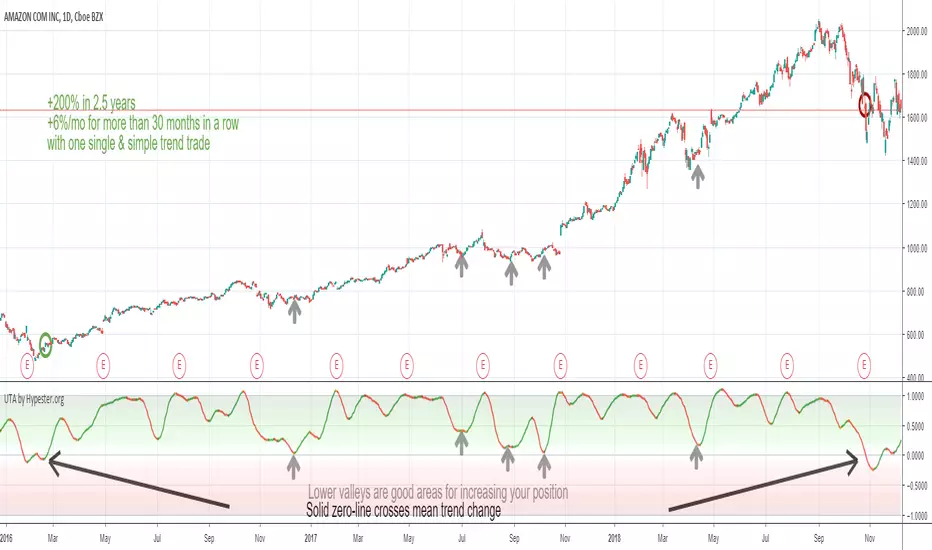
Ultimate Trend Analyzer by HypesterTrading is not all about scalping/day trading. To have a healthy and diversified portfolio, you should always have some trending long term assets to mitigate risks and keep your wallet always on the green side.
That's why Hypester once again innovates with the Ultimate Trend Analyzer. With the UTA you can check the trend's health with one glance.
Do not fool yourself, the Ultimate Trend Analyzer offers different trading profiles, so it doesn't matter what kind of trading you are doing, from long positions to intraday scalping - UTA can quickly adapt with one click. UTA offers Swing/Longterm, Day Trading and Scalping profile.
It also has two correlation methods, volume, and price. So you can decide what you want to prioritize most.
Not only that, there are two smoothing methods, linear regression and symmetrical averaging so you can remove noises from your indicator line.
The UTA offers you insight about the trend's health, just by looking at the background color, the stronger the color, stronger the trend. So higher up it is, stronger the uptrend is. The lower it is, stronger the downtrend.
Nevertheless, the UTA also gives you insight within trend corrections and peaks and bottoms with the indicator line color. So if you have a bullish trend and you see an orange line color, it means that direction is changing and you will observe a line color change, which means the course is now bearish even though the overall trend is going up. This feature is great for swing/scalp trading looking at the big picture.
TFTF is an algorithm that solves one of the big unknowns of any trader, the direction where the prices of the asset will go.
TF is based on the analysis of sentiment and other macro economic factors that influence the evolution of present and future prices of almost any asset.
The algorithm performs the necessary calculations and draws a a lower indicator of green or red bar. In this way alerts a future evolution of prices. As soon as that bar goes from green to red or vice versa, it indicates that prices are going to fall or rise respectively and as long as the indicator bar continues in the same color it indicates that the trend is still strong. This is a dynamic indicator and can change the alert regardless of whether the candle has closed or not.
TF must be used in conjunction with other indicators of your preference to find the right time to go long or short, or to find levels of overbought or oversold, support or resistance levels, Fibonacci or those of your preference to find the best points of entry or exit. In short TF allows to resolve the doubt in which side of the trade I must place, whether to go long or short.
It can be used in any type of asset, Stock, Futures, Forex or Crypto and in almost any time frame. The greater the volatility of the asset, the timeframe may be shorter.
AAPL 2018 in a daily basis highlighting the buying days
AAPL 2018 in a daily basis highlighting the selling days
ESZ8 in 15 min time frame
CLF9 in 240 min time frame
2 Week Low/2 Week HighScript used to identify the 2 week high and low. This helps in identifying trend reversals.

TREND REVERSAL DETECTOR TR detector: Trade with the trend not against it. This indicator will warn you in advance before the market changes its direction.

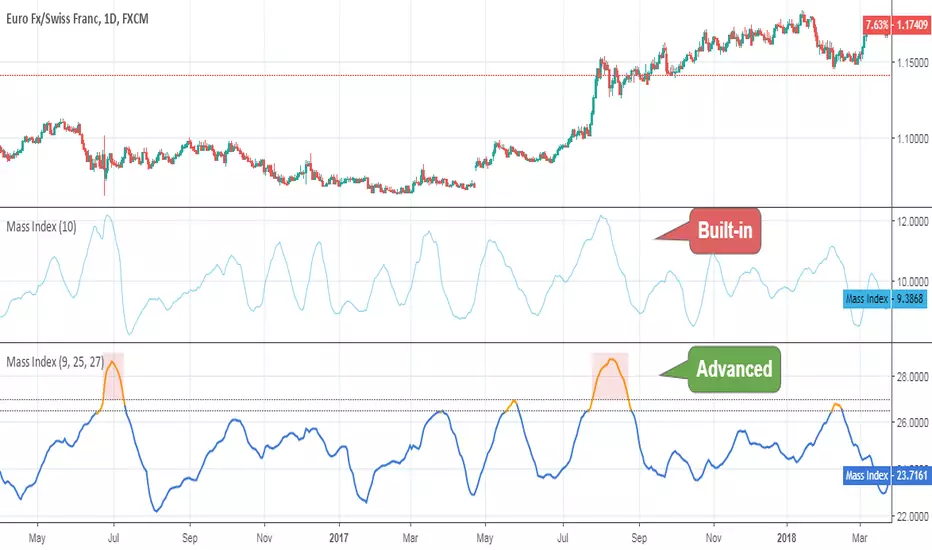
Mass IndexThis indicator was originally developed by Donald Dorsey (Stocks & Commodities, V.10:6 (June, 1992): "The Mass Index").
Specially for @AlexMayorov :
If indicator reaches 27 and then falls to below 26.5 then it could be a signal of potential trend reversal.
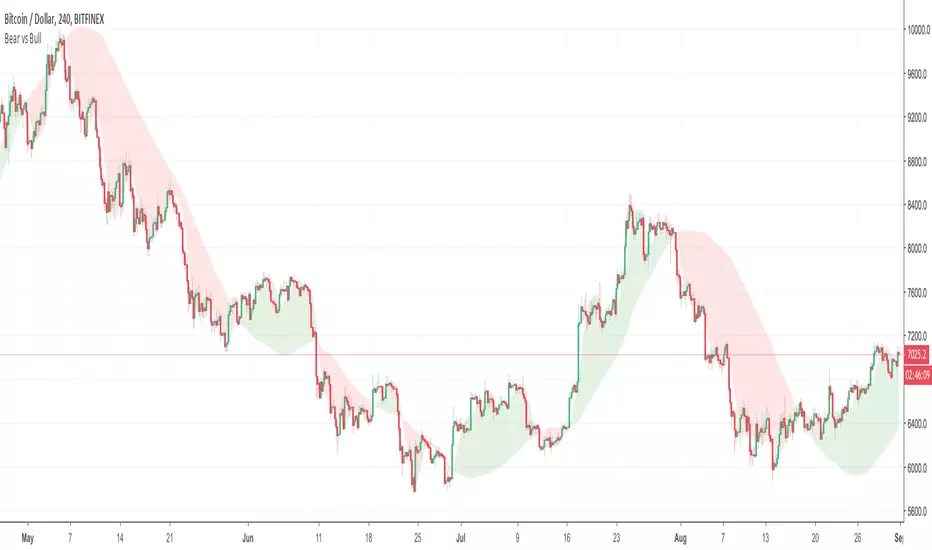
Bear vs Bull Trend indicator by Atilla YurtsevenHi Traders,
Bear vs Bull Trend indicator helps you to determine the trend direction easily. Using this indicator, you will not need to look for the cross-over anymore. You can simply choose your favorite Trend detection indicator from the properties (sma, wma, ema, linear). I usually use Linear trends.
Disclaimer: All the information in this article, including the algorithm & indicator, was provided and published for informational purposes only and should not be considered legal or financial advice.
PS: Please leave some comments and remember to follow me. I share only the indicators that i use.
Happy trading :)
Atilla Yurtseven
Fractals and Pattern MandelbrotThis indicator show classic fractals and patterns of force long or short if they are on the top or on the low of a x candles, so they try to anticipate the inversion of the trend.
The purple arrow indicate the fractals and the blue indicate the pattern for the inversion of the trend.
For the targets and the stop we need to use Fibonacci extentions modificate with this values:
-1.64
-0.64
1.5563
2.422
3.5699
4.669
5.8664
9.1299
14.208
and use this A,B,C points:
For long positions A is the LAST RED CLOSE, B is the GREEN CLOSE just before the blue arrow, C is B.
the -1.64 is the stop loss, if price close under that
the -0.64 is the best level to enter long
For short positions A is the LAST GREEN CLOSE, B is the RED CLOSE just before the blue arrow, C is B.
the -1.64 is the stop loss, if price close above that
the -0.64 is the best level to enter short

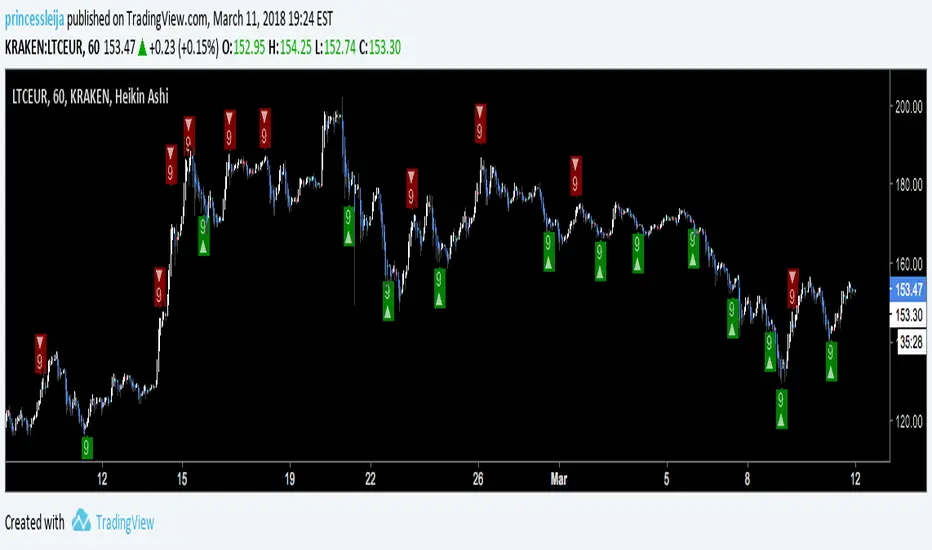
PRINCESSLEIJAS TDSSDue to several requests I'm going to give you temporary access to my TDSS script once again. In this version you can add the signals to your alerts (just right-click on a green/red signal and choose "Add Alert"). Please remember just to buy under a solid base and just use these signals as an indicator to catch highs/lows.
ALWAYS USE HEIKIN ASHI
May the force be with you,
-princessleija-
ITekSignal Full v1.0 Trend REVERSAL and CONTINUATION ITekSignal Trading System helps you identify trend reversals — quickly and accurately.
There’s a price action pattern that occurs in every market and on every time-frame.
This price pattern shows a fight for balance, between seller and buyers…
When the pattern is completed, that means the fight for balance has ended.
And you’d know which side has won: Seller or Buyers, Supply or Demand, Bulls or Bears.
Once ITekSignal indicator has spotted a reversal, it clearly displays these Buy or Sell alerts on your charts… showing you exactly where possible reversals may occur.
ITekSignal Indicator will draw an up/down arrow on your chart, telling you there’s a trade opportunity for you to consider. So we’d enter the market for a ride of the new trend.
The indicator is also capable of detecting CONTINUATION pattern (in addition to REVERSAL patterns)
ITekSignal indicator gives you all kinds of alerts you’ll ever need:
Trend Reversal alert & Trend Continuation alerts
Contact the Author for Subscription
@iteksignal
iteksignal@gmail.com

Matrix Trend Reverse EngineeringSelling algorithms.
Contact me to code your own indicators or strategy.
Big Snapper Alerts R2.0 by JustUncleLThis is a diversified Binary Option or Scalping Alert indicator originally designed for lower Time Frame Trend or Swing trading. Although you will find it a useful tool for higher time frames as well.
The Alerts are generated by the changing direction of the ColouredMA (HullMA by default), you then have the choice of selecting the Directional filtering on these signals or a Bollinger swing reversal filter.
The filters include:
Type 1 - The three MAs (EMAs 21,55,89 by default) in various combinations or by themselves. When only one directional MA selected then direction filter is given by ColouredMA above(up)/below(down) selected MA. If more than one MA selected the direction is given by MAs being in correct order for trend direction.
Type 2 - The SuperTrend direction is used to filter ColouredMA signals.
Type 3 - Bollinger Band Outside In is used to filter ColouredMA for swing reversals.
Type 4 - No directional filtering, all signals from the ColouredMA are shown.
Notes:
Each Type can be combined with another type to form more complex filtration.
Alerts can also be disabled completely if you just want one indicator with one colouredMA and/or 3xMAs and/or Bollinger Bands and/or SuperTrend painted on the chart.
Warning:
Be aware that combining Bollinger OutsideIn swing filter and a directional filter can be counter productive as they are opposites. So careful consideration is needed when combining Bollinger OutsideIn with any of the directional filters.
Hints:
For Binary Options try ColouredMA = HullMA(13) or HullMA(8) with Type 2 or 3 Filter.
When using Trend filters SuperTrend and/or 3xMA Trend, you will find if price reverses and breaks back through the Big Fat Signal line, then this can be a good reversal trade.
Some explanation about the what Hull Moving average and ideas of how the generated in Big Snapper can be used:
tradingsim.com
forextradingstrategies4u.com
Inspiration from @vdubus
Big Snapper's Bollinger OutsideIn Swing filter in Action:

SuperTrend Oscillator v3Version 3: Improved aesthetically, complete turnaround for the strategy with which to use this indicator.
Once again, thanks to BlindFreddy and ChrisMoody for the bits of code that were assembled into this indicator.
Make the chart yours using the share button for the indicator with barcolors functionality.
Changes from v2 and looking forward: Indicator now uses a 14 length SuperTrend with no ATR multiplier. This my preferred use and I'd be grateful to hear your case for a different length/multiplier. Removed the Bollinger Bands and retracement dots due to these being gimmicky and marginally useful. There may be a version 4 should a similar concept using a rate of change analysis turn out to be useful. I have also tried -in vain- to plot internal trend peaks as horizontal S/R levels. Please pm if you are willing to help in that respect.
Strategy: The indicator will display the trend as a red/green area. It measures the spread between the closing price and the SuperTrend line, much like a CCI (close and ma). When the area contracts warning bars of the opposite trend color will warn of a reversal. When this happens, these areas will either be defended, reviving the trend, or will break, causing a trend flip. SuperTrend is unique in that breaks are typically large candles, and that its levels, especially on Weekly, Daily, Hourly, Minute timeframes, these levels will be defended (think similar to a 200sma or a 21ema). The STO making new highs within (internal) a trend is an overextension sign.
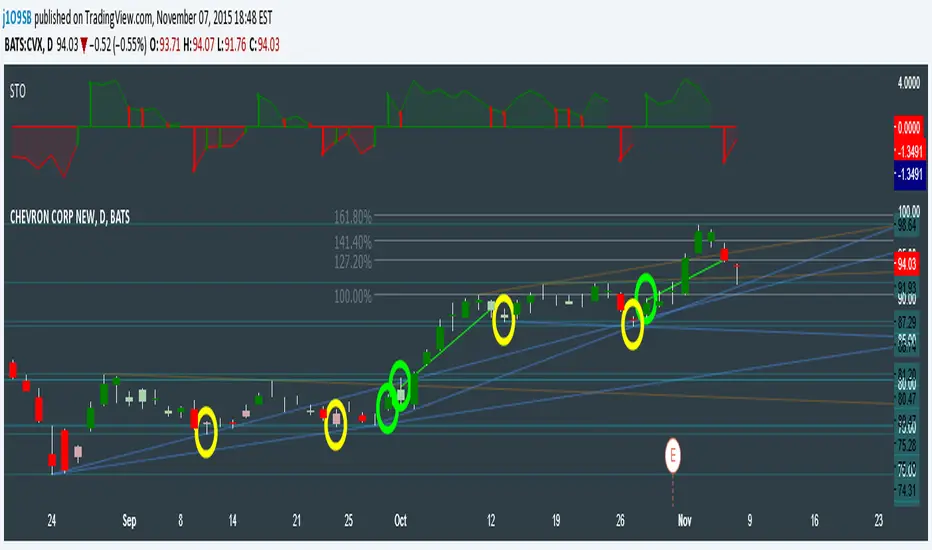
CVX Example: This is not a full analysis of CVX's stock , just an example potential trades. On the posted chart I used a weekly and a daily STO.
Long 1:The weekly showed warnings and then flipped. The daily made a double bottom, showed warnings and then flipped the daily STO at trendline support.
Long 2:The weekly still shows an uptrend, the daily made a weak break to downtrend and reversed back upwards at trendline support, forming a double bottom. Note the conservative exit when the STO made an internal new high.
Long 3: looking forward on CVX stock , the current downtrend made a weak break and is showing sings of reversal (pin bar) at horizontal support. Go long on flip of the daily (conservative) or flip of the hourly (aggressive).
SuperTrend OscillatorVersion 3: Improved aesthetically, complete turnaround for the strategy with which to use this indicator.
Once again, thanks to BlindFreddy and ChrisMoody for the bits of code that were assembled into this indicator.
Make the chart yours using the share button for the indicator with barcolors functionality.
Changes from v2 and looking forward: Indicator now uses a 14 length SuperTrend with no ATR multiplier. This my preferred use and I'd be grateful to hear your case for a different length/multiplier. Removed the Bollinger Bands and retracement dots due to these being gimmicky and marginally useful. There may be a version 4 should a similar concept using a rate of change analysis turn out to be useful. I have also tried -in vain- to plot internal trend peaks as horizontal S/R levels. Please pm if you are willing to help in that respect.
Strategy: The indicator will display the trend as a red/green area. It measures the spread between the closing price and the SuperTrend line, much like a CCI (close and ma). When the area contracts warning bars of the opposite trend color will warn of a reversal. When this happens, these areas will either be defended, reviving the trend, or will break, causing a trend flip. SuperTrend is unique in that breaks are typically large candles, and that its levels, especially on Weekly, Daily, Hourly, Minute timeframes, these levels will be defended (think similar to a 200sma or a 21ema). The STO making new highs within (internal) a trend is an overextension sign.
CVX Example: This is not a full analysis of CVX's stock, just an example potential trades. On the posted chart I used a weekly and a daily STO.
Long 1:The weekly showed warnings and then flipped. The daily made a double bottom, showed warnings and then flipped the daily STO at trendline support.
Long 2:The weekly still shows an uptrend, the daily made a weak break to downtrend and reversed back upwards at trendline support, forming a double bottom. Note the conservative exit when the STO made an internal new high.
Long 3: looking forward on CVX stock, the current downtrend made a weak break and is showing sings of reversal (pin bar) at horizontal support. Go long on flip of the daily (conservative) or flip of the hourly (aggressive).
