CryptoGraph MA DivergenceCryptoGraph MA Divergence is a multifunctional trading tool that identifies aspects of trend trading.
The indicator is based on moving averages, transformed into an oscillator. This way it becomes possible to get a better visualisation of MA's relative to each other, and more importantly, it enables us to spot divergences based on MA's.
This simply yet effective enhancement wasn't seen before as an oscillator, so I decided to make and share it.
Features of the indicator:
- Blue/Purple wave (Based on Moving Averages)
- White line (Average of Blue/Purple Wave)
- Green/Red Dots (Trend reversals)
- Red/Green lines (Wider red and green lines are regular divergences, thinner red and green lines are hidden divergences)
What to look for?
- A red or green dot may be a very early indication of a trend reversal, in times of consolidation they cluster together. Use other CryptoGraph indicators to filter these dot clusters.
- Blue/Purple wave crossing 0 line.
- Divergences. Divergences are automatically spotted in the indicator. HOWEVER, always try to find them manually, since the indicator won't be able to spot them all automatically.
For access contact me through TradingView or Discord.
Trendreversal

pNRTRLibrary "pNRTR"
Provides functions for calculating Nick Rypock Trailing Reverse (NRTR) trend values with higher precision offsets for both low, and high points rather than the standard single offset.
pnrtr(float low_offset = 0.2, float high_offset = 0.2, float value = close)
low_offset
Offset used for nrtr low_point calculations. Default is 0.2.
high_offset
Offset used for nrtr high_point calculations. Default is 0.2.
value
Variable used for nrtr point calculations. Default is close.

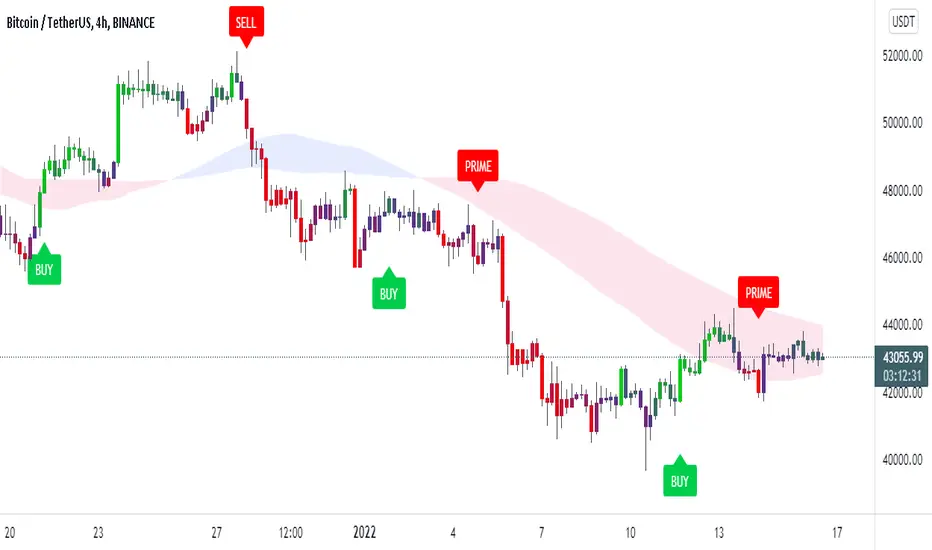
Trendorithm PrimeTrendorithm Prime is a toolkit made up of several different innovative indicators, designed by our team of developers. Get access now and create your own, unique trading strategies using our - all in one algorithm.
Our algorithm works in any market and focuses on finding the direction of the trends and remove noise from the price, for smooth understanding of the market.
Extra Confirmation
Using binomial distribution, the past values are processed to interpret the direction of trend.
After that, the signals are triggered based the volatility of the market,which is derived from the averages of candle size. All of these signals were optimised for each timeframe using timeframe multiplier.
Setting a lesser value on quotient adjusts the lookback length and volatility conditions, thus producing more number of signals that supports scalping trades. Higher the number in quotient, the frequency of trades reduce which helps the trader to hold trades for longer time.
Our Confirmation Signals helps to analyze the direction of trends for all markets and all timeframes, it boosts Trader’s confidence prior taking trades.
We made our Confirmation Signals flexible in order to suit any kind of trading style.
By adjusting the Quotient value in the settings, Traders can control the frequency of signals generated easily.
The Confirmation Signals includes a special type of signal called "Prime" which includes candle coloring to see the strength of the trend.
Our Candle-system is designed in 3 different colorings.
Green ( Bullish )
Red ( Bearish )
Purple (possible reversal or the possible formation of a new trend)
Trendo Cloud
The power of moving averages is always ultimate. This cloud made up of multiple moving averages acts as a dynamic support and resistance. The color and width of the cloud is used to find potential entry and exit points for trades.
Trend Catcher and Trend Chaser
The trend catcher is a trend-following indicator moves close to the price that aims to estimate the recent trend of price. It indicates green in uptrend and red in case of a downtrend.
The trend chaser is similar to the previous Trend Catcher, but it aims to chase long-term trends.
They are specially calculated from the highs and lows of price. Acts as a filter for confirmation signals and provides clarity for the direction of trend.
All of these functionalities tend to help users understand the market conditions as trending or ranging.
If you are using this script, you acknowledge that past performances are not indicative of future results and that there are a lot of factors required that go into being a profitable trader.
You can see the Author’s instructions below to get access to this prime indicator.
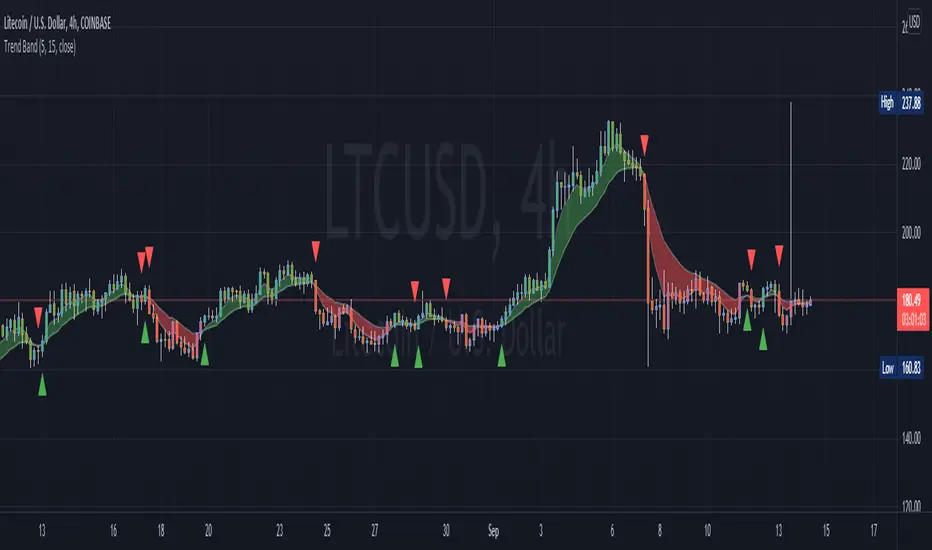
PBK Trend BandThis is providing a trend detection tool and a trend band display to identify possible trend reversal points using EMAs.
Some seem to like using 13 and 26.
I prefer 5 and 15, like PET-D from Steve Primo which react faster and avoid being kicked by some fast move (happens in crypto, see Litecoin...).
Trend ExplorerAre we in a bull or a bear market?
From the technical analysis point of view, the answer is "It depends". It depends from the parameters of your indicator, the timeframe of the pair you are looking and the volatility of that specific market you are looking to.
After I experimented with various trending indicators I decided to develop a framework that potentially could "embed" already existing logic from well known indicators (e.g. Supertrend OTT etc.).
The most important part is that I managed to abstract that logic away and experiment even further to produce some more robust, market and timeframe resolution agnostic results. While at the same time I was able to switch between market and timeframe resolution specific configuration to take some decision.
Finally, I decided to share this code with you folks! Developed this indicator "Trend Explorer" in an effort to make the aforementioned abstraction of all those trending indicators.
The goal is to enable the user to explore and combine different approaches in order to create a more robust and market general/specific, timeframe resolution invariant/fluctuating and volatility auto/manual adjusted indicator according to his needs.
The logic behind the abstraction is fairly simple. The trending indicator consists of two boundary lines the "bull trend low boundary" (green) and the "bear trend high boundary" (red). The indicator also has a control line (orange). Every time the control line crosses a boundary there is a trend reversal! The boundary lines are defined by the thresholds. To be more precise, boundaries are pulled upwards by thresholds (blue) during a bull market and downwards during a bear market. I challenge the user to experiment with the different ways of calculating the thresholds and the control. I am open to suggestions that might improve and extend the possibilities of this indicator. Any feedback, comments, general thoughts or bug reports are welcome.
Why did I chose those defaults?
For threshold calculation I chose MINMAX which calculates the local minimum and maximum using a sliding window. As far as I know it is not used in any existing trending indicator, but it seems reasonable for a trader to search for local min and max to make a decision. The width of the sliding window a.k.a the "period to remember" the local min and max is 30 days by default, just because I believe that for regular people it is a reasonable period of time to forget too.
Also, compared to the SUBADD method MINMAX does not seem to lag behind, especially when using averages in the SUBADD mode. Moreover, I consider MINMAX to be more general than the margins used by the SUBADD since margins should be configured based on the underlying market volatility.
For a source of min and max I chose the low and high values just because they are timeframe resolution invariant, meaning that they have the same (not exactly due to number precision and rounding, but very close) results for a single pair whether you use "4 hour" or "1 day" time interval! Another popular choice might be (close, close) since many traders wait for the daily candle to close in order to discard outliers. However, this approach is not resolution invariant and it depends from the time interval the user has selected.
Do you have any interesting trending indicator you would like to see how it performs in this framework logic? Let me know!
Do you have in mind any variation of Control or Thresholds calculation you would like to test? Please describe it in the comments below so I can add it in my implementation for you!
Did you find any other bug or you experienced any strange behavior? PM me with a description of the bug, the trading pair the timeframe resolution the exact time (candle) and all the necessary configurations for this indicator so I can reproduce it on my machine!
Please enjoy with caution,
Jason

Momentum Trading By Mahfuz AzimA following indicator is Momentum Trading that uses fast QQE crosses with Moving Averages
Use for trend direction filtering. QQE or Qualitative Quantitative Estimation is based
Relative strength index (RSI), but uses a smoothing technique as an additional transformation. Three crosses can be selected (all selected by default)

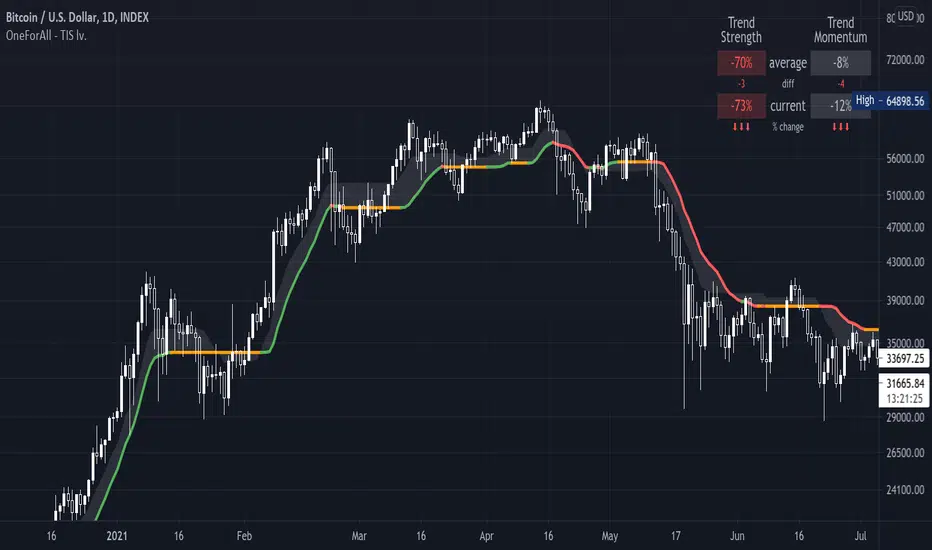
One For All - Trend Insight System (Light ver.)Introduction :
Compared to the TIS v1.0, this "light" version is simpler to use and to understand, hence it will suits the basic needs of traders and investors looking for a clear and user friendly indicator to assess the current trend situation for continuous markets. The settings allow an adaptation for call markets, but more backtesting needed at your discretion (see notes below on call markets).
The TIS takes price action, volume and volatility, to :
- provide a clear and easy to interpret global picture on the current trend siuations
- give hints for decent take profit and exit points
- help find support and resistance levels
- assess trend strength and momentum
Disclaimer :
The Trend Insight System (TIS) is among the most perfected trend following indicator. Built around the Verbatim (the main colored line), it is inspired by Tushar S. Chande's work on volatility, that I really enjoyed reworking in-depth and re-engineer from scratch, after some tweaks and managing to factor-in the volumes, the Verbatim was born.
The Verbatim is essentially a "smart" moving average that will adapt itself to the price action, the volatility and the volumes, in order to filter-out whipsaw price action and help the user clarify opportunities for trend trading. Since the various components of the TIS helps serve as Support & Resistance level (see examples below), it will also prove to be helpful for swing traders.
Please use with caution, proper risk management and along with your favorite oscillator, channels, candlestick reading and signals system (such as the Pattern Detection System that will be provided complimentary to the TIS, in a separate script).
Some explanation :
Verbatim line :
- Green shows a bullish trend, orange for consolidation and red for bearish trend
- When it consolidates, it can be extended to the right to be used as a Support & Resistance line
example use case :
In summary :
- A possible entry is when price action confirms over the consolidating (orange) Verbatim, or after the Verbatim turns green. Please note that they both can prove to be false trend start, so these signals are best used with other indicators for confirmation
- A possible exit point show up when the price action starts closing into the Verbatim, or even safer, when the price action confirms under the verbatim, again, to be used with other indicators on the side
Trend Strength and Momentum:
- Read the current status at a glance
- Trend strength is the relative position of each trend lines (most of which are hidden on this "light" version), from -100% (=bear power) to +100% (=bull power)
- Momentum is measuring the slope of the Verbatim (and another hidden "smart" trend line) also from -100% to +100%; trend lines pointing downwards = bears waking up / in force, horizontal = consolidation or upwards = bulls waking up/in force
Important notes :
While is a very powerful yet easy to read Technical Analysis tool, it has been fully optimized for continuous markets such as crypto.
It is highly advised to use the default settings provided as they have been backtested more thoroughly ("continuous market" and "close" input)
To prevent confusing casual users and to avoid overoptimization -risky at best and counter productive at worst, according to legendary traders such as Mark Douglas- this version has most of the customization settings locked out; volume integration, smoothing method used, smoothing constant, volatility setting, period of study. The settings left available are :
- continuous market / call market selection, selecting "continuous maket" will use a specifically designed method of calculation for volatility , based on ATR, while selecting "call market" will automatically use ATR for calculating the volatility , and
- input source selection for the volatility calculation, which only works for "continuous market".
The locked out settings might be included in the future in a more restricted yet complete "Expert mode" version.
End notes :
It will always be considered a work in progress to help bring out the best of trend analysis.
Suggestions are welcomed to make it a more user-friendly tool.
One For All - Trend Insight System v1.0Introduction :
The TIS takes price action, volume and volatility, to :
- provite a clear and easy to interpret global picture on the current trend siuations
- give hints for good take profit and exit points (see local consolidation line)
- help find support and resistance levels
- assess trend strength and momentum
Disclaimer :
The Trend Insight System (TIS) is among the most perfected trend following indicator. Built around the Verbatim (the main colored line), it is inspired by Tushar S. Chande's work on volatility, that I really enjoyed reworking in-depth and re-engineer from scratch, after some tweaks and managing to factor-in the volumes, the Verbatim was born.
The Verbatim is essentially a "smart" moving average that will adapt itself to the price action, the volatility and the volumes, in order to filter-out whipsaw price action and help the user clarify opportunities for trend trading. Since the various components of the TIS helps serve as Support & Resistance level (see examples below), it will also prove to be helpful for swing traders.
Please use with caution, proper risk management and along with your favorite oscillator, channels, candlestick reading and signals system (such as the Pattern Detection System that will be provided complimentary to the TIS, in a separate script).
Some explanation :
Verbatim line :
- Green is bullish trend, orange for consolidation and red for bearish trend
- When it consolidates, it and be extended to the right to be used as a Support & Resistance line
example use case :
Local consolidation line :
- A more optimal way to find an exit point when we have missed a top formation
example use case :
Verbatim channel :
- A way to visualize price disequilibrium
example use case:
Verbatim cloud:
- Stronger Support and Resistance levels
- Price disequilibrium
- Consolidation range (when Verbatim is inside the cloud and did not go through)
example use case:
Trend Strength and Momentum:
- Read the current status at a glance
- Trend strength is the relative position of each trend lines, from -100% (=bear power) to +100% (=bull power)
- Momentum is measuring their slope also from -100% to +100%; trend lines pointing downwards = bears waking up / in force, horizontal = consolidation or upwards = bulls waking up/in force
Important notes :
While is a very powerful yet easy to read Technical Analysis tool, it has been fully optimized for continuous markets such as crypto.
Each item of the Trend Insigth System can be disabled to suit your personal use. It is highly advised to use the default settings provided.
To prevent confusing casual users and to avoid overoptimization -risky at best and counter productive at worst, according to legendary traders such as Mark Douglas- this version has most of the customization settings locked out; volume integration, smoothing method used, smoothing constant, volatility setting, period of study. The settings left available are :
- continuous market / call market selection, selecting "continuous maket" will use a specifically designed method of calculation for volatility, based on ATR, while selecting "call market" will automatically use ATR for calculating the volatility, and
- input source selection for the volatility calculation, which only works for "continuous market".
The locked out settings might be included in the future in a more restricted yet complete "Expert mode" version.
End notes :
It will always be considered a work in progress to help bring out the best of trend analysis.
Suggestions are welcomed to make it a more user-friendly tool.

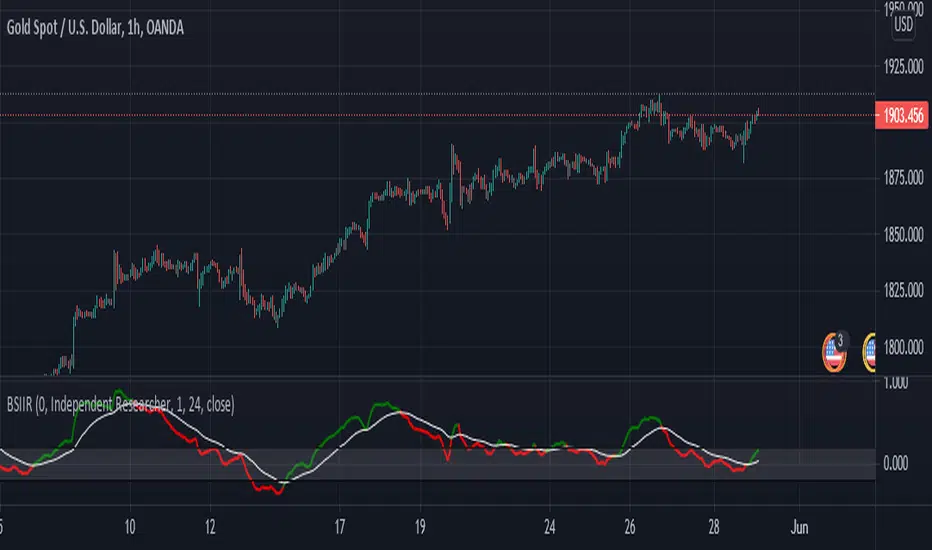
Buy Sell Indicator by Independent ResearcherThis is an Buy and Sell Oscillator. Its show the trend reversal or change in price action of the market. This indicator is a combination of various moving averages. This is like a MACD but a very powerful version.
How To Use It
If green line gives crossover white line towards down then price is expected to fall.
If red line gives crossover white line towards up then price is expected to rise.
For better results of indicator trade after closing of crossover candle.
There is a band +.20 to -.20 for better results trade on crossover happens between that band.
Below you will see an example:-
XAUUSD
EURUSD
EE-Hunter-Strategy v1.EE-Hunter Strateji is one of the most common ATR based trailing stop indicators.
Default method is RMA, when the alternative method is SMA . In this version you can change the ATR calculation method from the settings.
The indicator is easy to use and gives an accurate reading about an ongoing trend. It is constructed with two parameters, namely period and multiplier. The default values used while constructing a super indicator are 10 for average true range or trading period and three for its multiplier.
The average true range (ATR) plays an important role in 'EE-Hunter Strategy' as the indicator uses ATR to calculate its value. The ATR indicator signals the degree of price volatility .
The buy and sell signals are generated when the indicator starts plotting either on top of the closing price or below the closing price. A buy signal is generated when the 'EE-Hunter Strategy' closes above the price and a sell signal is generated when it closes below the closing price.
It also suggests that the trend is shifting from descending mode to ascending mode. Contrary to this, when a 'EE-Hunter Strategy' closes above the price, it generates a sell signal as the colour of the indicator changes into red.
A 'EE-Hunter Strategy' indicator can be used on equities, futures or forex, or even crypto markets and also on daily, weekly and hourly charts as well, but generally, it fails in a sideways-moving market.
Good lucks, best regards.

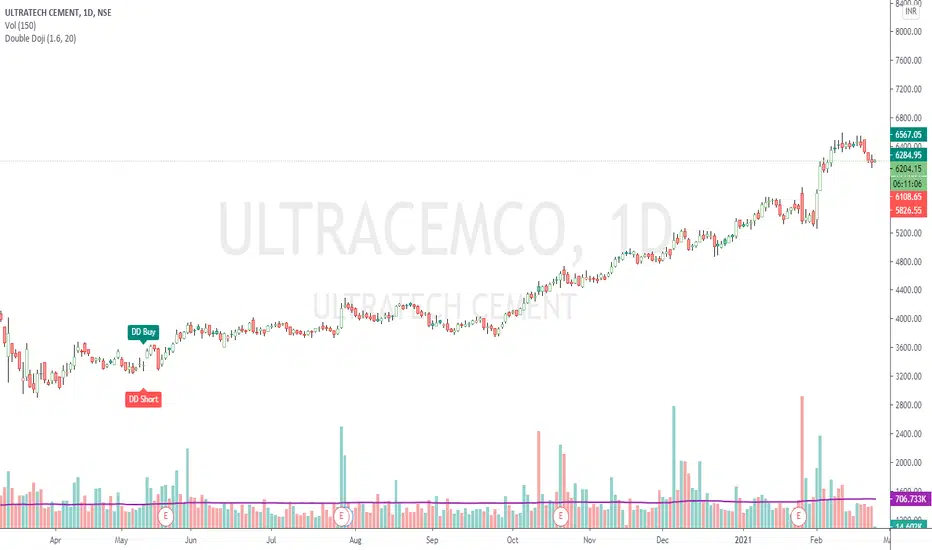
Double DojiStrategy Kiss = 'Keep It Simple, Stupid' or 'Keep It Simple, Smart'
The script simply identifies 2 consecutive Doji candles, and calculates Target on both the sides for given Reward : Risk factor.
The High-Low to Open-Close ratio is set to default value 20. The Reward : Risk ratio is of default value 2.
Both can be set to values of your choice.
Accuracy best on Daily chart. Can be tried on any timeframe though.
Trading Rules: Buy at higher / Short at lower of the 2 candles, with other as Stop Loss.
If a Stop Loss is hit, go for reverse trade. If again a SL is hit, switch to other instrument.
Important: If trading in Futures and target is achieved, hedge the position by buying an option (subject to liquidity).
Reason is, the trend may condition to any extent and you would definitely not want to miss out the whole action.
Check the shared example. For a risk to 175 points, reward is 2200+ points (more than 12.5 times).
DBT MoMo Divergence FinderThis Indicator is an experimental Divergence Finder using the DBT MoMo formula. See DBT MoMo v.4 for details on the main script.
It uses a slower version of the DBT MoMo Price Line to smooth out the trend and color codes the Price Line based on its trend.
Bullish Divergence is denoted by Blue Labels below the Price Line.
Bearish Divergence is denoted by Orange Labels above the Price Line.
Alerts can be setup in Tradingview for both Bullish and Bearish Divergence Signals.
This indicator is brand new and experimental, make sure to double check the Divergence Alerts before blindly trading them. There can be a mathematical divergence without there being a visual divergence, this will trigger a false alert.
Everyone with access to the DBT MoMo will have access to this indicator as well.
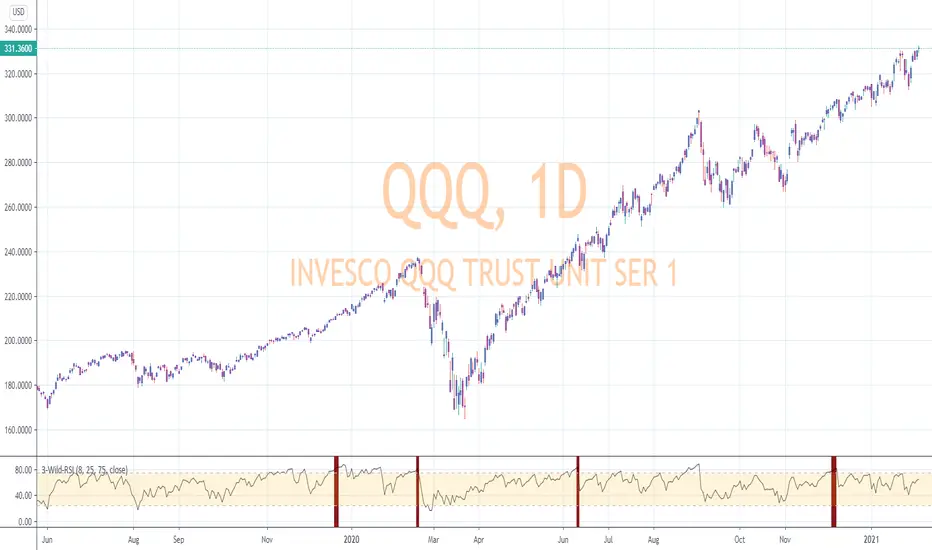
RSI-Last-3-ExtremaThis script indicates when the current Relative Strength Index of the last 8 closes is beyond a level from center oscillation which signals the equity is likely to reverse course. When it is the lowest RSI reading of the prior 3 readings and below 25, a green vertical bar will appear signaling a potential BUY point. Likewise, the highest reading of the prior 3 RSI readings and above 75 will signal a vertical red bar or SELL signal. The bar has to have a final close price for the signal to be active. Reversal could take a few more bars to occur depending on the timeframe and equity symbol.
You will be able to find many charts that have this signal perfectly finding the top or bottom of a significant trend.
It successfully indicates profitable reversal around 80% of the time. So far, It is 85% accurate or better in determining downtrend start points on the Daily, 120, 60, 30 Minute charts according to the study of more than 10,000 occurrences. It is 86% accurate on the 30 Minute chart.
This is another tool I use in finding or confirming potential price action. Hope you find it useful.
To add this, favorite the script by clicking "Add to your Favorite Indicators" at the top of the code portion below. On your top tool bar is an "fx" button with a downward arrow to the right of it. Click on the downward arrow/caret and scroll down to "RSI-Last-3-Extrema". Click on this title and it should add to the bottom of your current chart. If you do not see BUY (green vertical bars) or SELL (red vertical bars) right away, try other charts and timeframes.
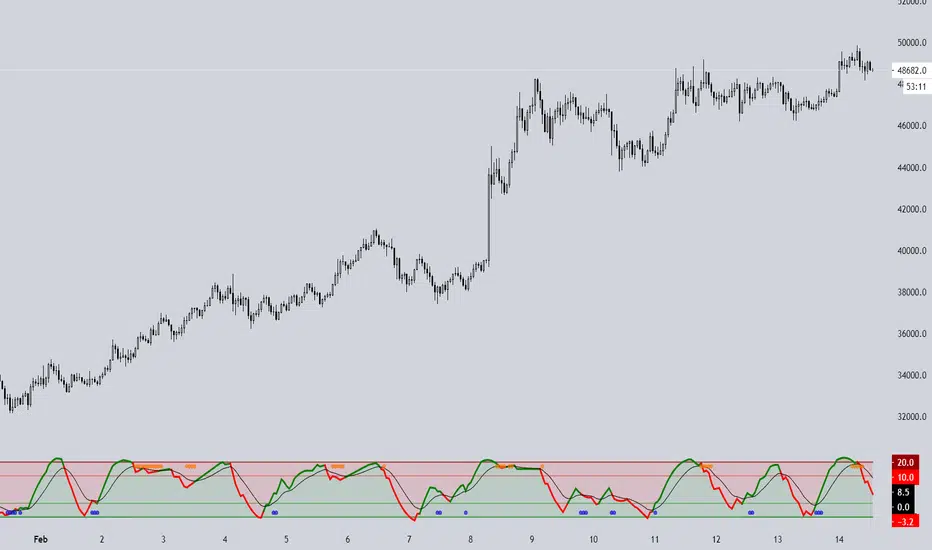
[astropark] Trend Skywalker V1 [alarms]Dear Followers,
today another awesome Swing and Scalping Trading Strategy indicator: Trend Skywalker !
It shows a trend cloud that reacts very fast to price action, so it's perfect for trending markets: it helps a lot to find out
when a trend is going to end and a new is going to start
when to enter again within a trending market
where to put your stoploss
In this example below you can see the three points above:
In fact in a trending market it will highlight that:
price consolidation within the could is a trend weakening signal , so you can easily spot when a trend is going to end and a new is going to start
bullish/bearish trend cloud retests are nice opportunity to re-enter within a trending market, especially if cloud is thick
where to put your stoploss ( below the cloud and/or recent low in a buy scenario , above the cloud and/or recent high in a sell scenario )
This strategy/indicator has the following options:
change analysis window (the lower, the more reactive; the higher, the less reactive)
enable/disable signals on chart
enable/disable "more confirmations" signals filter
enable/disable bars and background coloring based on trend
enable/disable an automatic Trailing Stop strategy option (Automatic Stops)
enable/disable a peak profit tracker (the max percentage profit labels)
enable/disable highlights of trend cloud retests
enable/disable highlights of trend cloud price breakouts
Here below some examples how the indicator works on many markets and timeframe.
ETH/USD 4h
EUR/USD 15m
LTC/BTC 1h
This strategy only trigger 1 buy (where to start a long trade) or 1 sell (for short trade).
Keep in mind that proper risk management and money management strategies are very important to manage your trades (DM me if you need any clarification on these points).
This script will let you set all notifications you may need in order to be alerted on each triggered signals.
The one for backtesting purpose can be found by searching for the astropark's "Trend Skywalker" and then choosing the indicator with "strategy" suffix in the name, or you can find here below:
This is a premium indicator , so send me a private message in order to get access to this script.

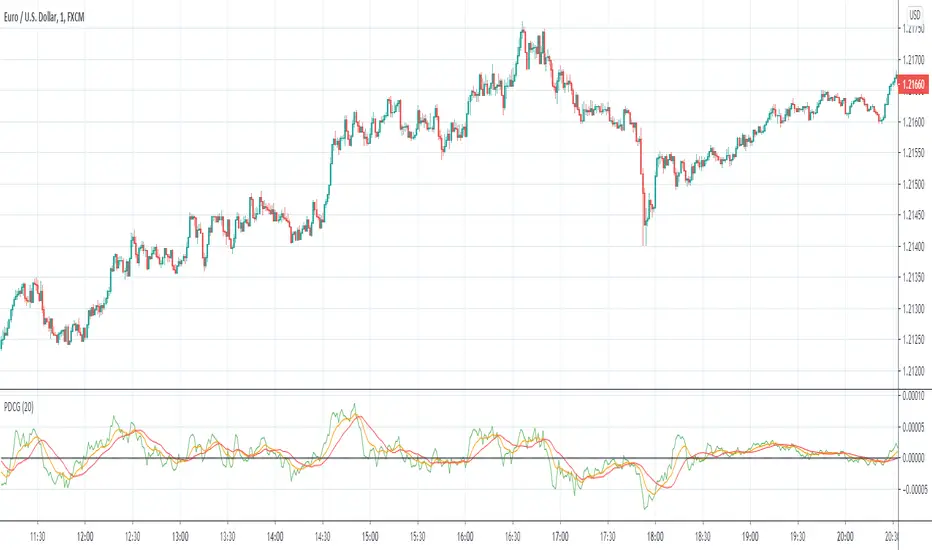
Course Gradient IndicatorNames:
"Course Gradient Indicator" or
"Punctual Deviaton of Course Gradient Indicator" or shortly
"PDCG Indicator"
Description:
I developed this Indicator to identify potential changes in the course gradient (aka slope of course). If you want to know what kind of mathmatical operations where used for this, look at the source code below
Usage:
Generally, i would say that the "SMA of Gradient" crossing above both the "MAG Smooth" and the "Indication" lines (sorry for the bad names btw. If you have better ideas for easier names, tell me) is a good indication for a rising course. Therefore - dichotomous - when it crosses below both other lines, it might be an indication for a falling course.
Please go ahead and experiment with this indicator.
Let me know what you think :)
Trend Reversal Indicator (EMA of slopes)Good morning Traders
Inspirated by lukescream EMA-slope strategy, today I want to share with you this simple indicator whose possible use-case would be for detecting in advance possible trend reversals, specially on higher timeframes.
Once that you've chosen the desired source (RSI, EMA or Stochastic k or d), the indicator will calculate its "slope" approximating its first order derivative by the division between the last variation of the series and its last value.
You can see the slope as a white line by enabling the relative checkmark (it's disabled by default since it simply messes up the the graph)
Then, the slope itself becomes the source for two exponential moving averages: the fast one (in blue) has a period of 20 while the slow one (in red, it becomes similiar to a horizontal line actually) has a period of 500
Why the slope? Since all the sources mentioned before are directly or indirectly calculated on the price action, a more aggressiveness in the price movement would be translated into a more (positive/negative) steepness of those indicator (of course this effect would be far more evident if the indicators are calculated on low periods, but really low periods could compromise the consistency of the signals).
In this way, the slope would mirror the decisiveness of price movements and a comparison between two averages calculated from it (the first one based on more recent values, the second one that conisders also older values) could tell you in advance what direction the market is possibly about to take
The usage is simple: once that the fast moving average crosses upward the slow one, this could be a sign of potential trend reversal from bearish to bullish. On the contrary, if the fast EMA crosses downward the slow one, this could be a sign of potential trend reversal from bullish to bearish.
What I suggest you is to integrate this indicator with Exponential Moving Averages plotted on the price candles, in order to have a general bias for opening long or short positions, and with an oscillator as well such as the Stochastisc RSI in order to detect the overbought/oversold zones for opening/closing positions at the right moment.
Happy Trading!

Breakout & Trend & Scalping (Zeiierman)█ Overview
Breakout & Trend & Scalping (Zeiierman) transforms time, volume, and trend behavior into a unified visual framework for identifying market expansion, compression, and breakout phases. Instead of viewing price as an isolated movement, the indicator reinterprets it as a continuous relationship between time-driven flow, volume displacement, and trend momentum.
The system constructs a hybrid analytical field using OBV-based flow modeling, time–trend alignment, and adaptive candle smoothing, providing a clear and fluid representation of both breakout probability and structural trend strength.
This advanced framework adapts to different market contexts, including intraday scalping, swing-trend validation, and multi-timeframe continuation analysis, revealing how volume and trend energy accumulate before volatility expansion.
⚪ Why This One Is Unique
Unlike conventional breakout or trend indicators that rely solely on price or volatility, this tool integrates time-weighted OBV mechanics, multi-timeframe trend correlation, and volatility-normalized candle transformation.
Its design leverages an adaptive Time–Trend Integration Engine that adjusts dynamically based on the selected timeframe and method. The result is a fluid, self-normalizing view of market rhythm, capturing not only the visible structure of trends but also the hidden buildup of momentum that precedes breakouts.
█ Main Feature: BTS Adaptive Candle System
The BTS Adaptive Candle System unifies time-based and trend-based flow analysis into a single visual model of market behavior. It synchronizes short-term momentum with long-term trend equilibrium, revealing how volume and directional energy evolve across different temporal structures.
The flow is inherently adaptive. During stable phases, it compresses volatility to emphasize directional persistence and trend continuity. When acceleration builds, it expands to highlight breakout potential and the ignition of new momentum.
Green-to-red and (red-to-green) transitions indicate shifts in order-flow dominance, while color intensity reflects the relative strength of participation. The built-in smoothing system filters out random noise while maintaining fast response to emerging direction, making the BTS Candle System equally effective for scalping precision, breakout confirmation, and long-term trend tracking.
█ How to Use
⚪ Trend Trading
Bullish trends appear when candles remain near the top of their range with bright, steady coloration. This structure shows sustained accumulation and consistent trend support. Fading color or mixed tones suggest short pauses or shallow pullbacks within an ongoing uptrend.
Bearish trends form when candles cluster near the lower range and deepen in red intensity, reflecting growing selling pressure. Consistent red sequences mark continued distribution, while lighter tones or brief color shifts often precede corrective bounces within a broader downtrend.
⚪ Trend Change Trading
When a large BTS candle crosses the midline, it often marks a decisive shift in market control. A strong candle breaking above the midline reflects dominant buying flow and the early phase of bullish momentum, often signaling the start of a new upward trend.
Conversely, when a large candle drops below the midline, it shows dominant selling pressure and the potential beginning of a downward cycle.
These midline transitions represent key moments where institutional flow changes direction. A rapid color shift or fading saturation in candles around these areas frequently precedes a trend reversal or volatility breakout, making them powerful confirmation points for both breakout and trend-change strategies.
⚪ Retracement/Pullback Trading
When BTS candles remain green or turn light yellow near the midline, it indicates balanced momentum as price consolidates during a temporary retracement. A renewed shift back to bright green candles from this area often signals the end of the pullback and the continuation of the uptrend.
In a downtrend, when BTS candles shift to light yellow or fade toward the midline, it shows a temporary slowdown in selling pressure as the price retraces upward. A return to deep red candles after this brief balance phase confirms renewed selling momentum and continuation of the prevailing downtrend.
⚪ Breakout Trading
Big candles in the BTS indicate a shift in control. If this occurs around a resistance level, there is a high chance that price will break out upward.
Similarly, if a large downward BTS candle appears near a support level, there is a high chance that a bearish breakout will follow through.
█ How It Works
⚪ Integrated Market Framework
The BTS system merges time, trend, and volatility behavior into a single adaptive flow field. It constantly balances fast and slow market components, maintaining a smooth equilibrium between short-term reactions and long-term structure.
Calculation: Uses normalized scaling and adaptive synchronization to align directional momentum across changing market states.
⚪ Core Trend Engine
At its center, the model interprets how price movement evolves within its volatility range. It tracks shifts in directional energy and transforms them into a stable momentum surface that highlights both trend continuation and turning points.
Calculation: Applies equilibrium-based mapping to sustain consistent directional flow even during market acceleration or compression.
⚪ Volatility Envelope System
The indicator forms a dynamic envelope around price movement, expanding and contracting with the current market speed. These zones reflect where energy concentrates or fades, helping visualize breakout potential and exhaustion levels.
Calculation: Adapts envelope boundaries through volatility-responsive scaling and balanced symmetry control.
⚪ Adaptive Time Modes
Two adaptive modes — Time and Trend — control how the model responds to changing conditions. The system automatically adjusts its responsiveness, allowing it to behave as a fast scalping model or a slow trend tracker without losing structural balance.
Calculation: Dynamically modifies its internal scaling to maintain equilibrium between speed and smoothness across selected timeframes.
-----------------
Disclaimer
The content provided in my scripts, indicators, ideas, algorithms, and systems is for educational and informational purposes only. It does not constitute financial advice, investment recommendations, or a solicitation to buy or sell any financial instruments. I will not accept liability for any loss or damage, including without limitation any loss of profit, which may arise directly or indirectly from the use of or reliance on such information.
All investments involve risk, and the past performance of a security, industry, sector, market, financial product, trading strategy, backtest, or individual's trading does not guarantee future results or returns. Investors are fully responsible for any investment decisions they make. Such decisions should be based solely on an evaluation of their financial circumstances, investment objectives, risk tolerance, and liquidity needs.
유료 스크립트

Trend Stability (Expo)
Trend Stability (Expo) is a multifunctional trend trading tool that identifies all aspects of trend trading. The indicator helps traders to stay on the right side of the market, identify retracements, reversals, and trend strength. In addition to that, we have added momentum - moves for traders that want to do trend scalping. The candle coloring displays the current trend and gives early signs of trend reversals and retracements.
➤ All in one trading tool that filters out noise and leaves us with insights that matter.
Real-Time with Alerts
No Repainting
Works on any market and in any timeframe
HOW TO USE
Use the indicator to gain insights into all aspects of trend trading:
Trend Stability/equilibrium
Trend Strength
Trend Retracements
Trend Reversals
Trend Filter
Momentum Moves
INDICATOR IN ACTION
4-hour chart
The setting used on the chart below displays negative momentum-moves with a noise-free positive trend.
I hope you find this indicator useful , and please comment or contact me if you like the script or have any questions/suggestions for future improvements. Thanks!
I will continually work on this indicator, so please share your experience and feedback as it will enable me to make even better improvements. Thanks to everyone that has already contacted me regarding my scripts. Your feedback is valuable for future developments!
-----------------
Disclaimer
Copyright by Zeiierman.
The information contained in my scripts/indicators/ideas does not constitute financial advice or a solicitation to buy or sell any securities of any type. I will not accept liability for any loss or damage, including without limitation any loss of profit, which may arise directly or indirectly from the use of or reliance on such information.
All investments involve risk, and the past performance of a security, industry, sector, market, financial product, trading strategy, or individual’s trading does not guarantee future results or returns. Investors are fully responsible for any investment decisions they make. Such decisions should be based solely on an evaluation of their financial circumstances, investment objectives, risk tolerance, and liquidity needs.
My scripts/indicators/strategies/ideas are only for educational purposes!
ACCESS THE INDICATOR
• Contact me on TradingView or use the links below

Linear Regression ChannelHello Traders,
There are several nice Linear Regression Channel scripts in the Public Library. and I tried to make one with some extra features too. This one can check if the Price breaks the channel and it shows where is was broken. Also it checks the momentum of the channel and shows it's increasing/decreasing/equal in a label, shape of the label also changes. The line colors change according to direction.
using the options, you can;
- Set the Source (Close, HL2 etc)
- Set the Channel length
- Set Deviation
- Change Up/Down Line colors
- Show/hide broken channels
- Change line width
meaning of arrows:
⇑ : Uptrend and moment incresing
⇗ : Uptrend and moment decreasing
⇓ : Downtrend and moment incresing
⇘ : Downtrend and moment decreasing
⇒ : No trend
An example for how color of lines, arrow direction and shape of label change.
Enjoy!

Fishing The TrendFishing The Trend
HOW Does it work ? The code uses dynamic levels to identify trend.
This script used SuperTrend (ST), ATR and relatively Smoothened ST for early trend reversal detection to determine the trend and direction so that a fruitful decision can be made.
To Indicate the strength of the trendline, The standard calculations of SuperTrend, along with multiple smoothen ATR results are clubbed determine the direction, a step ahead.
However, the indicator is not appropriate for all the situations. It works when the market is trending. Hence it is best to use for short-term technical analysis . SuperTrend uses only the two parameters of ATR and multiplier which are not sufficient under certain conditions to predict the accurate direction of the market. Here in this indicator ATR value is not editable and after long backtests the best ATR value is kept that helps the indicator working very well.
The default setting is best for use, but user can customize the Multiplier for his own fine tunings, So once the Levels are matched, a Long / Short suggestion is plotted.
Best Time Frames to use : starting from 1, 3, 5, 15, 30 Mins and so on... to determine Trend.
Long = L and Short = S.
Where and how to use?
The main use of this indicator is quick scalping and Intra-day trading.
The Indicator shows the option to show Long/Short Signals which the use can be turned on or off.
The indicator shows a very useful option for early detection of the ongoing trend whether there will be reversal of trend or not ?
Stop Loss - That should be done by following ones risk appetite, Ideally the High of the Previous Candle should be the stop loss for the Long / Short but everyone has their own Risk Management Strategies based on the capital deployed.
Disclaimer : There could be scenarios when the candle is shown as a long or short and then the candle turns into opposite direction red/green. In such scenarios , Please refer to the just preceding candle and the early detection signal and if this candle is moving into positive direction only then go for long, Similarly opposite for Short, the value of multiplier 0.5 is determined using series of back test across various assets with different time frames.
User Options : Choice of turning on / off the Long / Short Labels and early detection/StopLoss Option can also be activated or deactivated.
Visual Checks - The user could manually validate the back test results on various assets they would like to use this strategy on before putting it live.
Usage/Markets : Index Trading / Equities and also well with Commodities and Currencies
How to get access
Please click on the link / email in the signature or send me a private message to get access
Feedback
Please click on the link/email in the signature or send me a private message for suggestions/feedbacks
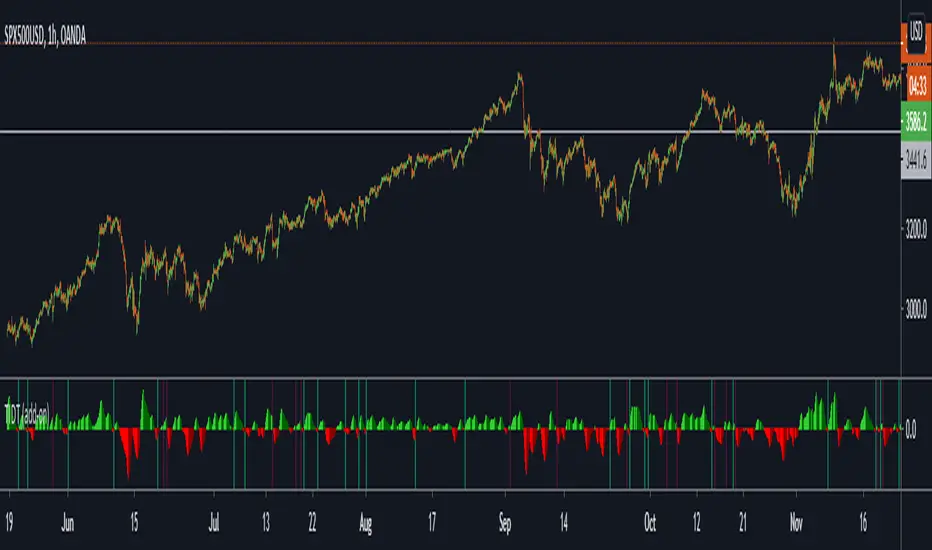
Trend Indicator for Directional Trading (add-on)TIDT is a two-part trend-based indicator designed to recognize the general direction and help you identify good opportunities for going long or short (both indicators are called the same way with "main" and "add-on" additions).
This is the add-on indicator that is added below the chart and aside from identifying trending opportunities, it also shows Bullish and Bearish Divergences. Similar to the main indicator, it is based on 3 Moving Averages over which you have full control. You can choose between the following 7 types:
- Simple Moving Average ( SMA )
- Exponential Moving Average ( EMA )
- Weighted Moving Average ( WMA )
- Running Moving Average (RMA)
- Hull Moving Average ( HMA )
- Volume Weighted Moving Average ( VWMA )
- Arnaud Legoux Moving Average ( ALMA )
I strongly suggest that the types and periods for your MAs in the main and the add-on versions are identical so that you get a better visual of the whole picture. However, you may develop a trading strategy that relies on two different types of signals, so that's entirely up to you. Once you have set up the MAs and chosen the lookback period, the rest is taken care of for you. You get two types of signals:
1) Pullbacks - the divergences between your MAs generate a result, which is then averaged as a percentage gain or loss and worked out into a histogram. The colors of the histogram indicate opportunities to buy (if green), short (if red), or sit tight (if white) unless an explicit signal is given by the indicator. Overall the principle is simple - establish the trend and look for weaknesses so that you can open an order in the direction of the trend.
2) Divergences - generated in a similar way to the Pullbacks strategy with some minor adjustments and improvements to better catch the divergences. The histogram is slightly different, as the positive results are plotted above 0 and the negative ones below 0. As such, the histogram looks a lot like MACD, but with different calculations. The color principle mentioned above is the same - green for longs, red for shorts, and white for neutral unless specified by a signal. The change of the shade of the color shows an increase or a decrease in the momentum. A Long signal comes up when the price makes a lower low, while the momentum makes a higher low. A Short signal comes up when the price makes a higher high, but the momentum makes a lower high.
Ticking a box next to the signal type will show the associated histogram and its signals. Due to the different ways those two histograms are calculated and displayed I recommend having either of them On, but not both. However, you may want to be able to see both types of signals, so I've left this as an option. Once again, all colors are fully configurable.
The complete Trend Indicator for Directional Trading has gone over 1,500 revisions, has been forked over 10 times, and has been worked out to be as minimalistic, useful, and practical as possible. A great deal of work, time, and experience have been poured into this indicator to do what it's supposed to do - help you identify better entry opportunities for increased profitability.
If you have any questions regarding the indicator or suggestions on how it could be improved, please let me know. Thank you.
Fractals (Expo)
Fractals (Expo) make use of fractals to identify trends and reversals. The indicator is designed to adapt smoothly and quickly to significant price moves in order to identify trend reversals as well as filtering out noise in an established trend. The indicator is simple to use and understand therefore valuable to all trading styles.
The user has the ability to enable a custom input source which gives the user great flexibility and full control over what the calculations should be based on. The default input source is fractals from the swing points of the market.
Real-Time Trend Alerts
No Repainting
Works on any market and in any timeframe
HOW TO USE
Use the indicator to gain insights into trends and trend reversals.
Identify Trends
Identify Trend reversals
Use it as a Trend filter
INDICATOR IN ACTION
Daily Chart
I hope you find this indicator useful , and please comment or contact me if you like the script or have any questions/suggestions for future improvements. Thanks!
I will continually work on this indicator, so please share your experience and feedback as it will enable me to make even better improvements. Thanks to everyone that has already contacted me regarding my scripts. Your feedback is valuable for future developments!
-----------------
Disclaimer
Copyright by Zeiierman.
The information contained in my scripts/indicators/ideas does not constitute financial advice or a solicitation to buy or sell any securities of any type. I will not accept liability for any loss or damage, including without limitation any loss of profit, which may arise directly or indirectly from the use of or reliance on such information.
All investments involve risk, and the past performance of a security, industry, sector, market, financial product, trading strategy, or individual’s trading does not guarantee future results or returns. Investors are fully responsible for any investment decisions they make. Such decisions should be based solely on an evaluation of their financial circumstances, investment objectives, risk tolerance, and liquidity needs.
My scripts/indicators/strategies/ideas are only for educational purposes!
ACCESS THE INDICATOR
• Contact me on TradingView or use the links below

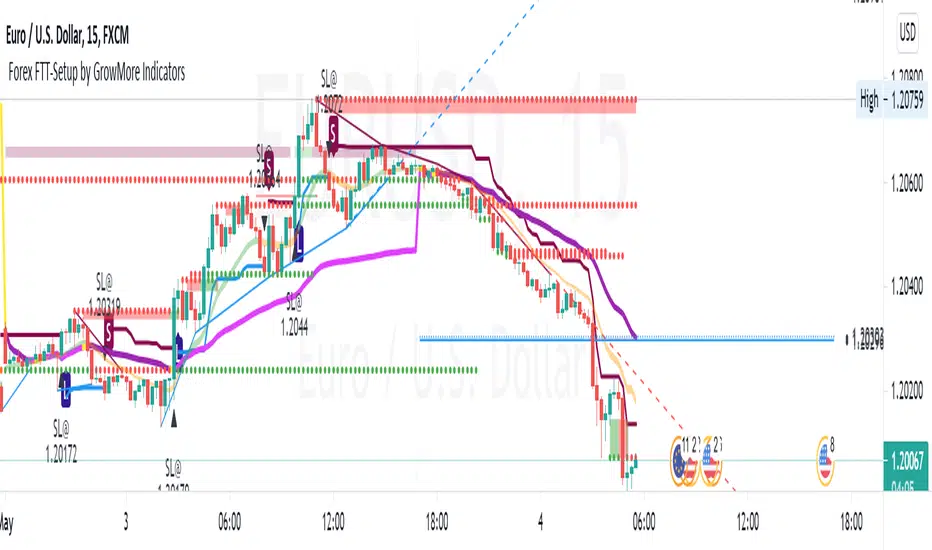
Buy & Sell Order (Expo)
Buy/Sell Order (Expo) is a unique and important indicator that provides information about Buy & Sell order patterns. The indicator helps to identify real-time large Buy & Sell Orders that have a significant impact on the price. These buy and sell orders can be the start of a trend move or a sign of reversal.
The indicator is divided into a Sell-side (red zone) and a Buy-side (green zone) in order to highlight the different order flows. Greater candlesticks mean significant buy/sell orders! These are the ones we want to keep track of.
The price levels where a large Buy or Sell order occurs at should be considered as key levels. These key- levels are often re-tested in the future. Traders should keep track of them.
Real-Time
No Repainting
Works on any market and in any timeframe
HOW TO USE
Identify Large Buy / Sell Order
Identify potential trend move
Identify potential reversal
INDICATOR IN ACTION
1-hour chart
I hope you find this indicator useful , and please comment or contact me if you like the script or have any questions/suggestions for future improvements. Thanks!
I will continually work on this indicator, so please share your experience and feedback as it will enable me to make even better improvements. Thanks to everyone that has already contacted me regarding my scripts. Your feedback is valuable for future developments!
-----------------
Disclaimer
Copyright by Zeiierman.
The information contained in my scripts/indicators/ideas does not constitute financial advice or a solicitation to buy or sell any securities of any type. I will not accept liability for any loss or damage, including without limitation any loss of profit, which may arise directly or indirectly from the use of or reliance on such information.
All investments involve risk, and the past performance of a security, industry, sector, market, financial product, trading strategy, or individual’s trading does not guarantee future results or returns. Investors are fully responsible for any investment decisions they make. Such decisions should be based solely on an evaluation of their financial circumstances, investment objectives, risk tolerance, and liquidity needs.
My scripts/indicators/strategies/ideas are only for educational purposes!
ACCESS THE INDICATOR
• Contact me on TradingView or use the links below
