CPR by Anand with PDL/PDH & Breakouts 15/30 minsThis is an enhanced version of CPR by Anand with Configurable previous day high and low and option to configure breakout lines of 15 and 30 mins.
Will be an useful tool for day traders who follows CPR tricks and breakouts.
하이-로우 인덱스

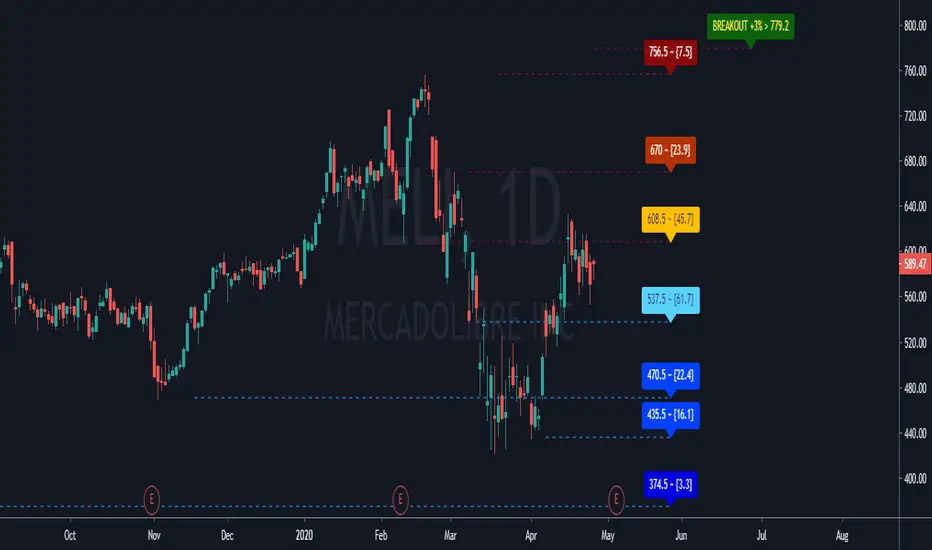
GC Supports & ResistancesThe indicator display the supports and resistances available. Breakout also are reported in case that not exists at least three resistances.
Does print lines and labels with each identified data (S, R and BO).
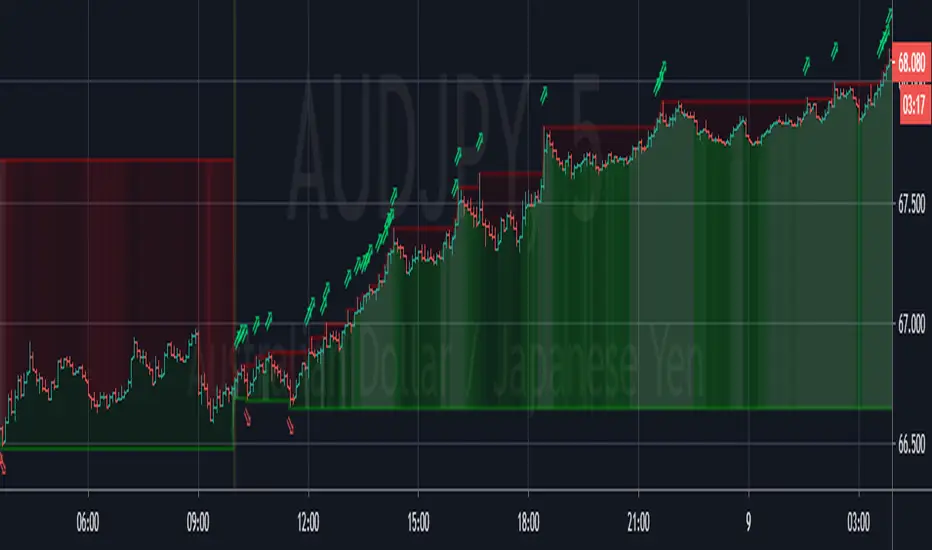
[Zekis]Opening Range Higher High Lower Low Forex SessionsOpening Range Higher High Lower Low Forex Sessions
Very useful for session trading, the opening range will reset when new session is start and will plot new higher highs and new lower lows until the end of the session.
Ability to change between 3 opening sessions:
* London - opens at 3:00 am EST
* New York - opens at 8:00 am EST
* Tokyo - opens at 7:00 pm EST
* New day - GMT +0
Green arrow - new higher high
Red arrow - new lower low
Green background - the strength of the bullish trend
Red background - the strength of the bearish trend
(the lighter the color, the stronger the trend)
Enjoy!
@zekis
Hi-Lo VT-Trader24月 1
日足以下のチャートで、選択している通貨の日足を表示します。
Displays the daily basis of the selected currency on the chart below the daily basis.
security()を使用する際の塗り直しを回避する方法を反映
Reflects how to avoid repainting when using security()

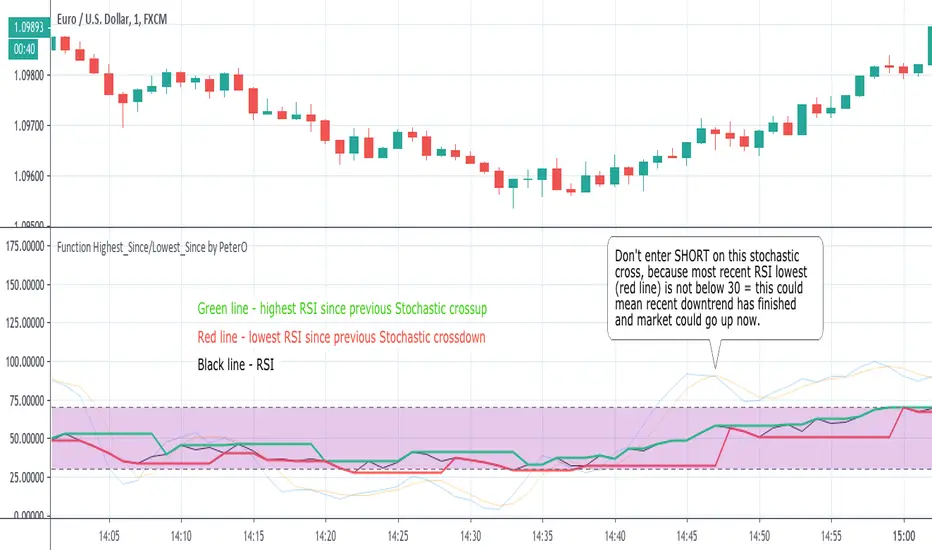
Function Highest/Lowest by PeterONo matter how much I like PineScript, there are still things missing in the language. One of the most annoying issues is that you cannot set dynamic length value for highest/lowest functions. This length must be fixed integer. But it doesn't make sense in a lot of cases, when you'd like to know what was the highest/lowest value of a series SINCE EVENT in the past, but you don't know WHEN this event exactly happened.
Us, coders would like to do this: `highest(series,barssince(...))`
But it is not working.
Numerous coders are using RicardoSantos' f_highest/f_lowest script (), probably the most often copy/pasted snippet of PineScript code out there. It is doing more-less what `highest(series,barssince(...))` would be doing, but with hardcoded max bars back.
Ricardo is my idol by the way, but that didn't stop me from creating my own version of Highest/Lowest functions. They are fast, simple, effective and very light for Pine engine.
Please treat this as an OPEN SOURCE snippet of code, which can be used in variety of ways.
I have implemented a simple use-case myself, to demonstrate what can be done. The example shows what was the highest/lowest value of RSI since the previous cross of Stochastic. So that you don't enter SHORT on Stochastic crossunder, if RSI didn't reach oversold (<30) since the previous Stochastic crossunder = aka maybe the downtrend has exhausted.
I'm sure you'll find plenty of use cases for it in your studies and strategies as well. If you create your own code using my Highest/Lowest functions, don't hesitate to put a link down here in comments.
P.S. This is not a strategy in any way, so don't ask me "does it backtest well?".
P.S.2 This code doesn't repaint as well ;)
ORB 15 Min By EquityDurai#Let the index/stock trade for the first fifteen minutes and then use the high and low of this "fifteen minute range" as support and resistance levels.
#A buy signal is given when price exceeds the high of the 15 minute range after an up gap.
#A sell signal is given when price moves below the low of the 15 minute range after a down gap.
#It's a simple technique that works like a charm in many cases.
>If you use this technique, though, a few caveats are in order to avoid whipsaws and other market traps.
>The most common whipsaw is a trading range that lasts longer than 15 minutes.
>If an obvious range builds in 20, 25 or even 30 minutes , use those to define your support and resistance levels.
>Also consider the higher noise level in the morning.
>A breakout that extends only a tick or two can be easily reversed and trap you in a sudden loss.
>So let others take the bait at these levels, while you find pullbacks and narrow range bars for trade execution.

Donchain BreakoutIt is a long only strategy.
1. Buy when price breaks out of the upper band.
2. Exit has two options. Option 1 allows you to exit using lower band. Option 2 allows you to exit using basis line.
3. Slippage and commissions are not considered in the return calculation.

Ichimoku Kinkō hyō Keizen 改MTF善The script is not finnished yet and show's an other interpretation of how it could be scripted
Step -1 is complete... Basic Ichimoku with asjutable length and editable lines colors and visibilities.
Step -2 in progress... Adding ability to une multiple Spans, sens and Kumo on higher and lower timeframe.
Your Step : Like and Share ;) have a good year 2020 !
2020-01-06 /--------/ -R.V.
Jan 06
Release Notes: The script is not finnished yet and show's an other interpretation of how it could be scripted
Step -1 is complete... Basic Ichimoku with asjutable length and editable lines colors and visibilities.
Step -2 in progress... Adding ability to une multiple Spans, sens and Kumo on higher and lower timeframe.
Your Step : Like and Share ;) have a good year 2020 !
2020-01-06 /--------/ -R.V.
Jan 07
Jan 13
Release Notes: MTF Ichimoku is on it's way !!
Jan 17
Release Notes: The script is not finnished yet and show's an interpretation of how it could be scripted
Step -1 is complete... Basic Ichimoku with asjutable length and editable lines colors and visibilities.
Step -2 in complete... Adding ability to use multiple Spans, sens and Kumo on higher timeframe.
Step -3 in progress... Creating a UNIX based function to framgments actual chart periods in subcandles or "Subprices/periods" to plot multiple Spans, sens and Kumo on LOWER timeframe.
Your Step : Like and Share ;) have a good year 2020 !
/--------Coder--------/ -R.V.

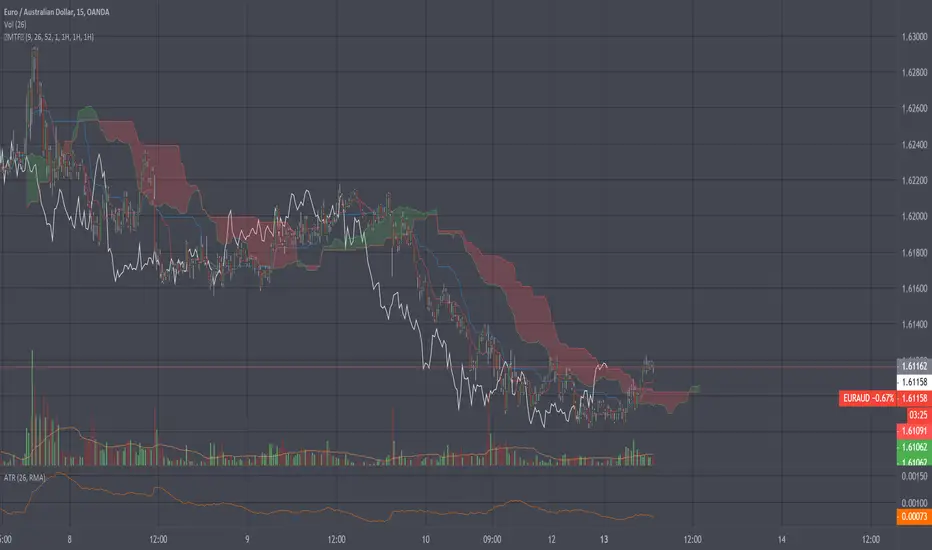
Range Box + VMA cloudsHere's a mix of two indicators that I find particularly useful.
One is a Range Box showing High and Low of the day plus 50% range, as well as high and low of the previous day. The Box changes color based on whether it closed higher or lower than the previous session.
The second one plots Variable Moving Average clouds - short and long term one.
The rules are pretty simple - take long trades only if the box is green, short trades if it's red.
Candle close above both clouds - long signal. If the price is being rejected from the long term cloud - buy the dip (or rally).
Pretty straightforward.
Enjoy
Credit for VMA: LazyBear
Credit for High Low DayBox: ahoudori

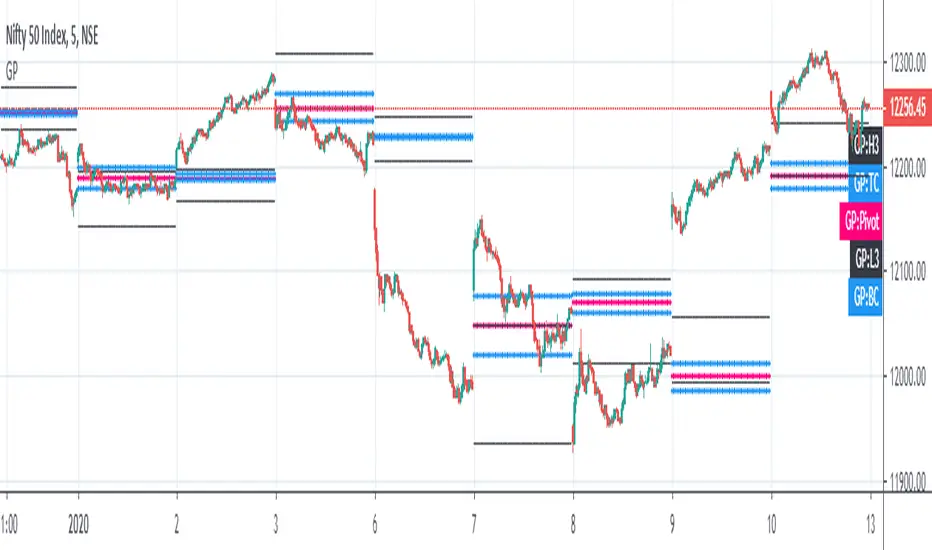
Golden Pivot1. Golden Pivot indicator combines Central Pivot Range and Camarilla Pivots.
2. Pivot calculations are based on Secret of Pivot Boss book by Frank Ochoa.
3. One can also view tomorrow's pivots by today EOD.
Ichimoku Kinkō hyō Keizen 改善
The script is not finnished yet and show's an other interpretation of how it could be scripted
Step -1 is complete... Basic Ichimoku with asjutable length and editable lines colors and visibilities.
Step -2 in progress... Adding ability to une multiple Spans, sens and Kumo on higher and lower timeframe.
Your Step : Like and Share ;) have a good year 2020 !
2020-01-06 /--------/ -R.V.
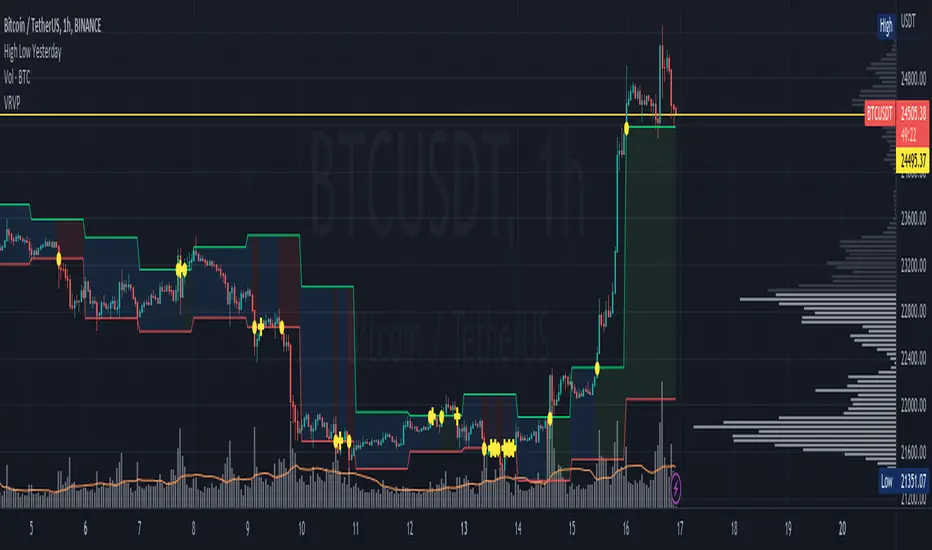
High Low YesterdayMy friends, this is a very simple script, but it has some work to function the way it currently does.
Basically it prints the HIGH and LOW from previous day into the current day. This forms like a channel.
It's useful to visually detect when the price cross over the yesterday's high, or close under yesterday's low.
You can activate/deactivate colors as input parameter:
- Price above a previous high: fills green.
- Price below a previous low: fills red.
- Price inside previous low/high: fills blue.
Hope this helps to you too.
This only works for intraday resolutions only (less than 1D)
More to come: I'm working to include pre-market low/high for the current trading day.
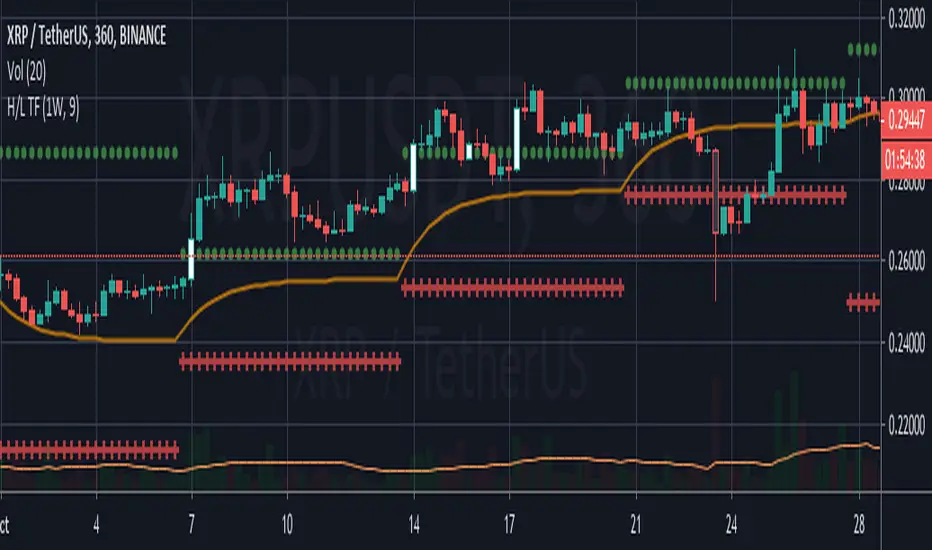
High/Low Weekly TimeframeI'm testing a simple but useful indicator that plots the high and low for the current week. The time-frame can be selected by the user.
It's useful when you're trading in a smaller time-frame (example: 1H or 4H) to know exactly the weekly low and high, and whether the price breaks above or below this price lines.
This indicator allows you:
- To select the desired time-frame to get the Low and High.
- To print an optional EMA for the same time-frame.
- To optionally change the bar-color when the close price crosses above the weekly high or crosses below the weekly low.
Hope this helps you to visually identify price movements.
If you like this script please give me a like and comment below.
Thanks,
Rodrigo
360D_TradersStreamThis is a Ultimate Tool for Trading. This tool includes
1. MA = In that you will find EMA & SMA
2. MA Length = It's Length of MA
3. Explosive Leg-out Strength = It's Explosive Candles Strength
4. RBR Pattern = Up to 6 Bases and you can minimize Base Qty.
5. DBD Pattern, DBR Pattern & RBD Pattern as we mentioned above
6. Curve Time Frame = Choose this thing so, tool can know what is your curve accordingly this it will judge your ITF & LTF
7. High of the Curve & Low of the Curve = Please enter manually the no.'s of your Upper curve & lower curve. and when changing chart don't forget make it "0"
8. Trend @ ITF = Choose your Trend. (Please choose your Trend from your ITF Time frame, to get better results)
9. Intraday Risk in % & Swing Risk in % = Calculates as per DATR
10. 1st Symbol & 2nd Symbol = To have other stocks price in your chart.
11. Tick for White Label & Un-tick for Black Label
12. Explosive Candle & Basing Candle = Tick to view Explosive & Boring candle in zone formations & Untick hide the indication
13. And finally you can change Labels Size as per your requirement,

High Low of Custom Timeframes by Theoris Normal indicator for show
High - Low of Custom timeframe ( default is Day timeframe )
show label with custom Color text
and show the value of High, low.
#HOD #LOD


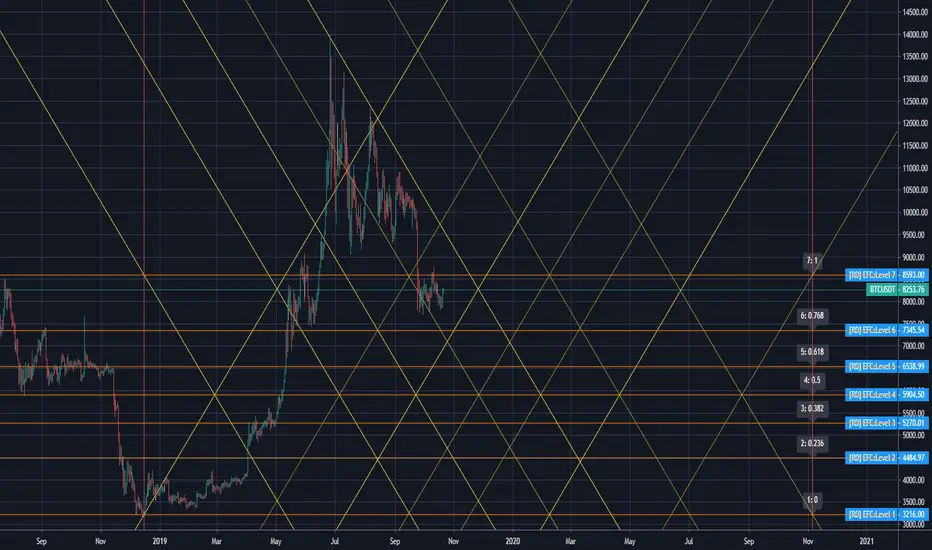
[RD] Easy Fibonacci Channels==================================================================
October 21 2019 - Easy Fibonacci Channels - by RootDuk
==================================================================
Easy adaptable fibonacci channels. By changing the levels you can adapt
the lines as needed. There's also global params to use for horizontal and
vertical scaling.
===================================================================
Notes
===================================================================
None so far
===================================================================
Updates
===================================================================
Non so far
Trade guide for MMSThis simple overview calculates the 25,50,75 and SL,TP levels when using the MMS strategy. It's meant to help you quickly make a decision whether to open a trade. You can quickly see if the 25% TP level will be hit before hitting a resistance zone. Likewise it makes it quick to set your TP alerts by clicking on the + icon on the right next to the colored lines.

HL30 SystemIndicator based on Joseph Fibonacci's HL30 trading system. Do not trade this indicator if you don't understand the system.
Once you understand the system and you are not in a consolidation zone you can take hint from two arrows.
1) Green Arrow Signals first sign to trade.
2) Yellow Arrow confirms the correct candle stick pair to trade with.


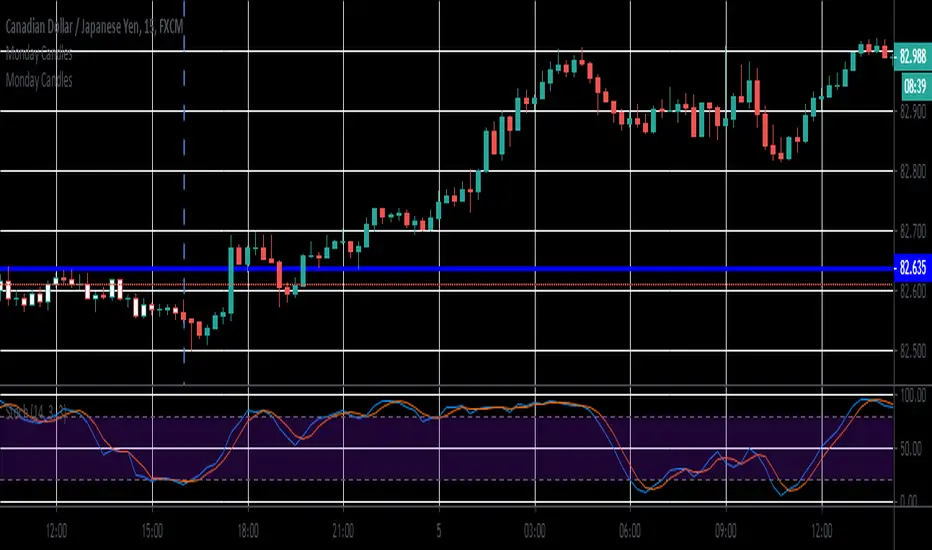
PIP Assassins Monday Highs & Lows as Support & ResistanceModification of existing Monday Highs & Lows

PIP Assassins Monday Candles Support & ResistanceRules Checklist
Before anything:
Check News for your pair.
Absolute Number 1* Use Monday Candles Support & Resistance rules below before proceeding
1. Find a fake Breakout (Head of the head and shoulder. A left shoulder should be always to the left)
2. Draw Fibs after you see retracement forming
3. Plot Support and resistance lines on 50% and 61.8%
4. Check past to see if these areas are strong support and resistance.
5. If Support & Resistance land on 50% or 61.8% on a Monday High or Low and on the left shoulder then go to step 6.
6. Determine Order Type based on direction
7. Place Limit order on your MT4 app
**How to use Monday Candles as Support & Resistance**
1. Check the Monday Highs and Lows
2. Wait for a candle to break and close outside of a Monday High or Low.
3. Set an alert for a the crossing of a candle at a Monday High or Low depending on the direction
of the market you want to see.
Look for imbalances in the market. its a missing right shoulder on a head and shoulder pattern
