하이-로우 인덱스
Rets High/Low (2.0 Special Uncensored Edition)This script can be used as a visual aid in seeing the last highs and lows of price in a specific time period. It automatically updates the plots if new highs or lows are made within the given lookback period.
This is a fairly basic version currently, with new added features coming in future updates such as range between high/low and half and whole number detection.

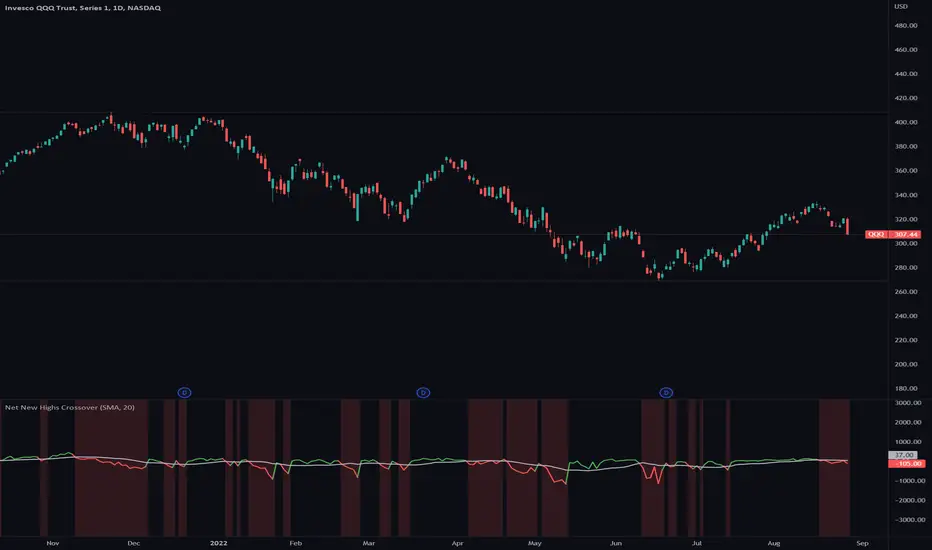
Net New Highs CrossoverA lot of traders have a hard time to get in and out of the market at the right time.
Net New Highs of stocks can guide you to increase or decrease your exposure based on the current market health.
They are calculated by subtracting the new highs of the new lows, based on all stocks of the NYSE, NASDAQ and AMEX.
+ A positive value shows that the market is doing good, since more stocks are making new highs compared to new lows.
- A negative value shows that the market is doing bad, since more stocks are making new lows compared to new highs.
Combined with a moving average you can see crossovers that can warn you early when there is a change in the current market health.
Features
■ You can select different Net New High indices or combine them (NYSE, NASDAQ and AMEX)
■ You can specify a moving average line ( SMA / EMA and length)
■ Use single color or two colors for the moving average line to better spot the crossovers
Hints
*New highs and new lows index values currently only get updated at the end of the day
*Only works on daily timeframe
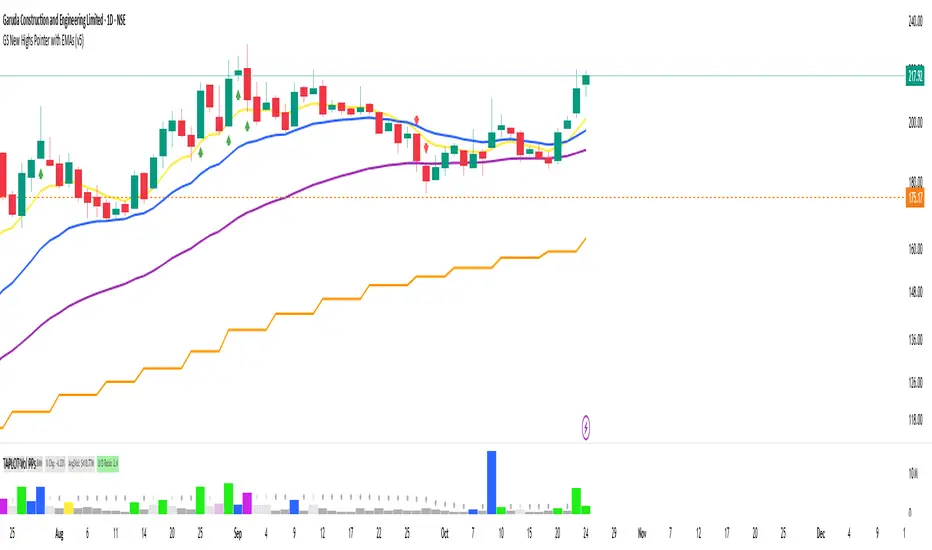
GS New Highs PointerWhat is this Indicator - This indicator i developed for identifying Highs and lows on weekly timeframe. It identifies new 52 weeks and 26 weeks high and during down trend market, it looks for new 6 month lows or 52 week lows
How to Use it - To use this indictor , You need to plot it in the chart and can be used in anytime frame. Whenever you see a stock showing green arrow below the price, then it means it has hit new 52 and 26 week highs. It basically means something interesting happening in that stocks and you can make your buy decision based on it if you are looking for momentum stocks
Market- It will work in any market condition Bull or bear if you are looking for momentum run
Condition - Use it when you are in satellite stocks and you want to identify if stocks is making new highs or not.
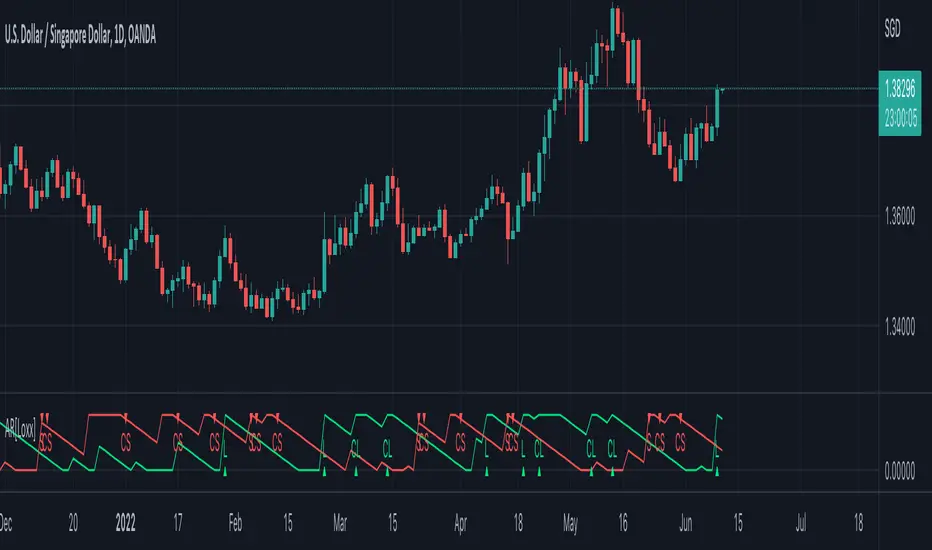
Aroon Backtest (Simple) [Loxx]Simple backtest for Bears Bulls Impulse found here:
What this backtest includes:
-Customization of inputs for Aroon calculation
-Take profit 1 (TP1), and Stop-loss (SL), calculated using standard RMA-smoothed true range
-Activation of TP1 after entry candle closes
-Long and short signal cross entries
-Continuation long and shorts entries calculated by lagged same-signal cross-ups and cross-downs
Happy trading!

Aroon [Loxx]The Aroon indicator is a technical indicator that is used to identify trend changes in the price of an asset, as well as the strength of that trend. In essence, the indicator measures the time between highs and the time between lows over a time period. The idea is that strong uptrends will regularly see new highs, and strong downtrends will regularly see new lows. The indicator signals when this is happening, and when it isn't.
Included:
-Long and short signal cross entries
-Continuation long and shorts entries calculated by lagged same-signal cross-ups and cross-downs
This is an exact clone of the "Aroon" for MT4 indicator
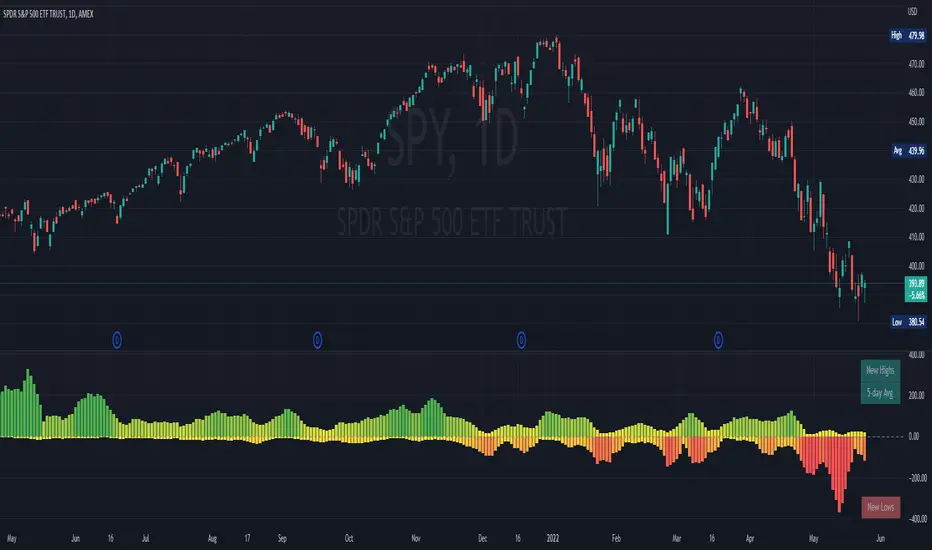
NYSE New Highs vs New LowsNYSE New Highs vs New Lows is a simple market breadth indicator that compares HIGN, the number of new highs during that day, and LOWN, the number of new lows. The new highs are on top and lows are appropriately on bottom. Without averaging, it's a little chaotic so you can smooth them out as much as you want, and the top-right label shows how much you're smoothing.
Interpretation:
Essentially, we use $SPY or $QQQ as a proxy for what's going on in the market, but because the FAANG stocks are so heavily weighted, it's not always representative. If SPY is flat/down, but there are 200 new highs today, then one of the big boys is weighing down an otherwise very bullish market. It's like looking at one of those heatmap charts, but in a single number.
Bullish Trend
- Lots of new highs
- Very few new lows
Bearish Trend
- Lots of new lows
- Very few new highs
Potential Reversal
- Too high, 250+
- Too low, 150+
Lowest / Highest From WidgetRecent events inspired me to create a small widget that allows you to spot from when current value is lowest / highest.
Just add it to chart and script will compute most recent day when price was higher / lower than current and it will display:
Line coming from that value to the current one
A table with previous low/high information
Thanks to @MUQWISHI to help me coding it.
Disclaimer
Please remember that past performance may not be indicative of future results.
Due to various factors, including changing market conditions, the strategy may no longer perform as well as in historical backtesting.
This post and the script don’t provide any financial advice.

[TTI] Stage 2 Signal & NetNewHighs vs NetNewLowsHISTORY AND CREDITS –––––––––––––––––––––––––––––––––––––––––––––––––––––––
Stage 2 is part of Mark Minervini's NON-NEGOTIABLE criteria. What does this mean? Well it means that Mark does not enter a trade that is not in Stage 2. Stage analysis is the work of Stan Weinstein who divides stock price movements in 4 stages (Stage1, Stage2, Stage3 and Stage4). Additionally, the second part of the indicator, NetNewHighs (NNH) vs NetNewLows (NNL), has been used by many traders, most recently I have seen Matt Caruso use it in his methodology.
WHAT IT DOES ––––––––––––––––––––––––––––––––––––––––––––––––––––––––––––––
1️⃣ Stage 2 Signal
This method uses price, moving averages, volume in order to asses when it is the best time to get in a trade.
👉 Stage 1 - stock goes sideways and does not make any price progress
👉 Stage 2 - stock gains a lot of value and is trending up. It shows strong support from institutions
👉 Stage 3 - stock goes in a sideways action again
👉 Stage 4 - stock loses a lot of it gain in a short amount of time
Stage 2 is shown by the AQUA/CYAN color on the first line of the indicator.🟦
2️⃣ Net New Highs vs Net New Lows
This assess the general market health. It looks at the ration of New Highs vs New Lows. The indicator assess when there has been 3 consecutive days of Net New Highs > Net New Lows, this show that the general market is moving up as more stocks are advancing than those that are declining. As per Investor Business Daily research the stocks move is determined 50% by the move of the general market, 25% by the move of the sector it is in and 25% by the stock itself. Therefore, the indicator helps assess and analyze the 50% of the general marekt.
When the condition of 3consecutive days is met the indicator prints green square on the bottom line 🟩.. The sensitivity (i.e. the 3 day can be changed in the settings).
HOW TO USE IT –––––––––––––––––––––––––––––––––––––––––––––––––––––––––––––
1️⃣ Stage 2 Signal
Only enter trades when they are in a Stage 2. This drastically increases the probability of success when trading to the long side. Look for AQUA/CYAN squares print before entering a trade
2️⃣ Net New Highs vs Net New Lows
Look for confirmation criteria indicated by a printing of green squares in the bottom of the indicator.

Session LevelsThis indicator plots important session (intraday) levels for the day. It plots high and low of previous day, week, month, 52 week and all time. Also plots the vix range which shows the daily expected trading range of the instrument. These levels acts as important support/resistance for the day.
For example, if price closes above previous day, week, or month high/low it indicates bullish sentiment and vice versa for bearish.
Vix Range plots top, center, bottom line for expected trading range for the day. It is calculated based on the volatility index selected (NSE:India VIX is used by default).

MicroStrategy MetricsA script showing all the key MSTR metrics. I will update the script every time degen Saylor sells some more office furniture to buy BTC.
All based around valuing MSTR, aside from its BTC holdings. I.e. the true market cap = enterprise value - BTC holdings. Hence, you're left with the value of the software business + any premium/discount decided by investors.
From this we can derive:
- BTC Holdings % of enterprise value
- Correlation to BTC (in this case we use CME futures...may change this)
- Equivalent Share Price (true market cap divided by shares outstanding)
- P/E Ratio (equivalent share price divided by quarterly EPS estimates x 4)
- Price to FCF Ratio (true market cap divided by FCF (ttm))
- Price to Revenue (^ but with total revenue (ttm))

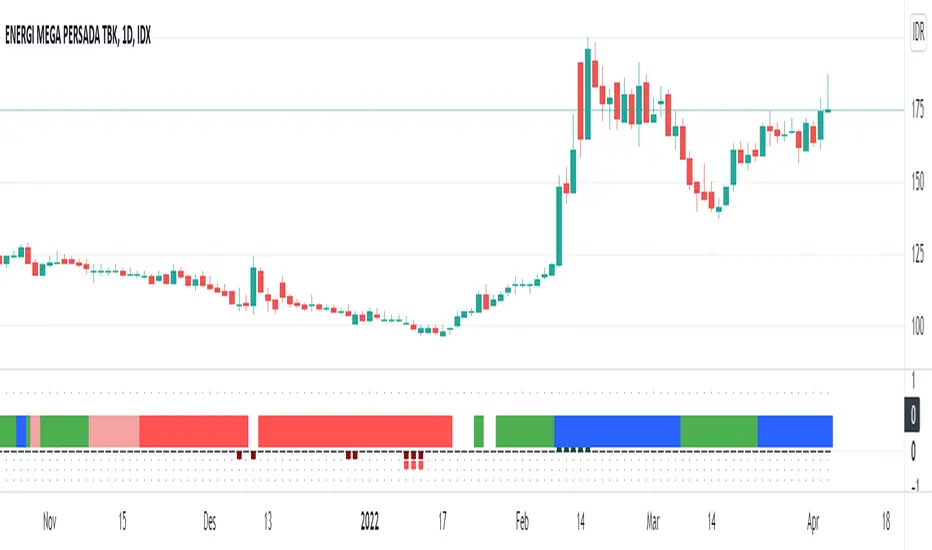
Trend OptimizerWhat is this?
This horizontal trend color and vertical trend bar is a trend identification to optimize your positioning in the market. Colors helps you to understand the trend easily, spontaneously.
The indicators & Strategies?
1. A horizontal trend color which represents the medium term trend. The color change is based on the price position towards moving average. We exclude the moving averaged from chart area so the chart area will be clean and you'll have an easier interpretation. This trend color helps you to understand the major trend as simple as you see navigation maps in your smartphone. When the trend color changed from the long red into white, then green, then blue, it indicates a bottom reversal. This module will work best with out other module: Trend Optimizer Module and Momentum line Module.
2. A vertical trend bar represents long term trend. Bars that above the axis is an uptrend bar. If it occurs, the long term bullish trend is exists. Bars below the axis is a downtrend bar. If it occurs, the long term bearish trend is exists. If there is no bars (empty), means the long term trend is weakened but the trend still as same as the last bars occurrence.
Benefit for you:
You'll have a guidance the existing trend and the trend progress from time to time.
If you combine this script with our other two module: Profit Trader module & Momentum Line Module, You'll have a complete template to analyze both trend and swing strategies.
Trending Bar SRTrending Bar SR is a simple script define a Bar called "Trending Bar".
Depend on direction of Trending Bar, if Trending Bar is UpTrend then this indicator plot Bar's Low Price as Support and if Trending Bar is DownTrend then it plot Bar's High Price as Resistance.
Beside, this indicaor also plot 4 levels retracement of Trending Bar for trading.
1. Define Trending Bar
1.1 Uptrend Bar
+ Close Price higher than previous High Price
+ Body greater than sum of shadows (up and down)
+ Color: A green dot is plotted at bottom chart.
1.2 Downtrend Bar
+ Close Price lower than previous Low Price
+ Body greater than sum of shadows (up and down)
+ Color: A red dot is plotted at bottom chart.
2. Retracement Level
+ Trending Bar Retracement 0.5 is called Equerium.
+ Trending Bar Retracement 0.618 is called Perfect Entry.
+ Trending Bar Retracement 0.705 is called Optimal Entry.
+ Trending Bar Retracement 0.79 is called Max Entry.
3. Trading
+ When Price crossed Equerium, consider open position at Perfect Entry, Optimal Entry with stoploss place at Max Entry.
+ If place order at Max Entry, stoploss can place at Support or Resistance.

World Markets Open/Close BackgroundIndicator fills background color on the chart for different markets around the world.
This can be helpful in some markets to understand after hours and premarket price action. User can study if there is correlation between highs/low in whole session or open/close of different markets.
Tokyo, Hong Kong and Shanghai are Asian Markets in Red are combined
Bombay, London and NYSE are individually plotted.
Times can be changed for each session to include the entire session, or selected block of 15 minutes.
Less than 15 minutes will need to be changed in the default value of the code which is why I'm publishing it open source.
All coded default times for each market are in CST.
Background color can be turned off individually under the Style tab, and can also be unchecked under Inputs and can just be used for source for further coding.
My intentions for this script is to use it and its variable value to plot the highs and lows just in the specific times in a session and to more easily visualize those sessions with color coding.
I hope this is useful
Cheers!

IB + ExtensionsInitial Balance with Extensions.
Other traders have posted similar indicators. I wrote my own because I wanted additional features.
Features:
Supports up to 9 extensions. Default = 3.
Each extension is filled using an automatic gradient. Fill can be disabled if you like.
IB levels extend into the future to the end of the current session.
By default only the current IB levels are shown, but you can enable past IB's as well.
When showing past IB's, each session has a clean break - no awkward lines connecting one session to the other (this really annoyed me about other IB indicators!)
The IB midpoint is also supported. It is on by default, but can be disabled.
You may notice the midpoint of past IB's looks different than the current IB . There is a technical reason for this that I won't go into here. Ask if you want the full explanation.
NOTE: This indicator was designed for the crypto charts. It may have some rendering issues when used with other markets.

Cash Gaps on a Future/CFD-ChartThe script is based on the great work of @NgUTech which very nicely prints the gaps on any given chart.
The purpose of this script is to show the gaps to futures or cfd of the underlying cash chart, because very often gap closing provides an opportunity to fade the move.
The script works in the way that the user provides the underlying chart symbol and the current spread of the instruments (cash-future/cfd) and it draws boxes where the cash-gaps are.
If you know a way to automatically calculate the spread of the two instruments, please let me know, thanks.
Michael

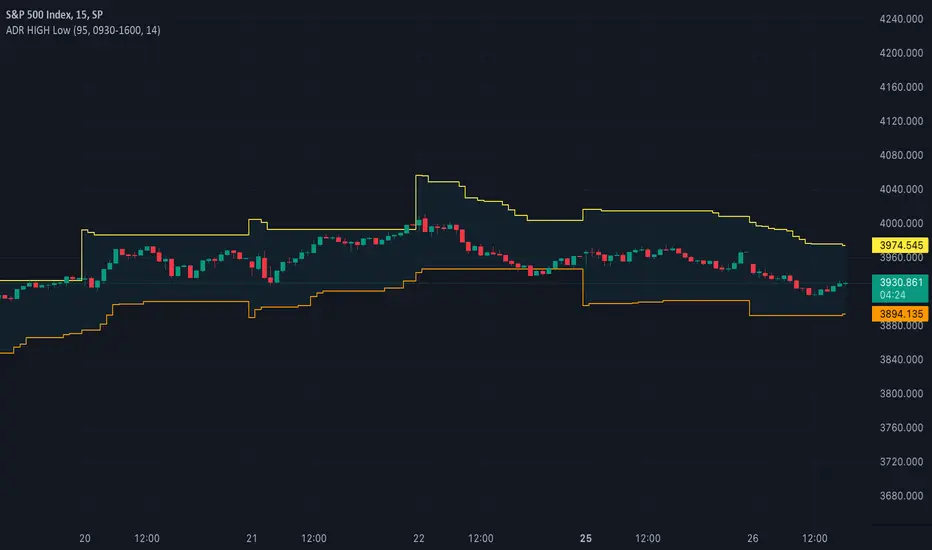
ADR - Average Daily Range With ForecastI always liked the MT4 ADR indicator that was going around but never found a decent port of it in tradingview. I also noticed that the way most people were doing the ADR calculation using SMA was not always accurate and that bothered me so I decided to write one from scratch which gave a very specific ADR calculation.
On the MT4 version it would project ADR targets on the high and low side. While I liked that I thought it could be improved upon by determining orderflow and anchoring to the perceived low of day to give you a more realistic target.
I also included a percentage of current ADR as well as changed the color to red once ADR was hit.
Configuring is very simple:
Max Timeframe To Display: you can set what timeframes to show adr (I know tradeingview lets you set this now but I still like it here)
Display Average Range As FOREX pips: Some Instruments use whole numbers so you can toggle if you need too
ADR Length Parameter: Sets Number of Days Lookback to Calculate ADR
I hope you enjoy it.

LUNA - Hold The Line Or DieThis indicator is trying to predict potential LUNA token bottom.
How does this work?
There is UST baked by LUNA and in case LUNA drops so hard that MC of LUNA is lower than MC of UST we are at risk of repeg and kinda "breaking" of Terra Blockchain.
This indicator doesn't take into account other stable assets but UST but they don't take a big portion of total stable tokens capitalization so it can be omitted.
Heavy buy pressure is expected at indicated levels.
The indicator is based on a simple formula:
LUNAfloor = USTmc/LUNAmc * LUNAprice

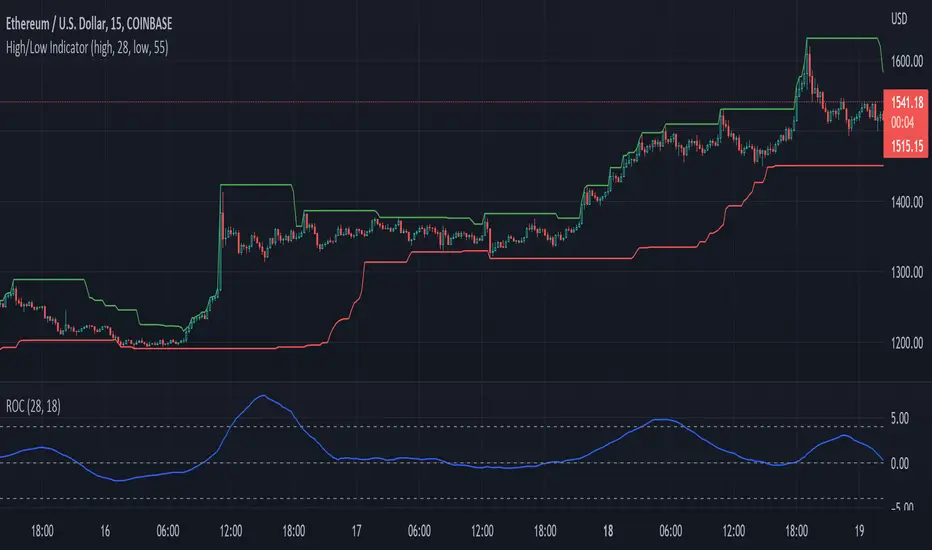
High-Low IndexHello All,
High-Low Index is a breadth indicator based on Record High Percent (RHP). RHP is based on new 52-week highs and new 52-week lows. RHP => 100 * (new highs) / (new highs + new lows). High-Low Index is a 10-day Simple Moving Average of the RHP, which makes it a smoothed version of RHP. You can find many articles about High-Low Index on the net.
High-Low Index above 50 indicates that there are more new highs than new lows, and considered as Bullish.
High-Low Index below 50 indicates that there are more new lows than new highs, and considered as Bearish.
High-Low Index = 0 indicates there is no new highs (0% new highs).
High-Low Index = 100 indicates that there is at least 1 new high and no new lows.
and High-Low Index = 50 indicates that new highs and new lows is equal.
by default 40 cryptos are used in the script and shows High-Low Index for these cryptos. but you can change them as you wish. for example you can set all of them as stocks and see High-Low Index for these stocks.
You can set " Time frame " and the " Length " using the options. For example; if you set " Time frame " = 1 Week and the " Length " = 52 then it finds High-Low Index for 52weeks .
or another example; if you set " Time frame " = 1 Day and the " Length " = 22 the High-Low Indexn it finds High-Low Index for 22days.
You can enable/disable Record High Percent or Simple Moving Average of High-Low Index. Some traders use High-Low Index with its SMA, for example; High-Low Index generates a buy signal when it crosses above its moving average, and a sell signal when it crosses below its moving average.
Optionally you can see the securities in a table on the left bottom, you can change table size by usşng the options.
In the Table, for each security/cell;
=> if background is green then it has New High
=> if background is red then it has New Low
=> if background is gray then no New High, no New Low
=> if background is back then Data is not available for the security
As you can see in the screenshot below, the securities were changed and stocks are used instead of cryptos, so it calculates & shows High-Low Index for these stocks.
you can also find explanation in this screenshot:
Enjoy!

Mid to High daily % - MA & ThresholdPurpose of this script is to provide a metric for comparing crypto volatility in terms of the % gain that can be garnished if you buy the midpoint price of the day and sell the high***. I'm specifically using bots that buy non-stop. This metric makes it easy to compare crypto coins while also providing insight on what a take profit % should be if I want to be sure it closes often instead of getting stuck in a position.
Added a few moving averages of (Mid-range to High Daily %). When these lines starts to trend down, it's time to lower the take profit % or move on to the next coin.
Decided to add a threshold so I could easily mark where I think the (Mid-range to High Daily %) is for most days.
Ex. I can mark 10% threshold and can eyeball roughly ~75% of the days in the past month or so were at or above that level. Then I know I have plenty volatility for a bot taking 5% profit. Also if you have plenty of periodic poke-through that month (let's say once a week) you might argue that you can set it to 7% if you're willing to wait about that long. Either way this metric is conservative because it is only the middle of the range to the high, a less conservative version might provide the % gain if you bought the day low and sold the day high.
***Since this calculation only takes the middle of the range and the high of the day into account, red days are volatile against a buyer but to your advantage if you are a seller. BUT if you have plenty of safety buy orders this volatility in price only means your total purchase volume increases and when/if you reach a take profit level you sell more there.
Would like to upgrade and add a separate MA line for green days and a separate MA line for red days to discern if that particular coin has a bias. Also would like to include some statistics on how many candles are above or below threshold for a certain period instead of eyeballing.

SAR-adjusted extremesThis indicator shows how far (i.e. the absolute distance) of the extremes (i.e. high & low) are from the current parabolic SAR

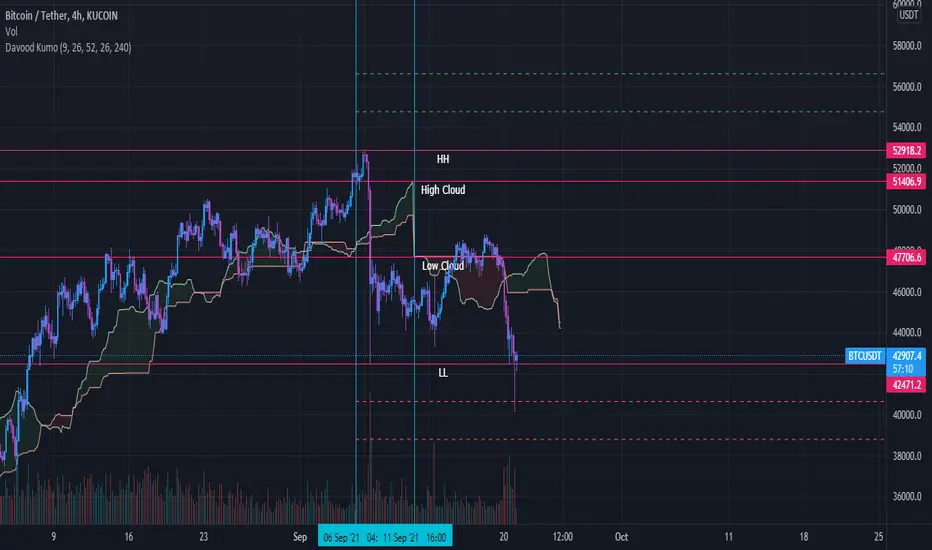
Davood Kumothis andicator is build in base of ichimoku cloud.
Select the interval at which the kumo clouds change phase and depending on what time frame we are in, we give the time inputs to the indicator.
then, the indicator calculates the area of the cloud and set the ascending and descending targets when price break the highest or lowest candle in that time range.
So entry point is the highest and lowest candle and first and second targets are determined by the indicator.
note : i used this andicator only in crypto market not forex and it works well