MTF WatchList Charts [Anan]█ OVERVIEW
I am happy to present this script with a nice idea!
You can now customize a watchlist with your preferred time frame and any symbol from any market.
The main purpose is to be aware of any moves and watch a brief overview of the chart.
█ FEATURES
- 8 customizable symbols with the option to show/hide anyone
- Multi time frame support
- 3 Types of charts (Candles / Heikin Ashi / Line)
- Displaying up to 10 candles for every chart
- Customizable chart colors
- Option to Show/hide Price
- Option to Show/hide Price Line
- Option to change Labels and Text Size
- Show Symbol name and used time frame
- Option to change gaps between charts
- Hover over on the top of any candle to see (Open/High/Low/Close) Prices
█ SCREENSHOTS
-----------------------------------------------
Special thanks to @dgtrd for inspiration and for the amazing framework used here ( HTF Candles by DGT )
Special thanks to Pine Chat @fareidzulkifli @Bjorgum @JohnBaron @fpainchaud
캔들스틱 분석

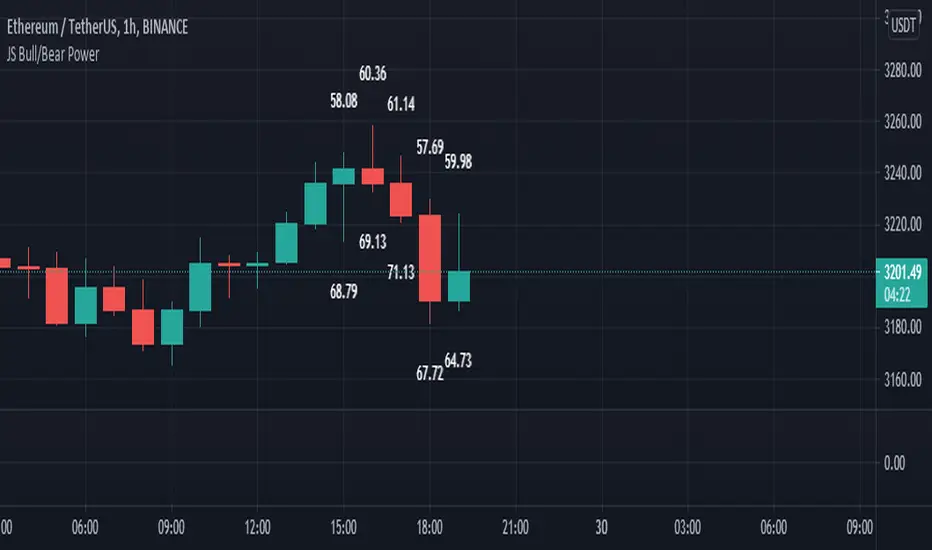
JS Bull/Bear PowerI created this Indicator for all chart lovers.
This Indicator measures the wick parts of candles and sum it up. Wick part of candle is a sign of strength that's why it measures the 60 bars of candles wick. then sum it up and converted it in percentage. The output is indicated in the last 10 candles. that's how simple this indicator is but very useful to analyze the strength of every candles.
The upper numbers is the bear power.
The lower numbers is the bull power.
Happy Trading
MTF Candlestick Patterns Screening [tanayroy]This script displays all candle patterns found in multi-time frames for a given lookback period. Candle pattern screening logic is taken from TradingView’s built-in script. The script works with 5m, 15m, 30m, 1HR, 2HR, 4HR, D, W, M timeframe. Works best with 5m chart.
Options available for trend detection, lookback period, and selecting candle pattern.
Please like, comment, and follow.

Poor ReversalsPoor Reversals Indicator
This indicator finds Poor Reversals. Poor reversals are reversals in price with consecutive highs or lows that are close together. Look for the different types of highs and lows. Some say candle patterns don't matter, but they forget it's the orderflow that makes the pattern. Find poor, tweezer, and 1 tic rejections and study what happens next. We don't need to read the depth of market to see what the orderflow is saying. They are called poor because the auction didn't run its course. It didn't continue the direction until all activity in that direction was exhausted. Proper reversals create excess. Excess is a long tail/wick. A proper reversal leaves a long tailed excess unfilled.
The different highs and lows give clues to what kind of orderflow happened there. The difference between them is which high or low happened first. Price does often come back to these areas and clears them up with a proper reversal. We can see them on all timeframes. Knowing what they mean in the orderflow helps with reading charts.
The Poor Reversals are:
Poor
1 Tick Rejection
Tweezer
When looking at 2 bars that have very close high or lows, there are a few different types. They are each poor and can be further defined as each are price action clues.
If next low is higher, it's a poor low
If next low is lower, it's 1 tic rejection
If next low is equal, it's tweezer bottom
If next high is lower, it's a poor low
If next high is higher it's 1 tic rejection
If next high is equal it's tweezer bottom
Poor Highs and Lows:
The high or low comes first. The next bar does not go past it. Poor highs and lows are often created from price exhaustions. This means at poor highs buyers are trapped. At poor lows sellers are trapped. Price ran out of steam to continue in that direction. There wasn't enough activity and participation to continue the auction in that direction.
Poor lows are defined when 2 lows are very close, and the 1st bar is lower. The 2nd comes very close to a new low. It happens most when shorts, at the moment, "run out of steam". They were "too aggressive" and got themselves "short in the hole". When a poor low is made, price will bounce because shorts are buying to protect profits.
Poor highs are defined when 2 highs are very close. The 1st bar is higher. The 2nd comes very close to a new high. It happens most when longs, at the moment, "run out of steam". They were "too aggressive" and got themselves "long in the tooth". When a poor high is made, price will pullback because longs are selling to protect profits.
1 Tick Rejections:
The high or low comes last. The next bar goes just a little bit beyond it. A "1 tic rejection" happens when a new low is made and quickly rejects. The name is misleading. It doesn't have to be "1 tic". Different markets have different measurements. For ES, it's less than 8 tics. For NQ, it's about 5-20 points. It varies depending on relative market volatility.
1 Tick highs are defined when 2 highs are very close, and the 1st bar is lower. This happens when longs are aggressive and drive price up. Price makes a newer high and longs rapidly start taking profits. Their selling activity drives price lower. In the orderflow, longs likely closed at the same time new shorts sell. This competition to sell drives price lower. At the high, it says longs saw it wouldn't go higher and they took rapid exit.
1 Tick lows are defined when 2 lows are very close, and the 1st bar is lower. This happens when shorts are aggressive and drive price down. Price makes a newer low and shorts rapidly start taking profits. Their buying activity drives price higher. In the orderflow, shorts likely closed at the same time new longs buy. This competition to buy drives price higher. At the low, it says shorts saw it wouldn't go lower and they took rapid exit.
Tweezer Tops and Bottoms
The highs or lows of the bars are equal. Tweezers most often mean that an aggressive trader is influencing price. They drove price in one direction and then quickly reversed sentiment. Tweezers most often happens in stop hunts. An aggressive trader found where the stops were located and then entered an aggressive order to turn the market.
Tweezer Tops are defined when 2 highs are equal. The first bar sets the high. The second bar matches the high. This happens when there is an active seller entering. It could be simple profit taking from longs or new aggressive shorts. In bull trends, price will move up to find short stop. When the stops are found, the market reverses sharply lower.
Tweezer Bottoms are defined when 2 lows are equal. The first bar sets the low. The second bar matches the low. This happens when there is an active buyer entering. It could be simple profit taking from shorts or new aggressive longs. In bull trends, price will move up to find long stops. When the stops are found, the market reverses sharply higher.
Poor Reversals can be poor, 1 Tick Rejections, or Tweezers. They are all considered poor and upon further investigation we can see they are created from different conditions in the orderflow. They are not called Poor Reversals because they are weak. They are called poor because of the action that happened there. One side got caught in a bad position. Other sharks in the market smelled blood and ripped them apart.
This indicator is a work in process. While the concepts are great for real time trading, this indicator is not designed to be used in real time trading. It will repaint based on the bar close. The purpose of this indicator is to train our brains to see these nuances on candle charts. Some say candle patterns don't matter, but they forget it's the orderflow that makes the pattern. We must make split second decisions and knowing the context behind the orderflow reduces response time. These poor reversals don't have to retest, and the best ones won't come back. I use these concepts to find exits, where my trades might be wrong, confirmation I'm on the right side. It's amazing how these simple nuances can turn the markets. But sure enough, they do. Check them out in all time frames.
It's a fun indicator to play with. Some markets do require tweaks to the “Ticks” setting. Too big and charts will be noisy. Too low and not much will show up. A general rule of thumb is more volatile markets need higher tick values while less volatile need lower Tick values. Higher timeframes are also more reliable than lower time frames. I've included some customizable settings and I plan on adding more in the future. Enjoy!

Ehlers Instantaneous Phase Dominant Cycle [CC]The Instantaneous Phase Dominant Cycle was created by John Ehlers (Stocks & Commodities V. 18:3 (16-27)) and this is one of many similar indicators that I will be publishing from Ehlers in the next few months that calculate the current dominant cycle period. The cycle period can be used in multiple ways but generally this means that if the stock is currently at a low then the current cycle period will tell you when the next lowest low will get hit or vice versa. This is also useful for using this cycle period as an input for other indicators to provide a very good adaptive length. Let me know how you wind up using these indicators in your daily trading. I have included the same buy and sell signals from my recent Hilbert Transform and so buy when the line turns green and sell when it turns red.
Let me know if there are any other indicators you would like to see me publish!

KV Box v1.0 - Buy / Sell signalKV BOX is a trading indicator. It combines Darvas box theory (developed by Nicolas Darvas), breakout strategy, multi-timeframe trading and ALMA (Arnaud Legoux Moving Averages). This indicator helps identify BUY signals when the price is in the entry zone and SELL when the price breaks out of the uptrend.
---
How to use?
KV BOX can be used in both SPOT and FUTURE (Long/Short) trading
BUY (LONG):
• Entry: When the BUY signal appears.
• Stop loss: LOWER than LOW of first and second candlestick IN THE BOX WHERE BUY SIGNAL APPEARS of 1H, 4H, 1D timeframe.
• Take profit: When the SELL signal appears.
SELL (SHORT):
• Entry: When the SELL signal appears.
• Stop loss: HIGHER than the HIGH of first and second candlestick IN THE BOX WHERE SELL SIGNAL APPEARS of 1H, 4H, 1D timeframe.
• Take profit: When a BUY signal appears.
---
Attention:
KV BOX is only displayed on 1H, 4H and 1D timeframe. 1H for short-term trades (a few days), 4H for mid-term trades (a few weeks), 1D for long-term trades (weeks to months).
---
Options setting:
- Kelvin box on: KV BOX activates
- ALMA mode on: KV BOX activation according to Arnaud Legoux Moving Average (ALMA) method
- Pinbar indicator: activate the indicator when the pinbar candlestick appears
- Supertrend: trend continuation or reversal indicator
============================
KV BOX là 1 chỉ báo mua / bán kết hợp giữa nguyên lý hộp Darvas, phương pháp phá vỡ (break out), giao dịch đa khung thời gian và đường trung bình ALMA (Arnaud Legoux Moving Averages). Chỉ báo này giúp xác định tín hiệu mua khi giá ở vùng entry và bán khi giá phá vỡ khỏi trend tăng (up trend).
---
Cách sử dụng:
KV box có thể dùng trong giao dịch SPOT và FUTURE (Long/Short).
Mua khi có tín hiệu BUY, bán khi có tín hiệu SELL.
MUA:
• Entry: Khi có tín hiệu BUY.
• Cắt lỗ: thấp hơn giá thấp nhất cùa 2 nến đầu tiên trong hộp xuất hiện tín hiệu BUY của khung 1H, 4H, 1D.
• Chốt lời: Khi có tín hiệu SELL xuất hiện.
BÁN:
• Entry: Khi có tín hiệu SELL.
• Cắt lỗ: cao hơn giá cao nhất của 2 nến đầu tiên trong hộp xuất hiện tín hiệu SELL cùa khung 1H, 4H, 1D.
• Chốt lời: Khi có tín hiệu BUY xuất hiện.
---
Chú ý:
KV BOX chỉ hiển thị trên khung 1H, 4H và 1D. 1H cho giao dịch ngắn hạn (vài ngày), 4H cho giao dịch trung hạn (vài tuần), 1D cho giao dịch dài hạn (vài tuần đến vài tháng).
---
Tùy chọn setting:
- Kelvin box on: kích hoạt KV BOX
- ALMA method on: kích hoạt KV box theo phương pháp Arnaud Legoux Moving Averages (ALMA)
- Pinbar indicator: kích hoạt chỉ báo khi xuất hiện nến pinbar đảo chiều
- Supertrend: chỉ báo xu hướng tiếp diễn hoặc đảo chiều

Sagar sir - N Continuous candle green with +ve % changeThis script will plot labels based on N number of continuous green candle with +ve % change.

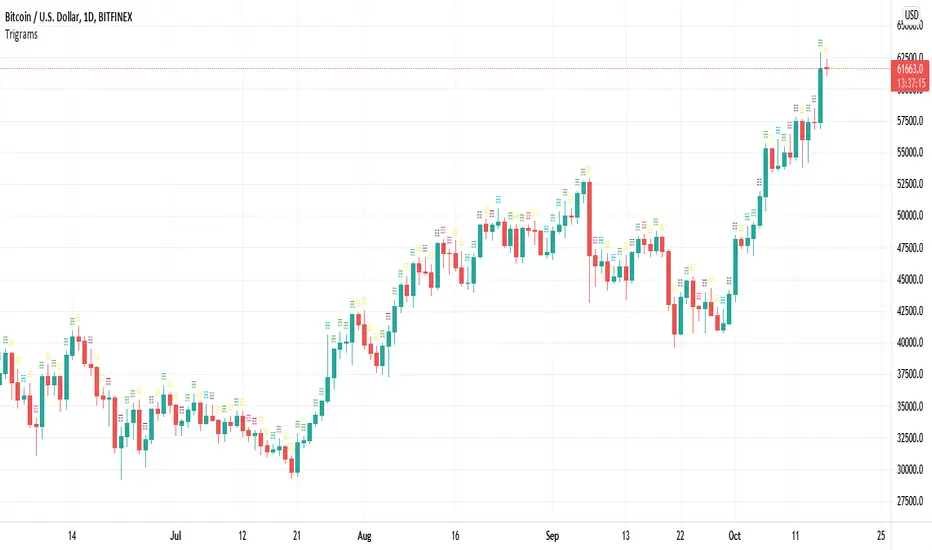
Trigrams based on Candle PatternThis script matches a Trigram for the current candle from its pattern Bullish/Bearish: Marubozu, Hammer, Inverted Hammer, Spinning Top.
The source for Trigram to candlestick pattern can be found online. I'm missing the reputation to add the link here.
Heaven = Bearish Marubozu
Earth = Bullish Marubozu
Thunder = Bearish Spinning Top
Water = Bullish Inverted Hammer
Mountain = Bullish Hammer
Wind = Bullish Spinning Top
Flame = Bearish Hammer
Lake = Bearish Inverted Hammer
The idea is simple. It takes the current candles pattern to match the Trigram.
Inspired by the Trigram Script from ByzantineSC
Anyways, not sure what use it is yet, but if there is anyone else out there interested in I Ching, Yin/Yang theory and trading, this is for you.
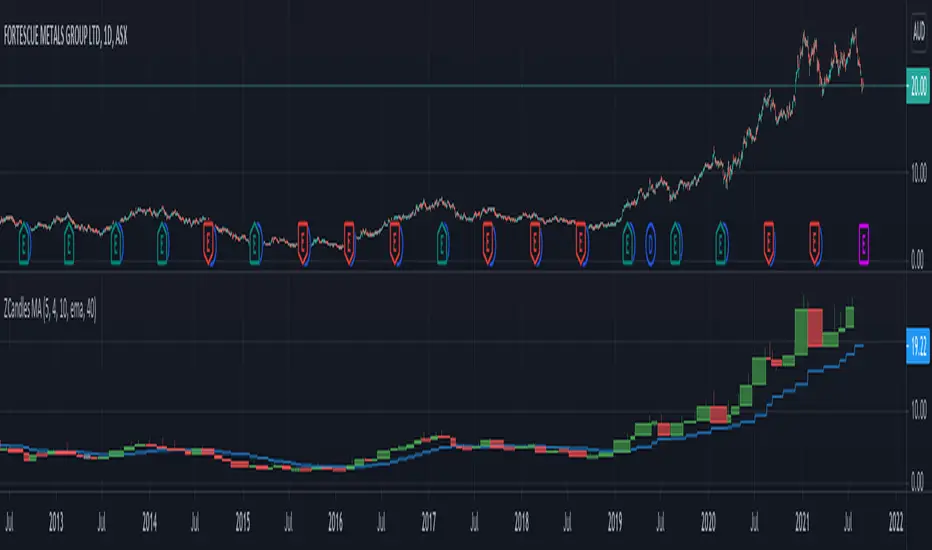
Zigzag Candles MAWe have the candles here: Zigzag-Candles
Lets create moving average!!
Just simple moving average at the moment. Since, items are in array. Not so easy to use standard functions of pine. Hence, will take that for future enhancements.
ATR and Supertrend next!!
Zigzag CandlesCan't deny that I am obsessed with zigzags. Been doing some crazy experiments with it and have many more in pipeline. I believe zigzag can be used to derive better trend following methods. Here is an attempt to visualize zigzag as candlesticks. Next steps probably to derive moving average, atr (although there was an attempt of AZR made earlier) and probably supertrend too ;)
Input parameters include ZigzagLength (to calculate zigzag) and CandleSize (number of zigzag pivots in each candle)
CandleSize can be 3 or more. Every time we collect pivots which are equal to CandleSize, we derive one candle. And when we derive a candle, we remove all old pivots except the last one. Becauase, the last pivot acts as open to the next bar and is required.
Body of the candle tells the start and end zigzag pivot in the range. And Wicks signify highest and lowest pivots in the range. High and Low wicks are placed at the pivot where high and lows are formed. Hence, you can see them at different positions each time.
Thanks to @RicardoSantos for suggesting boxes for candles - while I was trying to achieve this with plotbar

Prophit Ninja: Hidden ScrollStay ahead of the markets moves with "Prophit Ninja: Hidden Scroll".
Our legendary senseis have mastered the arts of wielding the Katana and Shuriken over many decades of focused practice and distilled their systems and techniques down to their most vital form- storing their knowledge in this ancient scroll for easy adoption by any ninja practiced enough to be able to decipher it.
═════════════════════════════════════════════════════════════════════════
█ INTERPRETATION
Each sub-indicator in this package can be used as a confirmation tool to check your bias and give you a more informed decision as they all take into account every reading shown and not shown being calculated across all Prophit Ninja packages. A sentiment rating below the candle shows bullish bias while a green color emphasizes bullish strength- a sentiment rating above the candle shows bearish bias while a red color emphasizes bearish strength- gold color signifies a strong turn in the market while grey/dark grey is a weak reading. A green trend sensei reading is bullish- while a red trend sensei reading is bearish. A green bull trade sensei label signifies a possible bullish trade set up, while a red bear label trade sensei signifies a possible bearish trade set up. Stat sensei gives you tick by tick multi-time frame readings to always keep you aware of the exact environment you're in. Lastly risk sensei will give you the most optimal least risk trade set-up based on user defined variables and give you tick by tick readings of your trade status. This can be used as a standalone decision-maker, or used in confluence with other indicator packages in our Prophit Ninja bundle to get higher precision.
═════════════════════════════════════════════════════════════════════════
█ OVERVIEW
1 — Sentiment Sensei: A toggle-able tick by tick rating system (0-100%) for each candle based on over 100 individual readings .
2 — Trend Sensei: A toggle-able background coloring that easily shows you the trend bias behind the moves.
3 — Trade Sensei: A toggle-able trade finder that finds confluent trade set-ups to give you the upper hand.
4 — Stat Sensei: A toggle-able multi-time frame candle progress tracker with a built in trend bias and price/volume/momentum change/ratio trackers.
5 — Risk Sensei: A toggle-able risk manager with two variations of auto profit target zones , three variations of trailing stop losses , a win/loss tracker , trade duration timer and all the information you need to stay updated with the status of your trade at a glance whether long or short.
═════════════════════════════════════════════════════════════════════════
█ EASY CUSTOMIZATION
i.imgur.com
With a fully customizable and easy-to-use input menu , this indicator gives you the ability to tailor your trading experience to your needs and see as much (or as little) information as you want to; presented in the manner you deem most viable with the following options in just a few clicks:
Indicator Package- This option allows you to switch between the four display modes available so in any moment you can completely change the metrics you’re reading in just two clicks. This allows you the ability to make decisions based on not only what you’re comfortable with; but also to find confirmation or disagreement with other systems instantly.
Color Theme- There are four color themes available which include original, colorful, monochrome and solid. These not only allow you a quick and easy way to change the colors to suit your style; they also make it so you can challenge your bias in an instant by viewing the data in a completely different way.
Dual Attack Modes- Whether you’re a scalper, day trader, swing trader, or investor; this option allows you to see the chart based on four different risk tolerance/time expectancy mentalities for the Katana and Shuriken separately in just two clicks. Investors can see what the scalpers are thinking and vice/versa to broaden their decision making and/or hone in when optimal.
Dual Sharpness Levels- This algorithm allows the user to display the data on five different smoothness levels for the Katana and Shuriken separately without suffering the inherent lag that accompanies most other indicators. Whether you like to see every tick of a choppy movement, or filter out the false signals into smooth readings, you can do so at any moment.
═════════════════════════════════════════════════════════════════════════
█ RISK SENSEI EXAMPLE
═════════════════════════════════════════════════════════════════════════
█ PRE-BUILT ALERTS
With Prophit Ninja: Hidden Scroll's built-in alerts you can enable alerts for any piece of the Hidden Scrollin just a few clicks. These alerts are way more specific and optimized than you can possibly achieve with the custom alert settings. Each checking for multiple possible activation triggers instead of one and populating the message field automatically so you can just click create.
═════════════════════════════════════════════════════════════════════════
As you can see; this ancient scroll has the ability to adapt to any reader or adversary and give those in control of its power the upper hand. Any mode of battle, any opponent, any circumstance- 'Prophit Ninja: Hidden Scroll' was polished by our finest artists to inform any reader and make sure they know when to attack, defend or simply allow the fight to play out by its easy-to-read coloring system. As long as you learn the techniques you'll have a much better chance of making the right decision than when you didn't.
This state-of-the-art tool is great for experienced traders, those who just started learning to trade, or anyone in between- truly made to suit the needs of any trader, in any moment, with any mindset (along with the other indicators in our Prophit Ninja bundle) you'll notice an immediate improvement in your market dexterity after learning it.
═════════════════════════════════════════════════════════════════════════
*everything displayed is part of the Prophit Ninja indicator bundle; this is an otherwise blank chart*

US 10 Yr Yield Fair ValueI calculate a fair value of the US 10 year yield applying a rolling regression (default 15 periods) with 2 different ratios.
Entry of long and short are based on differ and exit are based if yield high/low price is below/above the fair value -/+ 1 std dev.
Exit when long is based on if short is indicated or yield is inside the boundary of the FV value (+/-5% of FV for example)
Exit when short is when long is indicated.

LebahFX AccDist_CandlesLebahFX Indicator that showing Accumulation and Distribution Signal in HTF Candlestick
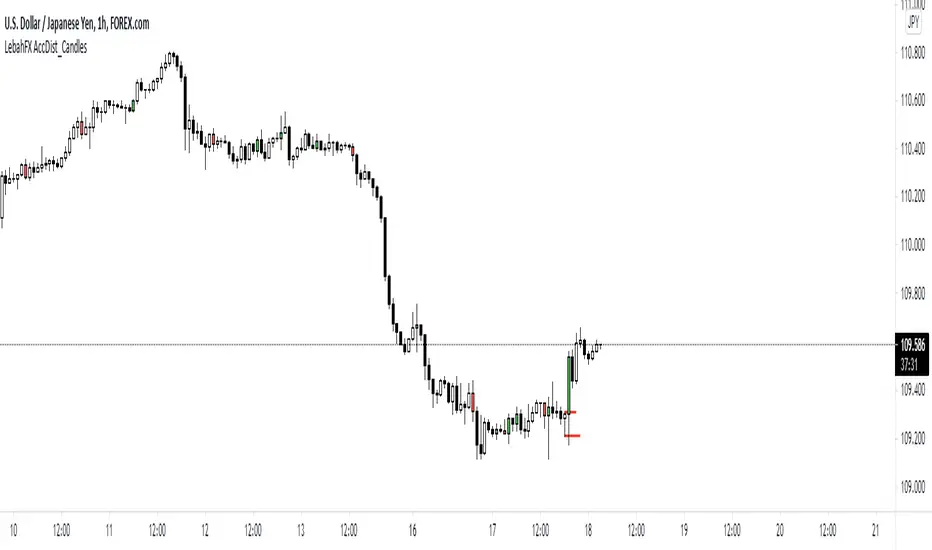
Price ActionFirst, you have to know price action, RTM price action Handbook could help you
this indicator shows you base and momentum candles
base candles could be zones of trade that show you fighting of bulls and bears, and momentum candles could show the power of those zones.
Base candles are white in the chart, and you can place your order at the good zone.
Rally candles and drop candles are momentum candles, and bold rally and bold drop show that it is more powerful than its before candle.
Zigzag compression is one way that shows the compression in trend.
it looks like the Wedges pattern at classic technical that shows pending orders are closed, so the target zone could be powerful to reverse the trend.
Black background of candle means that candle doesn't reach its before candle and so it is poor candle, I named it domination.
It is better to do not trade at poor candles.
At the end, I find Price action the best way to trade, and it makes you free of other indicator, even volume indicator.
This indicator is good for those who use price action strategy to trade and those who want to learn the price action.
It could be so helpful and reliable way to find the zones, and place buy or sell order and the target, specially for scalping.

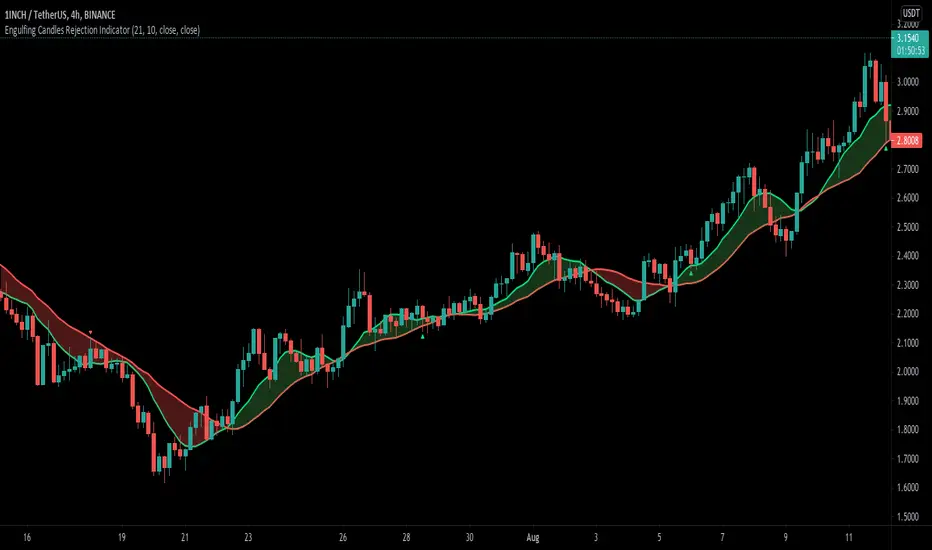
Engulfing Candle Rejection IndicatorThis indicator allows you to filter noisy chart, with engulfing candles which have been rejected from current trend lines. Trend lines by default are 21 MA (fast) and 10 MA (slow one). If fast moving average is greater than slower one, automatically indicator would represent that like uptrend, and if opposite then like a downtrend.
Consider to work only on higher time frames like 1H and higher, so you really can find only best entries.
Have fun, best wishes!
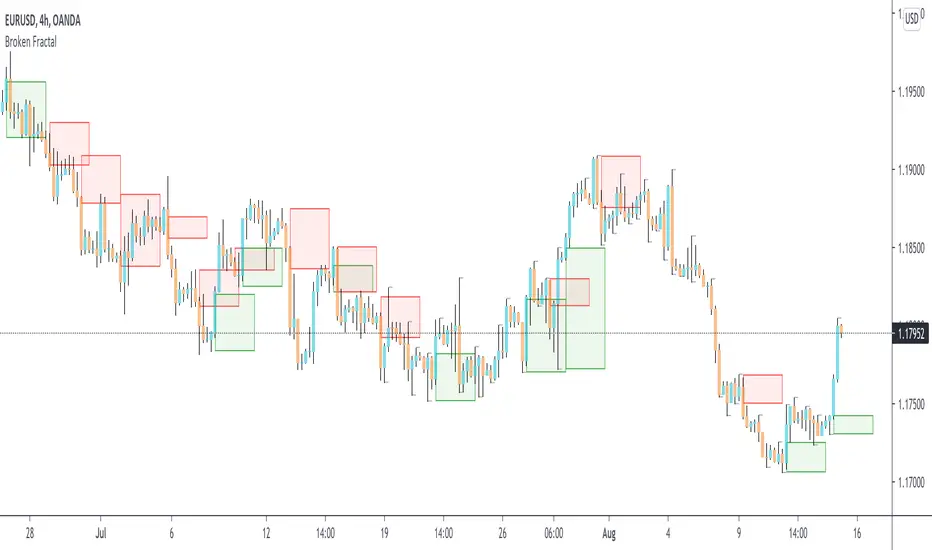
Broken Fractal : Someone's broken dream is your profit!Idea
The idea is simple : when market turns around, it traps a bunch of traders off guard. We trade with them, in the same direction of their exit!
Method
We let the market first create a fractal
We then let the market create an opposite fractal
We then let the market break the first fractal it created, thereby trapping lots of trades in the process
We then patiently wait till the market gives these trapped traders a chance to exit - and we trade in the same direction
How to use?
Green boxes are for long entry, red boxes are for short.
Whenever a box appears, that's the risk criteria - setup limit orders and trade along!
Works on all timeframes
If you like this script, please leave a note on how you are using it.
I personally use it with Higher Timeframe bias.
PS1 : some traders call this Break of market structure, some call it Breaker, I just call it "Broken Fractal"
PS2 : Break of a broken fractal is also very potent. Watch out for those!
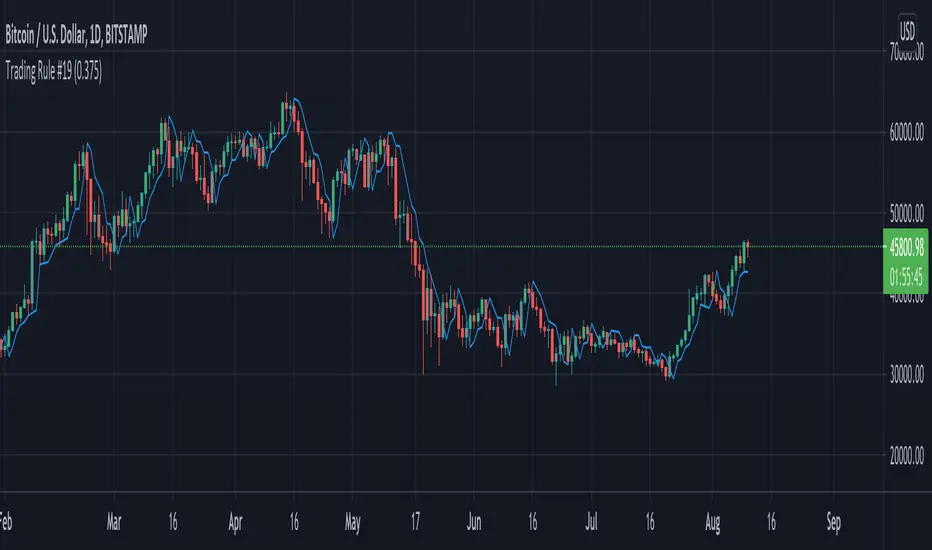
Trading Rule #19This script is based on Trading Rule #19 from Chester Keltner's book How To Make Money On Commodities. It is best applied to candlestick charts with longer time frames and plans with minimal losses (i.e. swing trades). The rule is based on "Key" trend days (this is applied to daily charts in the book).
An initial Key-Up day is established on the third day of 3 consecutive new highs. Subsequent key-up days are determined as follows:
1. The first day following an initial key-up day trades 0.375% above the previous key-up day
2. The second day or any following day trades 0.125% above the previous key-up day
An initial Key-Down day is established on the third day of 3 consecutive new lows. Subsequent key-down days are determined as follows:
1. The first day following an initial key-up day trades 0.375% below the previous key-down day
2. The second day or any following day trades 0.125% below the previous key-down day
Green candles are considered up-trend, red candles are down-trend. Gray candles are undecided - when there is a new high and low in the same time frame, when there is no new high or low in that time frame, or the order price was cleared.
Order prices are represented as a blue line, with some days being "na" when order prices remain unchanged. On key-up days, orders are placed 0.375% below the low of the previous key-up day or the day previous (whichever is lower). Order prices on key-down days are placed 0.375% above the high of the previous key-down day or the day previous (whichever is higher).
The tolerance setting mainly effects the plot point of order price, at a certain point key-trend rules will take priority over order price (meaning if tolerance is high enough, order price will have no effect on determining key-trends).
HammersPlots an arrow above a hammer candle or candle with big lower wick. Yellow signifies a candle with higher than average volume. Blue is a lower than average volume candle. Hammers/Lower Wick candles are best after a drop in price or near bottoms.

Weekly Options Expiry CandleThis script shows weekly expiry candle on daily chart. In weekly expiry, week starts on Friday and end on next Thursday.
How the candle is constructed:
Open= Open price of Friday, if Friday is a holiday, next available open price
High= Highest high price of Friday, Monday, Tuesday, Wednesday, Thursday
Low= Lowest low price of Friday, Monday, Tuesday, Wednesday, Thursday
Close=Close price of Thursday, if Thursday is a holiday, previously available close price
I am very new to Pine script, so waiting for your comments and review.

Bull and Bear Marubozus Candlestick PatternMarubozus are an interesting candle pattern wherein the close and open of the candle are also the high / low points of the candle. In other words, a candle with no shadows or wicks.
How reliable are they, though? Probably not very reliable on their own. It may also depend on the size of the candle. You would probably want to incorporate this candle pattern with other filters, like RSI, MACD, to filter trade opportunities.

No gaps candlesThis indicator repaints the candles so that every candle's open price is the previous candle's close price. This helps visualize stocks and ETFs that have big gaps, usually between trading days.
You should hide visibility of the ticker for this to be displayed properly.

xGhozt Consecutive Candle Count - BacktestxGhozt Consecutive Candle Count with Backtest simply counts consecutive positive or negative candles, and allows you to get the live statistics of how many times this consecutive candle series occurred in the past, with the probabilities of the next candle to be a reversal, and the average past gains from that reversal. You can select the number of consecutive candles you're tracking, and select a start and end date. When your desired pattern is met by the indicator, it will indicate you on the chart if it's worth shorting or longing the next candle.
You also have the possibility to set up alerts when your consecutive candles patterns are met. To do so, go into the indicator's settings, select your time frame, the consecutive number of candles you are tracking, your success rate, and the number this pattern occurred in the past. Once it's done, open the alerts box, and set up your alerts accordingly.
You will have 2 options:
- Green Candles Followed by Red = short next candle.
- Red Candles Followed by Green = long next candle
Now that the backtest is added, you can try different combinations and figure the best outcome to get the best returns!
One thing to note with the backtest: you cannot run the backtest with take profits / stop loss AND candle closing, it has to be one of the two.

Three (3)-Bar and Four (4)-Bar Plays StrategyThis strategy analyzes the three and four-bar play which is when price action has a wide igniting bar that has a full body, then one or two narrow bars which have a relatively equal high for long plays and relatively equal low for short plays, then a continuation bar. You should not take plays that will encounter resistance. The stop loss is placed for long plays below the 2nd bar (or 3rd bar for 4-bar play).
This is commonly used on 1m, 2m, 5m, and 10m charts.
Jared Wesley is one of the more notable traders that use this setup. You can edit as an input the start date, end date, igniting bar size, the body percentage of the igniting bar, the relative equality of the 2nd bar (and 3rd bar for 4-bar play) compared to the igniting bar, and profit multiplier.
