Engulfing Detector by RWBTradeLabEngulfing Detector by RWBTradeLab
A clean, non-repainting engulfing pattern detector designed for traders who rely on price action and candle confirmation.
What this indicator does
This script automatically identifies and highlights two types of engulfing patterns on closed candles only:
1. Regular Engulfing (R EG)
* Regular Buy EG: A bullish candle fully engulfs the previous bearish candle’s high.
* Regular Sell EG: A bearish candle fully engulfs the previous bullish candle’s low.
2. E-Regular Engulfing (ER EG)
* Detects “extended” engulfing setups where a strong base candle is followed by 2 or more opposite-color candles and then a confirming engulf close.
* Useful for spotting delayed but powerful reversals.
Visuals on chart
* A rectangle (box) is drawn from the base candle to the confirmation candle.
* Optional text labels appear above/below the box (offset adjustable).
* Separate color controls for:
- Regular Buy / Regular Sell
- E-Regular Buy / E-Regular Sell
Alerts
Built-in alerts trigger only at candle close:
* R Buy EG
* R Sell EG
* ER Buy EG
* ER Sell EG
Each alert includes price and time in the message.
Key settings
* Candle Length: Scans last N closed candles (running candle excluded).
* On/Off toggles: Enable/disable each engulfing type and labels individually.
* Text Offset (%): Controls label distance from the box.
Non-repainting confirmation
All signals and alerts are calculated using confirmed bars only.
No running-bar signals → no repainting.
Best use
Works on any market and timeframe. For higher reliability, combine with:
* Key S/R zones
* Trend direction
* Volume or structure confirmation
Disclaimer:
This indicator is a pattern-detection tool, not financial advice. Trading involves risk; always use proper risk management and confirm signals with your own analysis.
Creator: RWBTradeLab
If you find this useful, please leave a like ⭐ and share your feedback.
캔들스틱 분석

Myfxschool-HeatWave V25Introducing the MyFXSchool Leading Indicator™, a next-generation market prediction tool designed exclusively for traders who want accuracy, clarity, and early trend identification. Built using advanced price-action logic, institutional order-flow concepts, and dynamic volatility algorithms, this indicator gives you a true leading advantage—not just lagging signals.

Madstrat Strategy - Dual TF# Madstrat Strategy - Dual TF: Complete User Guide
## Overview
The Madstrat Strategy indicator is a comprehensive forex trading system that identifies high-probability trade setups based on a day-counting methodology combined with multi-timeframe EMA alignment analysis. It generates two primary signal types:
1. **Day 3 Signals** - Based on the GSD/RSD (Green Setup Day/Red Setup Day) counting system
2. **Pure Price Action (PA) Signals** - Based on EMA alignment across multiple timeframes with EQ rejection
The indicator operates on **two timeframe combinations simultaneously**:
- **15-minute / 1-hour** combo
- **30-minute / 2-hour** combo
---
## Section 1: Timeframe Signals
### Settings
| Input | Default | Description |
|-------|---------|-------------|
| Show 15m/1hr Signals | ✓ Enabled | Displays signals from the 15-minute LTF with 1-hour HTF confirmation |
| Show 30m/2hr Signals | ✓ Enabled | Displays signals from the 30-minute LTF with 2-hour HTF confirmation |
| Trade Levels Source | Most Recent | Determines which combo draws SL/TP levels |
### How It Works
Each timeframe combination operates independently with its own:
- Signal spacing rules (4 bars for 15m, 2 bars for 30m = both equal ~1 hour)
- Daily signal limits (3 Day 3 signals + 3 Pure PA signals per combo per day)
- EMA alignment checks on both LTF and HTF
**Trade Levels Source Options:**
- **15m/1hr** - Only 15m/1hr signals draw trade levels
- **30m/2hr** - Only 30m/2hr signals draw trade levels
- **Most Recent** - Whichever signal fires most recently draws levels (15m/1hr takes priority if both fire simultaneously)
---
## Section 2: Signal Colors
Customize the appearance of each signal type for each timeframe combination:
### 15m/1hr Combo
| Signal Type | Default Color |
|-------------|---------------|
| Day 3 Buy | Blue |
| Day 3 Sell | Red |
| Pure PA Buy | Aqua |
| Pure PA Sell | Fuchsia |
### 30m/2hr Combo
| Signal Type | Default Color |
|-------------|---------------|
| Day 3 Buy | Teal |
| Day 3 Sell | Orange |
| Pure PA Buy | Lime |
| Pure PA Sell | Maroon |
---
## Section 3: Enhanced FBR Rules
### What is FBR?
**FBR (Failed Breakout Retest)** occurs when price breaks below the previous week's low (or above the previous week's high) but fails to close outside the range, closing back inside instead. This signals a potential reversal and resets the day count to "Day 1" of a new setup sequence.
### Settings
| Input | Default | Description |
|-------|---------|-------------|
| Enable Enhanced FBR Rule | ✓ Enabled | Prevents FBR detection after a clean breakout |
| Show Clean Breakout Labels | ✓ Enabled | Displays labels when clean breakouts occur |
| Bull Breakout Label Color | Blue (25% transparent) | Background color for bullish breakout labels |
| Bear Breakout Label Color | Red (25% transparent) | Background color for bearish breakout labels |
### How Enhanced FBR Works
1. **Clean Breakout Detection**: A clean breakout occurs when price breaks AND closes outside the previous week's range
2. **FBR Blocking**: Once a clean breakout occurs in a week, FBR detection is disabled for the remainder of that week
3. **Weekly Reset**: Both clean breakout and FBR flags reset at the start of each new trading week (Sunday rollover)
### Label Types
- **"CLEAN BULL BO"** - Price broke above previous week high and closed above it
- **"CLEAN BEAR BO"** - Price broke below previous week low and closed below it
- **"FBR Day 1"** - Failed breakout retest detected, count reset to Day 1
---
## Section 4: Real-Time Day Labels
### Purpose
The real-time label shows a **live projection** of what today's day classification will be, updating throughout the trading session as price action develops.
### Settings
| Input | Default | Description |
|-------|---------|-------------|
| Enable Real-Time Day Labels | ✓ Enabled | Shows dynamic label that updates during trading |
| Real-Time Label Position | Right | Position of label relative to current candle |
| Real-Time Label Background | Yellow (20% transparent) | Background color |
| Real-Time Label Text | White | Text color |
### Label Text Meanings
| Label | Meaning |
|-------|---------|
| LIVE: GSD Day X | Projected Green Setup Day (after 2+ red days) |
| LIVE: GD Day X | Projected Green Day (continuing green trend) |
| LIVE: RSD Day X | Projected Red Setup Day (after 2+ green days) |
| LIVE: RD Day X | Projected Red Day (continuing red trend) |
| LIVE: INSIDE DAY | Price range is entirely within previous day's range |
| LIVE: FBR - GSD Day 1 | Bullish failed breakout retest detected |
| LIVE: FBR - RSD Day 1 | Bearish failed breakout retest detected |
| LIVE: ... CLEAN BULL BO | Clean bullish breakout detected |
| LIVE: ... CLEAN BEAR BO | Clean bearish breakout detected |
---
## Section 5: Daily Session Definition
### Instrument Presets
| Preset | Sunday Open | Friday Close | Rollover | Use Case |
|--------|-------------|--------------|----------|----------|
| Forex (FX Pairs) | 17:05 ET | 16:59 ET | 17:00 ET | EUR/USD, GBP/USD, etc. |
| Metals (XAU/XAG) | 18:05 ET | 16:59 ET | 17:00 ET | Gold, Silver |
| Custom | User-defined | User-defined | User-defined | Other instruments |
### Why This Matters
The indicator uses **OANDA-style daily rollover** (5 PM Eastern) rather than UTC midnight. This ensures:
- Accurate day counting for forex markets
- Correct GSD/RSD classification
- Proper weekly level calculations
### Session Break Line
| Input | Default | Description |
|-------|---------|-------------|
| Show Session Break Line | ✓ Enabled | Draws vertical line at daily rollover |
| Session Break Line Color | Black | Line color |
| Width | 2 | Line thickness (1-5) |
| Style | Solid | Solid, dashed, or dotted |
---
## Section 6: Day Labels (GSD/RSD System)
### The Core Day Counting Methodology
This is the foundation of the Madstrat Strategy:
1. **Green Day (GD)**: Daily candle closes higher than it opened
2. **Red Day (RD)**: Daily candle closes lower than it opened
3. **Green Setup Day (GSD)**: A green day that follows 2 or more consecutive red days
4. **Red Setup Day (RSD)**: A red day that follows 2 or more consecutive green days
### The Day 3 Signal
**Day 3** is when the setup is "mature" and ready for a trade:
- **GSD Day 3**: Third consecutive green day after a red sequence of 2+ days
- **RSD Day 3**: Third consecutive red day after a green sequence of 2+ days
### Settings
| Input | Default | Description |
|-------|---------|-------------|
| Max Historical Labels | 60 | Number of day labels to retain on chart |
| Show Day of Week Labels | ✓ Enabled | Shows M O N, T U E, etc. |
| Label Position | Top | Top or bottom of chart |
| Label Hour | 6 | Hour (0-23) when day labels appear |
| GSD/GD Label Background | Blue (25% transparent) | Green day label color |
| RSD/RD Label Background | Red (25% transparent) | Red day label color |
| Inside Day Label Background | Gray (25% transparent) | Inside day label color |
### Important Notes
- **Inside Days** do not increment the count - they are neutral
- **FBR events** reset the count to Day 1 and establish a new trend direction
- **Clean Breakouts** also reset to Day 1 but block further FBR detection that week
---
## Section 7: Daily Levels
Displays the previous day's key price levels:
### Available Levels
| Level | Default | Description |
|-------|---------|-------------|
| Previous Day's High (PDH) | ✓ Enabled, Blue | Highest price of previous session |
| Previous Day's Low (PDL) | ✓ Enabled, Green | Lowest price of previous session |
| Previous Day's EQ | ✓ Enabled, Black | Equilibrium (midpoint of PDH/PDL) |
| 75% Level | ✗ Disabled | 75% of previous day's range |
| 25% Level | ✗ Disabled | 25% of previous day's range |
### EQ Rejection (Critical for Signals)
The **EQ (Equilibrium)** level is crucial for signal generation:
- **Bullish EQ Rejection**: Price wicks down to touch EQ, then closes above it
- **Bearish EQ Rejection**: Price wicks up to touch EQ, then closes below it
The indicator tracks these rejections throughout the day and uses them as a key filter for both Day 3 and Pure PA signals.
---
## Section 8: Weekly Levels
### Previous Week Levels
| Level | Description |
|-------|-------------|
| PWH (Previous Week High) | Highest price of the completed previous week |
| PWL (Previous Week Low) | Lowest price of the completed previous week |
| PWEQ (Previous Week EQ) | Midpoint of PWH and PWL |
### Current Week Levels
| Level | Description |
|-------|-------------|
| WH (Week High) | Running high of the current week |
| WL (Week Low) | Running low of the current week |
| WEQ (Week EQ) | Running midpoint of current week |
### Settings
| Input | Default | Description |
|-------|---------|-------------|
| Show Weekly Levels | ✓ Enabled | Master toggle for all weekly levels |
| Show Previous Week High/Low/EQ | ✓ Enabled | PWH, PWL, PWEQ lines |
| Previous Week Line Color | Black | Color for PW levels |
| Previous Week Line Width | 2 | Thickness of PW lines |
| Show Current Week High/Low | ✓ Enabled | WH, WL lines (dashed) |
| Current Week Line Color | Blue | Color for current week levels |
| Show Weekly Level Labels | ✓ Enabled | Text labels at line ends |
| Weekly Label Size | Normal | Tiny to Huge |
| Lines & Labels End Day | Friday | Extend lines to which day |
---
## Section 9: Session Overlays
Visual boxes showing major forex trading sessions:
### Available Sessions
| Session | Default Times (ET) | Default State |
|---------|-------------------|---------------|
| Sydney | 18:00 - 02:00 | ✗ Disabled |
| Asian | 19:00 - 04:15 | ✓ Enabled |
| London | 01:00 - 11:15 | ✓ Enabled |
| New York | 07:30 - 17:15 | ✓ Enabled |
### Customization Options
For each session:
- Start/End Hour and Minute
- Timezone
- Background color (with transparency)
- Border color
- Border style (solid, dashed, dotted)
- Border width
### General Session Settings
| Input | Default | Description |
|-------|---------|-------------|
| Show Session Overlays | ✓ Enabled | Master toggle |
| Show Session Names on Boxes | ✓ Enabled | Display "Sydney", "Asia", etc. |
| Session Box Border Width | 1 | Border thickness |
| Session Name Text Color | Black | Label text color |
| Session Name Size | Normal | Tiny to Huge |
---
## Section 10: Chart Visuals (Moving Averages)
### Available Moving Averages
| MA | Default | Default Color | Purpose |
|----|---------|---------------|---------|
| 9 EMA | ✓ Shown | Green | Fast trend |
| 18 EMA | ✓ Shown | Orange | Medium trend |
| 50 EMA | ✓ Shown | Blue | Slow trend |
| 50 SMA | ✓ Shown | Purple | Alternative slow trend |
| 200 EMA | ✗ Hidden | Red | Long-term trend |
### EMA Alignment Requirement
For signals to fire, the EMAs must be properly "stacked":
**Bullish Alignment:**
```
Price > 9 EMA > 18 EMA > 50 EMA
```
**Bearish Alignment:**
```
Price < 9 EMA < 18 EMA < 50 EMA
```
This alignment must be present on **both** the LTF (15m or 30m) **and** the HTF (1hr or 2hr) for a signal to generate.
---
## Section 11: Signal Filters
### EQ Rejection Recency
| Input | Default | Description |
|-------|---------|-------------|
| EQ Rejection Recency (bars) | 4 | EQ rejection must occur within this many bars |
On a 15-minute chart, 4 bars = 1 hour. This ensures the EQ rejection is "fresh" and relevant.
### Session Filter
| Input | Default | Description |
|-------|---------|-------------|
| Enable Session Filter | ✗ Disabled | Only allow signals during selected sessions |
| Allow Sydney Session Signals | ✓ Enabled | (Only applies if filter enabled) |
| Allow Asian Session Signals | ✓ Enabled | |
| Allow London Session Signals | ✓ Enabled | |
| Allow New York Session Signals | ✓ Enabled | |
### ADX Filter
| Input | Default | Description |
|-------|---------|-------------|
| Enable ADX Filter | ✓ Enabled | Require minimum trend strength |
| ADX Threshold | 20.0 | Minimum ADX value (5.0 - 50.0) |
The ADX (Average Directional Index) measures trend strength. Values above 20-25 indicate a trending market suitable for directional trades.
---
## Section 12: Signal Types Explained
### Day 3 Signals (Primary)
Day 3 signals come in two forms:
#### Day 3 Detected (Live)
Fires when the **current day is projected** to become Day 3 based on real-time price action. This is an early signal that may change if the daily candle reverses before close.
#### Day 3 Confirmed
Fires when Day 3 has been **officially confirmed** by the previous day's close. This is a more reliable signal as the day count is locked in.
**Requirements for Day 3 Buy:**
1. GSD Count = 3 (confirmed) OR Projected GSD Count = 3 (live)
2. Not an inside day (current or previous)
3. Recent bullish EQ rejection (within recency bars)
4. Bullish EMA alignment on LTF
5. Bullish EMA alignment on HTF
6. Adequate candle body (not all wick)
7. ADX above threshold (if enabled)
8. Within allowed session (if filter enabled)
9. Signal spacing requirement met
10. Less than 3 Day 3 signals already today for this combo
**Day 3 Sell** - Same requirements but bearish (RSD Count = 3, bearish alignment, bearish EQ rejection)
### Pure PA Signals (Secondary)
Pure PA signals also come in two forms:
#### Pure PA Detected (LTF Only)
Fires when the **lower timeframe conditions** are met but HTF confirmation is still pending. This is an early warning that a full signal may be imminent.
#### Pure PA Confirmed (LTF + HTF)
Fires when **both LTF and HTF** conditions are aligned. This is the full confirmation signal.
**Requirements for Pure PA Buy:**
1. Recent bullish EQ rejection
2. Bullish EMA alignment on LTF (Price > 9 > 18 > 50)
3. Bullish EMA alignment on HTF (Price > 9 > 18 > 50)
4. Adequate candle body ratio (≥30%)
5. ADX above threshold on LTF
6. Not currently an inside day
7. Signal spacing requirement met
8. Less than 3 Pure PA signals already today for this combo
9. Within allowed session (if filter enabled)
**Pure PA Sell** - Same requirements but bearish
---
## Section 13: Trade Levels
When a signal fires, the indicator can draw:
| Level | Style | Description |
|-------|-------|-------------|
| Stop Loss (SL) | Red dashed | Entry price ± (ATR × 1.5) |
| Take Profit 1 | Green dashed | 1:1 Risk/Reward |
| Take Profit 2 | Green dotted | 2:1 Risk/Reward |
| Take Profit 3 | Green dotted | 3:1 Risk/Reward |
These levels use a 14-period ATR for the stop loss calculation.
---
## Section 14: Debug Table
Enable **Show Debug Table** to display real-time diagnostic information:
### Information Displayed
| Category | Variables |
|----------|-----------|
| Day Counting | GSD Count, RSD Count, Projected GSD, Projected RSD |
| Day State | Is Projected D3?, Currently Inside?, Week Has FBR?, Clean Breakout (Week)? |
| 15m/1hr Combo | LTF Bull/Bear Positioning, HTF Bull/Bear Positioning, D3/PA Signals Today, Signal Spacing OK |
| 30m/2hr Combo | LTF Bull/Bear Positioning, HTF Bull/Bear Positioning, D3/PA Signals Today, Signal Spacing OK |
| Shared | EQ Rejection Recent (Bull/Bear), Session Filter OK, 15m ADX, 30m ADX, Trade Levels Source |
Green cells = condition met (true)
Red cells = condition not met (false)
Gray cells = informational values
---
## Section 15: Alert Settings
The indicator features a comprehensive **enhanced alert system** with granular control over when and how alerts fire.
### Alert Settings Inputs
| Input | Default | Description |
|-------|---------|-------------|
| Enable Dynamic Alerts | ✓ Enabled | Master toggle for all dynamic alerts with detailed messages |
| Day 3 Detected (Live) | ✓ Enabled | Alert when Day 3 is projected based on current price action |
| Day 3 Confirmed | ✓ Enabled | Alert when Day 3 is officially confirmed |
| Pure PA Detected (LTF) | ✓ Enabled | Alert when LTF conditions are met (early warning) |
| Pure PA Confirmed (LTF+HTF) | ✓ Enabled | Alert when both LTF and HTF conditions align |
### Alert Message Format
All dynamic alerts follow a standardized format for easy parsing:
```
TYPE | SYMBOL @ PRICE | DAY_CLASS | SESSION | DIRECTION | COMBO
```
**Example alerts:**
```
D3 DETECTED | EURUSD @ 1.08542 | GSD Day 3 | London | BUY | 15m/1hr
D3 CONFIRMED | GBPJPY @ 192.456 | RSD Day 3 | New York | SELL | 30m/2hr
PA DETECTED | XAUUSD @ 2345.67 | GSD Day 2 | Asian | BUY | 15m/1hr (LTF only)
PA CONFIRMED | EURJPY @ 164.123 | RSD Day 1 | London | SELL | 30m/2hr
```
### Alert Types Explained
| Alert Type | Meaning | Use Case |
|------------|---------|----------|
| **D3 DETECTED** | Day 3 projected based on current candle | Early entry opportunity; may invalidate if candle reverses |
| **D3 CONFIRMED** | Day 3 locked in from previous close | Higher confidence entry; day count is confirmed |
| **PA DETECTED** | LTF alignment met, waiting for HTF | Heads-up alert; prepare for potential entry |
| **PA CONFIRMED** | Both LTF and HTF aligned | Full confirmation; ready to execute |
### TradingView Alert Dialog Options
When creating an alert in TradingView, you'll see these condition options in the dropdown:
#### Day 3 Detected (Live Projection)
- D3 Detected: Buy 15m/1hr
- D3 Detected: Sell 15m/1hr
- D3 Detected: Buy 30m/2hr
- D3 Detected: Sell 30m/2hr
#### Day 3 Confirmed
- D3 Confirmed: Buy 15m/1hr
- D3 Confirmed: Sell 15m/1hr
- D3 Confirmed: Buy 30m/2hr
- D3 Confirmed: Sell 30m/2hr
#### Pure PA Detected (LTF Only)
- PA Detected: Buy 15m/1hr
- PA Detected: Sell 15m/1hr
- PA Detected: Buy 30m/2hr
- PA Detected: Sell 30m/2hr
#### Pure PA Confirmed (LTF + HTF)
- PA Confirmed: Buy 15m/1hr
- PA Confirmed: Sell 15m/1hr
- PA Confirmed: Buy 30m/2hr
- PA Confirmed: Sell 30m/2hr
#### Combined Alerts (Any Combo)
- D3 Detected: Any Buy
- D3 Detected: Any Sell
- D3 Confirmed: Any Buy
- D3 Confirmed: Any Sell
- PA Confirmed: Any Buy
- PA Confirmed: Any Sell
#### Master Alerts
- ALL Day 3: Any Buy
- ALL Day 3: Any Sell
- ALL PA: Any Buy
- ALL PA: Any Sell
### Setting Up Alerts
1. **Click the Alert icon** in TradingView (or press Alt+A)
2. **Select the indicator** "Madstrat Strategy - Dual TF"
3. **Choose the condition** from the dropdown (e.g., "D3 Confirmed: Any Buy")
4. **Configure notification options** (popup, email, webhook, etc.)
5. **Set alert name** and click "Create"
### Recommended Alert Configurations
**Conservative Approach:**
- Enable only "Day 3 Confirmed" and "PA Confirmed" alerts
- These fire after full confirmation on both timeframes
**Aggressive Approach:**
- Enable all alert types including "Detected" alerts
- Get early warnings but verify manually before entry
**Session-Specific:**
- Create separate alerts for each session you trade
- Use the session filter to limit when signals can fire
---
## Section 16: Signal Identification on Chart
| Shape | Text | Meaning |
|-------|------|---------|
| ▲ Triangle Up | D3-15 | Day 3 Buy from 15m/1hr combo |
| ▲ Triangle Up | D3-30 | Day 3 Buy from 30m/2hr combo |
| ▼ Triangle Down | D3-15 | Day 3 Sell from 15m/1hr combo |
| ▼ Triangle Down | D3-30 | Day 3 Sell from 30m/2hr combo |
| ◆ Diamond | PA-15 | Pure PA signal from 15m/1hr combo |
| ◆ Diamond | PA-30 | Pure PA signal from 30m/2hr combo |
---
## Quick Start Guide
### Recommended Setup for Forex
1. **Timeframe**: Apply indicator to a 15-minute chart
2. **Instrument Preset**: Select "Forex (FX Pairs)"
3. **Enable both** 15m/1hr and 30m/2hr signals initially
4. **Trade Levels Source**: "Most Recent"
5. **ADX Filter**: Enabled with threshold 20
6. **Alerts**: Enable "D3 Confirmed" and "PA Confirmed" for reliable signals
### Reading Signals
1. Look for **Day 3 signals** (triangles) as primary entries
2. Use **Pure PA signals** (diamonds) as supplementary entries
3. Check the debug table to understand why signals did/didn't fire
4. Reference the real-time day label to anticipate upcoming Day 3 opportunities
### Alert Strategy
**For active monitoring:**
- Enable "Detected" alerts as early warnings
- Manually verify conditions before entry
**For set-and-forget:**
- Enable only "Confirmed" alerts
- Trust the full confirmation system
---
## Troubleshooting
### No Signals Appearing?
Check the debug table for:
1. **EQ Rejection Recent** - Is there a recent EQ rejection?
2. **LTF/HTF Positioning** - Are EMAs properly aligned?
3. **GSD/RSD Count** - Is it actually Day 3?
4. **Currently Inside?** - Inside days block signals
5. **Signal Spacing OK** - Has enough time passed since last signal?
6. **ADX value** - Is it above the threshold?
### Day Labels Not Matching Expected Count?
- Verify **Instrument Preset** matches your trading instrument
- Check if an **FBR** or **Clean Breakout** reset the count
- **Inside days** don't increment the count
- Week resets occur at **Sunday 5 PM ET** for forex
### Alerts Not Firing?
1. Ensure **Enable Dynamic Alerts** is checked
2. Verify the specific alert type is enabled (D3 Detected, D3 Confirmed, etc.)
3. Check that the alert condition is properly set up in TradingView
4. Confirm signal filters (session, ADX) aren't blocking the signal
### Understanding Detected vs Confirmed
| Scenario | Detected Alert | Confirmed Alert |
|----------|----------------|-----------------|
| Current day projected to be Day 3, candle still open | ✓ Fires | ✗ Won't fire |
| Previous day closed as Day 3, conditions met today | ✓ May fire | ✓ Fires |
| LTF aligned, HTF not yet aligned | ✓ PA Detected fires | ✗ PA Confirmed won't fire |
| Both LTF and HTF aligned | ✓ May fire | ✓ PA Confirmed fires |
---
## Glossary
| Term | Definition |
|------|------------|
| **GSD** | Green Setup Day - Green day following 2+ red days |
| **RSD** | Red Setup Day - Red day following 2+ green days |
| **GD** | Green Day - Regular green day (not a setup) |
| **RD** | Red Day - Regular red day (not a setup) |
| **FBR** | Failed Breakout Retest - Price breaks weekly level but closes back inside |
| **EQ** | Equilibrium - Midpoint of previous day's range |
| **LTF** | Lower Timeframe (15m or 30m) |
| **HTF** | Higher Timeframe (1hr or 2hr) |
| **PWH/PWL** | Previous Week High/Low |
| **PDH/PDL** | Previous Day High/Low |
| **Clean Breakout** | Price breaks AND closes outside previous week's range |
---
This documentation covers the complete functionality of the Madstrat Strategy - Dual TF indicator including the enhanced alert system. For further assistance with specific scenarios or edge cases, enable the debug table and analyse the real-time variable states.

Straddle and Strangle Premium# Straddle and Strangle Indicator
## Overview
The **BCA Fixed Straddle and Strangle** indicator is a powerful tool designed for options traders to analyze the combined premium behavior of Straddle and Strangle strategies on Indian indices (NIFTY, BANKNIFTY, FINNIFTY, etc.). Unlike simple premium adders, this indicator visualizes the **combined price action as a true candlestick chart**, allowing for precise technical analysis on the strategy itself.
It integrates essential technical indicators—SuperTrend, VWAP, Moving Averages, and Dynamic Support/Resistance—directly onto the combined premium chart, helping traders make informed decisions based on the net value of their positions.
## Key Features
### 1. Accurate Combined Premium Chart
- **True Candlesticks**: Displays the combined Open, High, Low, and Close of the CE and PE options.
- **Spread Ticker Logic**: Uses TradingView's spread syntax (e.g., `NIFTY25DEC26000C + NIFTY25DEC26000P`) to ensure mathematically accurate High/Low calculations, avoiding the "fake wicks" common in simple addition scripts.
- **Toggle View**: Switch between a clean Candlestick chart and a simple Line chart.
### 2. Comprehensive Premium Table (5-Strike Ladder)
- Displays a real-time table on the chart overlay.
- Shows the **Selected Strike** (Center) plus **2 Strikes Above** and **2 Strikes Below**.
- For each strike, view the individual **CE Price**, **PE Price**, and **Combined Premium**.
- Helps in quickly spotting better premiums or potential adjustments without changing inputs.
### 3. Built-in Technical Analysis
Analyze the combined premium just like a regular stock:
- **SuperTrend**: Identifies the trend direction (Bullish/Bearish) of the combined premium.
- **VWAP (Volume Weighted Average Price)**: A key benchmark for intraday direction.
- **Moving Averages**: Configurable SMA, EMA, WMA, or RMA to track momentum.
- **ATR Stop Loss**: Dynamic trailing stop-loss levels based on volatility.
- **Dynamic Support & Resistance**: Automatically plots Swing Highs and Swing Lows to identify breakout or breakdown levels.
### 4. Flexible Strategy Selection
- **Fixed Straddle**: Select a single strike for both CE and PE.
- **Fixed Strangle**: Select different strikes for CE and PE.
- **Multi-Index Support**: Ready-to-use presets for NIFTY, BANKNIFTY, FINNIFTY, MIDCPNIFTY, SENSEX, and BANKEX.
- **Custom Symbol**: Option to manually input any other symbol.
## How to Use
1. **Select Chart Type**: Choose between "Fixed Straddle" or "Fixed Strangle".
2. **Set Symbol & Expiry**: Choose your index (e.g., NIFTY) and enter the Expiry Date (YYYY-MM-DD).
3. **Enter Strikes**:
* For **Straddle**: Enter the ATM strike.
* For **Strangle**: Enter the specific CE and PE strikes.
4. **Analyze**:
* Use the **Candlestick Chart** to read price action.
* Watch for **SuperTrend** flips for trend changes.
* Use **VWAP** as a dynamic support/resistance reference.
* Monitor the **Table** to compare premiums across nearby strikes.
## Alerts
The indicator includes built-in alert conditions for automation:
- **SuperTrend Change**: Bullish/Bearish flips.
- **VWAP Cross**: Price crossing above or below VWAP.
- **Support/Resistance Break**: Price breaking key swing levels.
---
*Designed for precision options analysis.*

B/B Timeframe This indicator showcases the current state of every timeframe. (Bullish / Bearish)
Keeps it in check at all times and changes the changes are happening live.

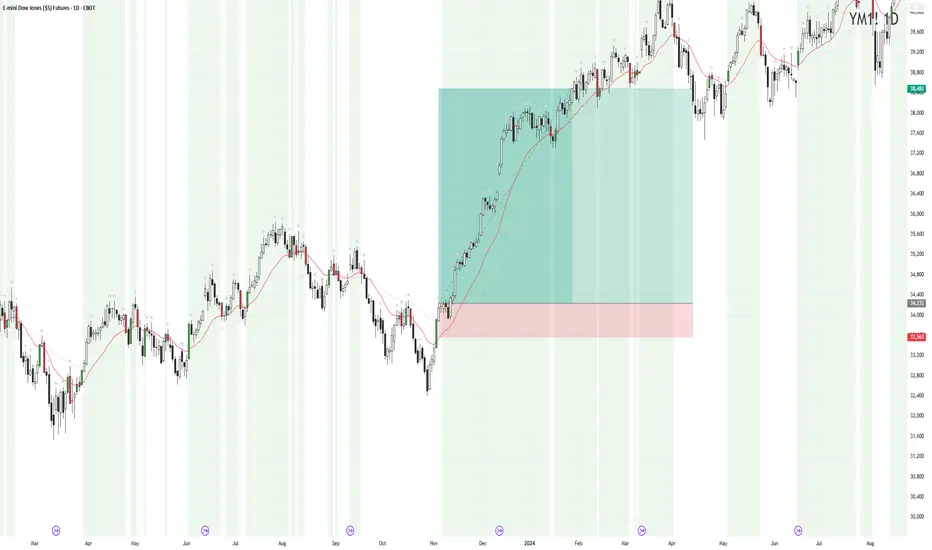
BB TrendDisclaimer: This Script works on daily chart for stocks. No SELL signal offered.
How to Use:
If BUY signal is shown on the chart, please take entry in the beginning of next candle.
please comment, if you find this useful.

Volume Pulse [ziksfx]Volume Pulse is a clean volume indicator designed to make it easier to read meaningful changes in activity without cluttering your chart. It enhances the standard volume view by supporting both classic volume and dollar volume , highlighting spikes and extreme bars and adding a compact label on the latest bar so you always see the current volume value at a glance. The script is intended to be used in a separate volume pane.
How it works
– Supports two modes: standard volume or dollar volume (close × volume).
– Colors volume bars by candle direction (up/down). Optionally, it can:
• highlight volume spikes above a moving average;
• mark the highest-volume bar over a user-defined lookback period.
– Plots a simple moving average of volume so you can quickly see when activity is above or below typical levels.
– On the latest bar, shows a small label with the current volume value, automatically abbreviated (K / M / B) and optionally prefixed with “$” in dollar-volume mode.
Inputs & customization
– Volume type: choose between standard volume and dollar volume.
– Volume MA length: controls how sensitive the moving average is to recent changes in activity.
– Spike highlighting: optional, turns on/off coloring for bars where volume exceeds the moving average.
– Highest-volume bar lookback: sets the period for detecting the highest-volume bar.
– Label position: choose whether the last-bar label appears on the left or right side of the bar, and optionally shift it slightly above the bar for better readability.
Use cases
Use Volume Pulse to:
– Spot sudden spikes in volume and compare them to the recent average.
– Identify sessions or candles with unusually high activity relative to a chosen TF.
– Visually study how volume behaves around price moves, breakouts or potential fakeouts to better understand their strength or weakness.
– Keep track of the latest bar’s volume instantly, without having to read the raw scale values.
This indicator works on any symbol that has volume data (stocks, futures, crypto and more), but volume quality may vary between markets and instruments. It is intended as an analytical and educational tool only: it does not constitute financial advice and does not provide or guarantee any trading results. Always combine volume context with your own analysis and risk management.

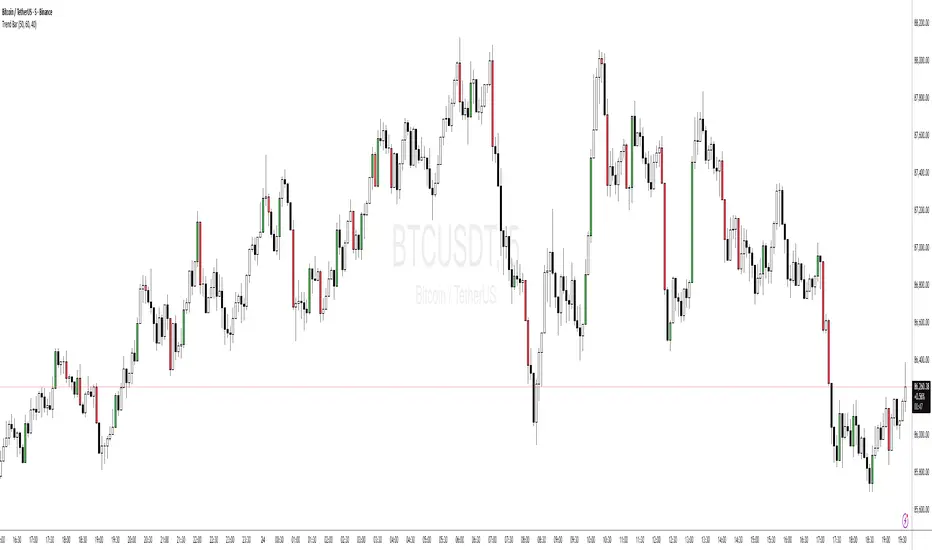
Price Action - Trend BarFrom Al Brooks' "Trading Price Action Trends," this indicator colors strong trend bars. Bull trend bars (green body ≥50%, close ≥60% up range, larger than 1.5x average) highlight buyer control, while bear trend bars (red body ≥50%, close ≤40% down range) show seller dominance. Use to identify trend resumption or climaxes. Philosophy: Trends persist until tested—focus on high-probability entries after pullbacks, avoiding barbwire noise.
Price Action - Inside/Outside BarsThis indicator highlights Inside and Outside bars based on Al Brooks' price action philosophy from "Reading Price Charts Bar by Bar." Inside bars (high ≤ previous high and low ≥ previous low) represent contraction and potential breakouts, often leading to two-legged moves. Outside bars (high > previous high and low < previous low with min body 50%) signal volatility and possible reversals or trends. Customizable highlights, lines, and labels help identify high-probability setups in trends or ranges. Always focus on context—buy low, sell high, and wait for confirmation.

Reversal Candlestick Setups (Doji, Outside, Extreme, Wick)Reversal Candlestick Setups – Doji, Outside, Extreme & Wick
This indicator identifies four high-probability reversal candlestick patterns across all timeframes: Doji Reversals, Outside Reversals, Extreme Reversals, and Wick Reversals. Each setup is based on clearly defined quantitative rules, allowing traders to filter noise and focus on strong reversal signals instead of relying on subjective visual interpretation.
The tool automatically scans every candle, highlights qualifying patterns on the chart, and provides alert options for both bullish and bearish versions of all four setups. This makes it suitable for intraday traders, swing traders, and positional traders seeking early reversal confirmation.
Included Setups
1. Doji Reversal Setup
Identifies candles with extremely small bodies relative to their range, combined with a smaller-than-average bar size. Useful for spotting market indecision before a directional shift.
2. Outside Reversal Setup
Flags candles that engulf the previous candle’s high–low range and exceed the average range by a multiplier. This is designed to capture strong momentum reversals driven by aggressive buying or selling.
3. Extreme Reversal Setup
Highlights large-bodied candles that dominate their overall range and exceed twice the average bar size. These signals aim to catch climactic exhaustion and institutional-level reversals.
4. Wick Reversal Setup
Detects candles with long rejection wicks, small bodies, and closes near an extreme of the range, supported by above-average bar size. Ideal for identifying sharp intrabar rejections.
Key Features
• Automatically detects all four reversal setups
• Works on all timeframes and symbols
• Customizable variables for deeper testing and optimization
• Clear bullish and bearish labels directly on the chart
• Fully integrated alert conditions for real-time notifications
• Suitable for crypto, stocks, indices, forex, and commodities
Who This Indicator Is For
• Traders who want objective, rule-based reversal detection
• Price action traders looking to enhance accuracy
• Systematic traders wanting quantifiable candlestick criteria
• Beginners learning reversal structures with visual guidance
• Professionals integrating reversal patterns into algorithmic or discretionary systems
How to Use
Add the indicator to your chart and enable alerts for the specific setups you want to track (e.g., “Bullish Wick Reversal”). Combine these signals with market structure, trend filters, volume analysis, or momentum indicators for increased conviction.

MicroX- in side bar 4-7In Side bar
Shading the range of the host candle for a group of 4-7 candles makes it easier to read the movement.
تظليل نطاق الشمعة الحاضنة لمجموعة من الشموع 4-7 لتسهيل قراءة الحركة

Candle day/hourThis indicator displays a short label on each bar showing the day of week on daily charts and the hour on hourly charts. It supports multiple timezones and allows customization of label color, background, and font size.

HalfTrend + Trend AliThis indicator combines the structural logic of the HalfTrend system with a trend filter built on the Hull Moving Average to provide a clearer view of potential market turning points.
The HalfTrend method reacts to price extremes using adaptive deviations, offering a dynamic representation of local highs and lows. By integrating a Hull MA trend filter, the script focuses only on signals that appear in harmony with the prevailing directional bias, helping reduce noise that may occur during counter-trend fluctuations.
🔹 How It Works
The HalfTrend algorithm tracks price swings using amplitude-based detection and ATR-derived channel deviation.
A trend switch is detected when price moves beyond the boundaries of the current swing structure.
The Hull Moving Average acts as a fast-reacting trend reference. Only signals that align with the Hull direction are highlighted.
To maintain clarity and avoid clustered notifications, the script displays only one signal per confirmed trend phase.
🔹 What the Signals Represent
Buy signals appear when the HalfTrend structure shifts upward and the Hull MA confirms an uptrend.
Sell signals appear when the structure shifts downward and the Hull MA confirms a downtrend.
Both signal types include optional alerts for traders who want to be notified immediately when conditions change.
🔹 Purpose
This tool is intended for traders who want to observe structural trend shifts together with a clean and responsive trend filter. It does not attempt to predict the market; instead, it highlights moments when short-term reversals and broader trend direction are aligned.
🔹 Notes
The indicator does not repaint the signals once confirmed.
It can be applied to any market or timeframe.
Users may combine it with their own risk management or additional confirmation tools.

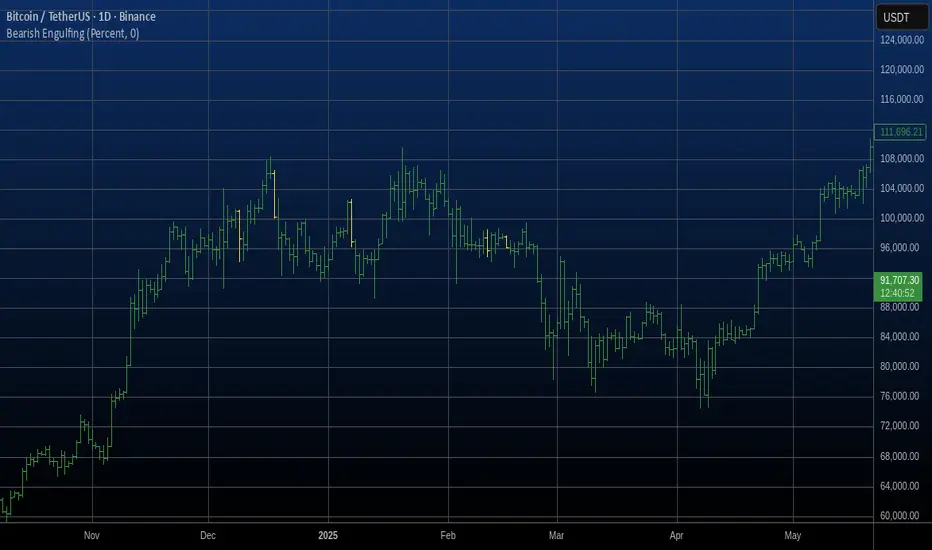
Bearish Engulfing Automatic Finding Script This is a bearish pattern formed by three candlesticks.
The pattern is based on the fact that the last candlestick must
completely engulf the previous two and be downward. The two preceding
candlesticks must also be upward. Candlestick wicks are not taken
into account.
Daily Candle by NatantiaIntroduction to the Daily Candle Indicator
The Daily Candle Indicator is a powerful and customizable tool designed for traders to visualize daily price action on any chart timeframe.
This Pine Script (version 5) indicator, built for platforms like TradingView, overlays a single candle representing the day's open, high, low, and close prices, with options to adjust its appearance and session focus.
Key Features:
Customizable Appearance: Users can set the colors for bullish (default green) and bearish (default white) candles, as well as the wick color (default white). The horizontal offset and candle thickness can also be adjusted to fit the chart layout.
Dynamic Updates: The candle updates on the last bar, with wicks drawn to reflect the daily high and low, providing a clear snapshot of the day's price movement.
This is the same version as before, but we had to republish it because the chart contained other indicators, which violated the publication rules. We apologize for the inconvenience.
Have a nice trades!
-Natantia

Smart Levels📊 SMART LEVELS - Dynamic Support & Resistance Indicator
═══════════════════════════════════════════════════════════════
🎯 OVERVIEW
Smart Levels is an advanced support and resistance indicator that automatically identifies and displays the most significant price levels based on historical pivot points. Unlike simple pivot indicators, Smart Levels uses intelligent clustering and weighting algorithms to merge nearby extremums and highlight only the most reliable levels that matter for trading decisions.
This indicator emphasizes identifying key price levels where multiple pivot points converge, creating zones of increased probability for price reactions.
═══════════════════════════════════════════════════════════════
🔧 HOW IT WORKS
1. PIVOT POINT DETECTION
The indicator scans historical price data to identify pivot highs and pivot lows using configurable left/right bar parameters. Each detected extremum represents a potential support or resistance point where price previously reversed.
2. INTELLIGENT LEVEL CLUSTERING
KEY INNOVATION: Instead of drawing a line at every pivot point, Smart Levels uses an ATR-based clustering algorithm to merge nearby extremums into consolidated levels.
• Extremums within a specified percentage of ATR are grouped together
• The level price is calculated as a weighted average of all contributing pivot points
• This eliminates visual clutter and focuses on truly significant zones
3. TOUCH-BASED LEVEL RANKING
Levels are ranked by the number of pivot points (touches) that contributed to them:
• 5+ touches: Strong levels (solid lines, thicker width)
• 2-4 touches: Moderate levels (dashed lines, standard width)
• Only levels meeting the minimum touch threshold are displayed
4. LEVEL CLASSIFICATION
Each level is automatically classified based on the types of extremums it contains:
• 🟢 SUPPORT - Contains only pivot lows (green)
• 🔴 RESISTANCE - Contains only pivot highs (red)
• 🔵 MIRROR LEVEL - Contains both highs and lows, indicating a level that has acted as both support and resistance (blue)
═══════════════════════════════════════════════════════════════
📋 KEY FEATURES
✨ SMART LEVEL DETECTION
• ATR-Adaptive Clustering: Automatically adjusts merge zones based on market volatility
• Configurable History: Look back 50-500 bars to find relevant levels
• Touch-Based Filtering: Only show levels with minimum confirmation (2-10 touches)
• Top N Display: Automatically displays the strongest 3-20 levels to avoid clutter
📊 DETAILED PRICE INFORMATION
• Multi-Line Price Labels: Each level shows ALL contributing pivot prices in a vertical list
• Labels display the exact historical prices that formed the level
• Visual classification icons (↑ support, ↓ resistance, 🔄 mirror)
• Labels positioned to the right of current price for clear visibility
🎨 VISUAL CUSTOMIZATION
• Customizable colors for support, resistance, and mirror levels
• Automatic line styling based on level strength
• Optional debug mode showing all detected pivot points
• Highlight feature that marks which extremums contributed to displayed levels
📈 REAL-TIME UPDATES
• Levels recalculate on every bar for dynamic adaptation
• Lines extend into the future for forward-looking analysis
• Information table shows current ATR, merge zone, and level statistics
═══════════════════════════════════════════════════════════════
⚙️ INPUT PARAMETERS
EXTREMUM DETECTION
• Bars Left (7) - Number of bars to the left for pivot detection (2-20)
• Bars Right (7) - Number of bars to the right for pivot detection (2-20)
• Lookback History (200) - How many bars back to analyze for levels (50-500)
LEVEL SETTINGS
• Merge Percent (0.8% ATR) - Maximum distance to cluster extremums (0.2-3.0%)
• Minimum Touches (2) - Minimum pivot points required to display a level (2-10)
• Maximum Levels (10) - How many top levels to display (3-20)
VISUAL OPTIONS
• Support Color (Green) - Color for support levels
• Resistance Color (Red) - Color for resistance levels
• Mirror Color (Blue) - Color for mirror levels
• Show Debug Pivots - Display all detected pivot points
• Highlight Used Extremums - Mark extremums that form displayed levels
═══════════════════════════════════════════════════════════════
📖 HOW TO USE
BASIC SETUP
1. Add the indicator to your chart (works on any timeframe)
2. Start with default parameters and observe the detected levels
3. Adjust "Minimum Touches" to filter more/less levels
4. Tune "Merge Percent" based on your timeframe and instrument volatility
TRADING APPLICATIONS
1. Entry Timing: Watch for price reactions at identified levels for potential entry points
2. Stop Loss Placement: Place stops beyond strong levels (5+ touches)
3. Target Selection: Use the next significant level as a profit target
4. Breakout Confirmation: Monitor for decisive breaks of strong resistance/support levels
5. Mirror Level Strategy: Blue levels that flip from support to resistance (or vice versa) can provide high-probability setups
INTERPRETATION TIPS
• Solid thick lines (5+ touches) = Extremely reliable levels with strong historical significance
• Dashed lines (2-4 touches) = Valid levels but with less confirmation
• Mirror levels (blue) = Highest probability zones as they've worked in both directions
• Check the price labels to see the exact historical prices that formed each level
RECOMMENDED SETTINGS BY TIMEFRAME
• Scalping (1m-5m): Lookback 100-150, Merge 0.5-0.8%, Min Touches 2-3
• Intraday (15m-1h): Lookback 150-200, Merge 0.8-1.2%, Min Touches 3-4
• Swing (4h-1D): Lookback 200-300, Merge 1.0-1.5%, Min Touches 3-5
• Position (1D-1W): Lookback 300-500, Merge 1.5-2.0%, Min Touches 4-6
═══════════════════════════════════════════════════════════════
🔍 DEBUG FEATURES
Enable the debug options to understand how the indicator works:
• Show Debug Pivots: Displays small triangles at all detected pivot points (faded)
• Highlight Used Extremums: Bright colored triangles show which pivots contributed to displayed levels
• Info Table: Shows current ATR, merge zone size, number of detected extremums, and active levels
These features help you fine-tune parameters and understand why certain levels appear or disappear.
═══════════════════════════════════════════════════════════════
⚡ TECHNICAL DETAILS
• Version: Pine Script v5
• Overlay: Yes (draws directly on price chart)
• Maximum Lines: 50 (configurable limit)
• Maximum Labels: 50 (configurable limit)
• ATR Period: 14 bars (standard volatility measurement)
• Calculation Method: Weighted average of clustered pivot points
• Update Frequency: Every bar (dynamic recalculation)
═══════════════════════════════════════════════════════════════
💡 WHAT MAKES THIS INDICATOR ORIGINAL
1. INTELLIGENT CLUSTERING ALGORITHM
Unlike basic pivot indicators that draw every level, Smart Levels uses ATR-adaptive clustering to merge nearby extremums, highlighting only the most significant zones
2. DETAILED PRICE HISTORY
Multi-line labels show ALL historical prices that formed each level, providing transparency about level formation
3. DYNAMIC STRENGTH VISUALIZATION
Automatic line styling (solid vs dashed, thickness) based on level confirmation strength
4. MIRROR LEVEL DETECTION
Identifies zones that have acted as both support AND resistance, which are statistically more reliable
5. REAL-TIME ADAPTATION
Continuous recalculation ensures levels remain relevant as new price action develops
6. VISUAL DEBUGGING SYSTEM
Comprehensive tools to understand level formation and tune parameters effectively
═══════════════════════════════════════════════════════════════
⚠️ IMPORTANT NOTES
• This indicator identifies historical support/resistance zones - it does NOT predict future price movements
• Always combine with other forms of analysis (trend, volume, fundamentals) for trading decisions
• Levels can break - use proper risk management and stop losses
• Higher timeframes generally produce more reliable levels
• On first load, the indicator needs leftBars + rightBars bars to detect the first pivots
═══════════════════════════════════════════════════════════════
📚 METHODOLOGY BACKGROUND
This indicator implements a clustering-based approach to support and resistance analysis, which emphasizes:
• Identifying price levels where multiple extremums converge
• Focusing on the strongest, most tested levels rather than every minor pivot
• Using historical price behavior to anticipate future support/resistance
• Combining level analysis with proper risk management and position sizing
The clustering approach ensures that levels represent genuine zones of supply/demand accumulation rather than isolated price spikes, making them more reliable for trading decisions.
═══════════════════════════════════════════════════════════════

powell's key openskey open levels that powell teaches and uses
6 pm, 12 am and 10 am EST opening pricing

A2Z Session First Candle High/LowThis indicator plots the High and Low of the 1st 1 minute candle of any underlying.

MultiAlgo - ScoutMultiAlgo Scout is a helper tool that shows you when market conditions are favorable and when you should stay patient. It is built to support the MultiAlgo system and works for both long and short trading.
What it helps you do:
Filter the current trend so you know if you should focus on longs or shorts
Highlight potential entry candles and continuation candles
Mark swing points and structure zones that matter for decision making
Dynamically show areas where you can place your stop loss based on volatility
Scout does not give buy or sell signals. It gives you clean visual guidance so you can make your own trading decisions with more confidence and consistency.
[AutoZone_mrkim]- Use wisely
- The indicator will automatically draw the Order Block zone for each timeframe
- It will change color if a zone is broken out
- Each timeframe will have different zone levels depending on the timeframe used

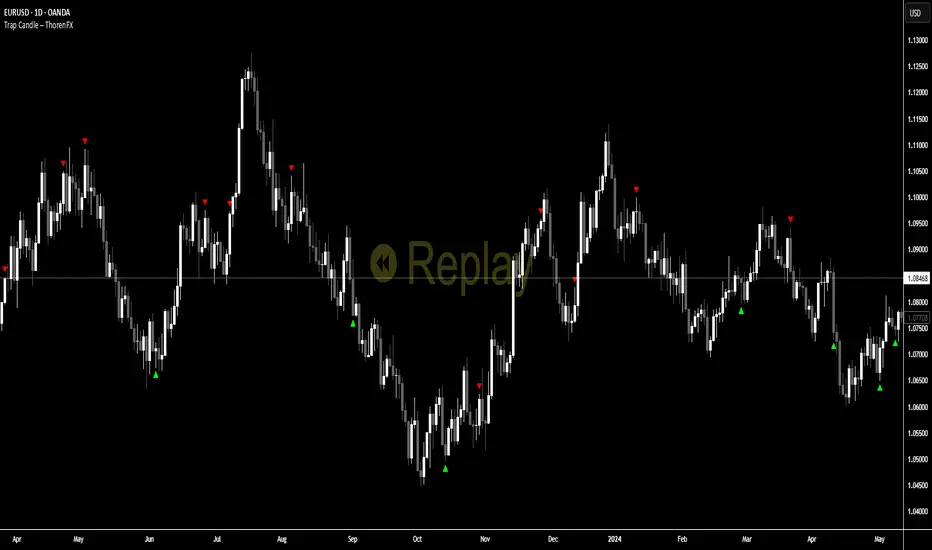
Trap Candle ThorenFXThis tool identifies Trap Candles by combining swing structure, bias shifts, and momentum shifts. The indicator evaluates recent highs and lows to define directional bias, tracks consecutive momentum candles using a custom AO-based sequence, and triggers signals only when the trend bias flips and momentum contradicts the prevailing direction.
The script uses a 20-candle swing lookback to detect the most recent Highest High and Lowest Low. When the market touches these swing extremes, the bias is updated (bullish or bearish). After a bias is confirmed, the indicator waits for a sequence of momentum candles in favor of the trend and then looks for an opposing candle to identify a trap.
Trap signals are only valid if they occur away from current swing extremes, filtering noise and late entries.
BUY Signal logic
Price touches a swing Low to set bullish bias
A minimum sequence of green momentum candles forms
First red momentum candle after the sequence triggers a BUY trap
Signal only prints if the swing Low is not hit again
SELL Signal logic
Price touches a swing High to set bearish bias
A minimum sequence of red momentum candles forms
First green momentum candle after the sequence triggers a SELL trap
Signal only prints if the swing High is not hit again
A compact table display highlights the latest active signal for quick visualization.
How to use
Use in trending or post-liquidity grab environments
BUY traps indicate potential bearish exhaustion followed by bullish reversal
SELL traps indicate potential bullish exhaustion followed by bearish reversal
Combine with structure confirmation and lower-timeframe entry techniques
Works best when aligned with swing bias and momentum context
Avoid signals that form directly at swing extremes; this filter is already built-in but additional confluence improves reliability
No indicator is 100% accurate — it’s all about understanding the logic behind the signals.
Breakout ScannerThis is a Breakout Scanner that shows you the immediate trend across 4 higher timeframes for up to 10 different tickers. It calculates a score from 1 to 3 for bullish and -1 to -3 for bearish based on where price is currently at compared to the previous higher timeframe’s candle levels.
When price is breaking out of the previous higher timeframe candle’s range, then it will have a score of 3 for bullish breakout or -3 for bearish breakout. When price is above the high or below the low of multiple different higher timeframe candles, you can expect price to continue the breakout and move to a new area of price range.
The brighter red or green the color is, the stronger the trend is on that timeframe. When it shows a bright green or red box on the far right side of a ticker, it is notifying you that the ticker is bullish or bearish on all timeframes and trending strongly, so switch over to that chart and look to trade in the direction of that trend.
The tickers, colors and time frames can be customized to suit your preference and you can also turn off as many tickers or time frames as you’d like if you want less tickers or time frames to show up on the indicator. It also includes alerts for when all timeframes are bullish or all timeframes are bearish for one ticker.
Make sure to keep each timeframe set to a timeframe that is higher than your chart timeframe.
Bullish Scoring & Colors
If the current candle close is above the midline of the higher time frame candle, it is given a score of 1 and a dark green background. If the current candle close is above the higher timeframe candle body, then it is given a score of 2 and a medium green background. If the current candle close is above the high of the higher time frame candle, it is given a score of 3 and a bright green background.
The higher the score the stronger the bullish trend and the brighter green the color will be.
Bearish Scoring & Colors
If the current candle close is below the midline of the higher timeframe candle, it is given a score of -1 and a dark red background. If the current candle close is below the higher timeframe candle body, then it is given a score of -2 and a medium red background. If the current candle close is below the low of the higher timeframe candle, it is given a score of -3 and a bright red background.
The lower the score, the stronger the bearish trend and the brighter red the color will be.
Total Score Display
On the right side of the indicator table, there is a column that displays the total score by adding all the scores together so you can easily tell the overall strength of the trend across all timeframes. Wait for the trend score to be at least 75% of the possible score to trade so you can ensure you are only trading very strong trends and increase your probability of winning your trade. The total score will update according to how many time frames you have enabled in the settings. You can also turn on or off the total score count if you prefer. The default setting is off.
All Timeframe Trends Agree
When all of the timeframes that you have turned on are in the same direction at the same time, a green or red box will appear on the far right side of the scanner. This is a visual cue that lets you know the strongest trending markets without having to read any of the numbers. Make sure to check out the charts for the markets that have a green or red box on the far right side and look for potential trend trading opportunities.
Alerts
You can set alerts for when all time frames for a certain ticker are bullish or bearish. If you have some time frames turned off at the time of creating your alerts, then it will only require all time frames that are on to be all bullish or bearish to generate an alert. Make sure to set your alerts to once per bar close to ensure you don’t get premature alerts that aren’t yet valid.
Best Way To Use The Scanner
For best results, make sure you wait for the trend to show all bullish or all bearish at the same time and then look to trade in the direction of the strong trend. If you can be patient enough to do that, you will increase the probability of winning your trade because you are trading with the direction of the overall higher timeframe trend when the market is trending strongly and making new highs or lows.
When one of the markets in the scanner shows all timeframes trending, go to that chart and see how price action is reacting to the previous higher timeframe candle levels. You can see those levels easily by adding our Higher Timeframe Candle Levels indicator to your chart and using the same timeframes as your Breakout Scanner is using.
If price is holding the higher timeframe candle levels well, then look to place trades in the direction of the trend that the Breakout Scanner is showing.
Other Indicators To Pair This With
Use this in combination with our Higher Timeframe Candle Levels indicator so you can see all of these levels being used to calculate the trend strength scores and watch how price reacts to those levels. You should also use our Trend Strength Indicator to easily read the historical trends of price compared to the higher timeframes and use those trends to guide you on when to trade and which direction to trade.
Trend Strength Indicator, Higher Timeframe Candle Levels and the Breakout Scanner all use the same levels to calculate the trend scores so they are designed to work all together to help you quickly be able to read a chart and find what direction to trade in.

3D Cube Projection - √3 Diagonal3D Cube Projection - √3 Diagonal
OVERVIEW
This indicator implements Bradley F. Cowan's cube projection methodology from his "Four Dimensional Stock Market Structures & Cycles" work. It visualizes a 3D cube projected onto the 2D price-time chart, using the √3 (square root of 3) body diagonal as the primary analytical tool for identifying market structure and potential cycle termination points.
METHODOLOGY
The cube is constructed by selecting two pivot points (A and E) which form the body diagonal - the longest diagonal running through the cube's interior from one corner to the diagonally opposite corner. According to Cowan's geometric approach:
- Point A = Starting pivot (low or high)
- Point E = Ending pivot (opposite extreme)
- Body Diagonal (A→E) = √3 × cube side length
- Face Diagonal (A→C) = √2 × cube side length
The script calculates the cube dimensions by:
1. Measuring the total price range from A to E
2. Dividing by √3 to determine the cube side length in price
3. Distributing the time component across three equal segments
4. Projecting the 3D structure onto the 2D chart plane
FEATURES
✓ Interactive date selection for points A and E
✓ Automatic UPLEG/DOWNLEG detection
✓ All 8 cube vertices labeled (A-H)
✓ All 6 cube faces with independent color/opacity controls
✓ √3 body diagonal (red line by default)
✓ √2 face diagonal (orange line by default)
✓ Customizable cube lines, fills, and labels
✓ Information table showing key measurements
VISUAL CUSTOMIZATION
- Front & Back faces: Box fills for the two square faces
- Side faces: Left and right vertical faces
- Top & Bottom faces: Horizontal connecting faces
- Each group has independent color and opacity settings
- Label size and transparency fully adjustable
- Cube line styles (solid, dashed, dotted) for depth perception
IMPORTANT LIMITATIONS & DISCLOSURES
This indicator works within the inherent constraints of projecting 3D geometry onto a 2D price-time chart:
⚠️ VISUAL APPROXIMATION: This is a visual projection tool, not a mathematically perfect 3D cube. True 3D geometry cannot be accurately represented on a 2D plane without distortion.
⚠️ TIME DISTRIBUTION: The script divides the time axis into three equal segments (total bars ÷ 3) for practical visualization. This is an approximation that prioritizes visual coherence over strict geometric accuracy.
⚠️ UNIT SCALING: Price and time use different units (dollars vs. bars), making true isometric projection impossible. The cube appears proportional on screen but the dimensions are not directly comparable.
⚠️ 2D CONSTRAINT: We only have X (time) and Y (price) axes available. The Z-axis (depth) is simulated through visual projection techniques (line styles, shading).
INTENDED USE
This tool is designed for traders and analysts who study Bradley Cowan's geometric market analysis methods. It helps visualize:
- Market structure in geometric terms
- Potential support/resistance zones at cube edges
- Cycle timing relationships using √2 and √3 ratios
- Harmonic price-time relationships
The cube projection should be used as one component of a comprehensive analysis approach, combined with other technical tools and fundamental analysis.
MATHEMATICAL FOUNDATION
While the visual representation involves approximations, the core √3 relationship is mathematically sound:
- For any cube, the body diagonal = √3 × side length
- The face diagonal = √2 × side length
- These ratios are preserved in the price dimension calculations
HOW TO USE
1. Select your starting date (Point A) - typically a significant low or high
2. Select your ending date (Point E) - the opposite extreme pivot
3. The indicator automatically constructs the cube geometry
4. Analyze the cube edges, diagonals, and faces for market structure insights
5. Adjust colors and opacity to suit your chart aesthetic
TECHNICAL NOTES
- Works on all timeframes and instruments
- Best viewed on charts with sufficient historical data
- Cube updates in real-time as new bars form
- Range selection is marked with vertical lines and shading
- Calculator table shows Point A, Point E, side length, and bar measurements
ACKNOWLEDGMENT
This indicator is based on the geometric market analysis principles developed by Bradley F. Cowan. Users are encouraged to study Cowan's original works for deeper understanding of the theoretical framework.
DISCLAIMER
This indicator is for educational and analytical purposes only. It does not constitute financial advice. Past performance does not guarantee future results. Always conduct your own research and risk management before making trading decisions.
