Heikin Ashi Overlay SuiteHeikin Ashi Overlay Suite is designed to give traders more control and clarity when working with Heikin Ashi candles — whether you're analyzing trend strength, reducing chart noise, or simply improving your visual read of market momentum. It works by layering multiple types of HA overlays and color systems on top of your standard candlestick chart — without switching chart types. With dynamic gradient coloring, smoothing options, and a predictive line tool, this script helps you see not just what the current trend is, but how strong it is, and what it would take to reverse it.
Heikin Ashi candles help reduce noise but this script goes further by:
➡️adding color intelligence that shows trend strength using a streak counter
➡️uses smoothing logic to clean up chop and whipsaws
➡️introduces a predictive close line — a subtle but powerful guide for anticipating trend flips before they happen
Everything is configurable: colors, candle sources, overlays, predictive tools, and line styles. It’s built for traders who want visual speed, but don’t want to sacrifice signal quality.
At its core, the script offers two powerful dropdown controls:
💥HA Color Scheme (Colors Regular Candles) — Applies Heikin Ashi-derived coloring to your regular candles based on trend direction or streak strength. This gives you instant visual context without switching to a separate chart type.
💥HA Candle Overlay Mode — Overlays actual Heikin Ashi-style candles directly on top of your chart, using your preferred source:
➡️Custom HA candles using internal formula logic
➡️TradingView’s built-in Heikin Ashi source with your own colors
➖➖➖➖➖➖➖➖➖➖➖➖➖➖➖➖➖➖➖➖➖➖➖➖➖➖➖➖➖➖➖
🎨 Custom + Gradient HA Coloring🎨
See trend strength at a glance:
➡️1–4 bar streaks → lighter tone
➡️5–8 bars → medium tone
➡️9+ bars → bold tone, ideal for momentum-based entries, exits, or scaling strategies
→ Choose from:
➡️Your own custom color set
➡️A simple 2-color base mode
➡️Or a 3-level gradient for progressive trend analysis (using the streak counter)
🏛️ TradingView Official Heikin Ashi Overlay
Prefer native HA candles but want your own colors?
This mode plots TradingView's Heikin Ashi source, with your personal bullish/bearish color scheme.
➡️Ensures consistency with built-in charts while still leveraging your visual style.
🌊 Smoothed Heikin Ashi Candles — Clarity in Chaos🌊
These aren’t your standard HA candles. Smoothed Heikin Ashi uses a two-step EMA process to transform chaotic price action into a cleaner, slower-moving trend structure:
🔹 First, it smooths the raw OHLC data using EMA — filtering out minor price fluctuations.
🔹 Then, it applies the Heikin Ashi transformation on top of the smoothed data.
🔹 Finally, it applies a second EMA smoothing pass to the HA values — creating ultra-smooth candles.
📈 What You See:
Trends appear more fluid and consistent.
Choppy ranges and fakeouts are visually suppressed.
Minor pullbacks within a trend are de-emphasized, helping you avoid premature exits.
🎯 Best For:
Swing traders looking to stay in positions longer.
Intraday traders dealing with volatile or noisy instruments.
Anyone who wants a "trend map" overlay without the distractions of raw price action.
✅ Reduces whipsaws
✅ Delivers high-contrast trend zones
✅ Makes reversals more visually apparent (but with a slight lag)
📍 Predictive Close Line📍
Shows where the real close must land to flip the current HA candle's color.
✅ Use it like predictive support/resistance
✅ Know if the trend is actually at risk
✅Visualize potential fakeouts or confirmation
Color-coded based on current HA direction (bullish, bearish, or neutral).
📈 Tick by tick & bar-to-bar Plots📈
Provides 2 plot types:
1)1 plot that tracks a bar tick by tick
2)another plot that tracks the close from bar to bar
For the bar to bar plot, you can choose between 2 options:
✅Full Plot — continuous line colored by HA trend
✅Recent Segments — color just the last few bars (configurable) to reduce chart clutter
✅ Customize width, number of bars, and visibility
➖➖➖➖➖➖➖➖➖➖➖➖➖➖➖➖➖➖➖➖➖➖➖➖➖➖➖➖➖➖➖
📘 How to Use this script📘
Imagine you're watching a choppy 15-minute chart on a volatile crypto pair — price action is messy, and it’s hard to tell if a trend is forming or just noise.
Here’s how to cut through the chaos using Heikin Ashi Overlay Suite:
🔹 Step 1: Enable "Smoothed HA Candles"
Start by turning on the smoothed candles. You’ll immediately notice the noise fades, and broader directional moves become easier to follow. It's like switching from static to clean trend zones.
🧠 Why: Smoothed HA uses a double EMA process that filters out small reversals and lets larger moves stand out. Perfect for sideways or jittery charts.
🔹 Step 2: Watch the Color Gradient Build
As the smoothed candles begin to align in one direction, the gradient coloring (1–4, 5–8, 9+ streaks) gives you an at-a-glance visual of how strong the trend is.
✅ If you see 9+ same-colored candles? You’re likely in a mature trend.
✅ If it resets often? You’re in chop — consider staying out.
🔹 Step 3: Use the Predictive Close Line for Anticipation
Now here’s the edge — this line tells you where the candle would have to close to flip colors.
📉 If price is hovering just above it during a bullish run — momentum may be weakening.
📈 If price bounces off it — the trend may be strengthening.
This is excellent for confirming entries, exits, or spotting early warning signs.
🔹 Step 4: Switch Between Candle Modes as Needed
You can flip between:
✅ Custom HA: Gradient candles with your colors
✅ TradingView HA: The official source with your styling
✅ None: Just color regular candles using the HA logic
Use what fits your style — everything is modular.
🔹 Step 5: Tune It to Your Chart
Lastly, tweak streak thresholds (currently only can do this within the source code), smoothing lengths, and line styles to match your timeframe and strategy.
🎯 Tailor The Settings to Fit Your Trading Style🎯
🔹 🧪 Scalper (1–5 min charts)
If you’re trading fast intraday moves, you want quicker responsiveness and less lag.
Try these settings:
🔸Smoothing Lengths: Use lower values (e.g. len = 3, len2 = 5)
🔸Candle Mode: Use Custom HA or TV’s HA for real-time color flips
🔸Predictive Close Line: Great for ultra-fast anticipation of color reversals
🔸Line Mode: Use Recent Segments mode to track short bursts of trend
🔸Colors: Use high-contrast, opaque colors for clarity
✅ These settings help you catch micro-trends and flip signals faster, while still filtering out the worst of the noise.
🔹 🧪 Swing Trader (30m–4h charts and beyond)
If you’re looking for multi-hour or multi-day trend confirmation, prioritize clarity and staying in moves longer.
Recommended setup:
🔸Smoothing Lengths: Medium to high values (e.g. len = 8, len2 = 21)
🔸Candle Mode: Use Smoothed HA Candles to block out intrabar chop
🔸Gradient Colors: Enable to visualize trend maturity and strength
🔸Predictive Close Line: Helps confirm trend continuation or spot early reversals
🔸Line Mode: Use Full Plot Line for clean HA-based trend tracking
✅ These settings give you a calm, clean view of the bigger picture — ideal for holding positions longer and avoiding early exits.
🔧 This script isn’t just a chart overlay — it’s a visual trend engine.🔧
Ideal For:
🔶 Trend-followers who want clean, color-coded confirmation
🔶 Reversal traders spotting exhaustion via predictive flips
🔶 Scalpers filtering noise with lighter smoothing
🔶 Swing traders using smoothed visuals to hold longer
📌 Final Note
Heikin Ashi Overlay Pro is designed to help you see momentum, trend shifts, and market structure with greater clarity — not to predict price on its own. For best results:
✔️ Combine with support/resistance, moving averages, or price action patterns
✔️ Use Predictive Close as a confirmation tool, not a signal generator
✔️ Pair gradient colors with structure to gauge trend maturity
✔️ Always zoom out and check higher timeframes for context
🧠 Use this as part of a layered approach — not a standalone system.
🙏 Credits🙏
⚡HA logic based on SimpleCryptoLife
⚡Smoothed HA concept adapted from a script by Jackvmk
💡💡💡Turn logic into clarity. Structure into trades. And uncertainty into confidence.💡💡💡
캔들스틱 분석

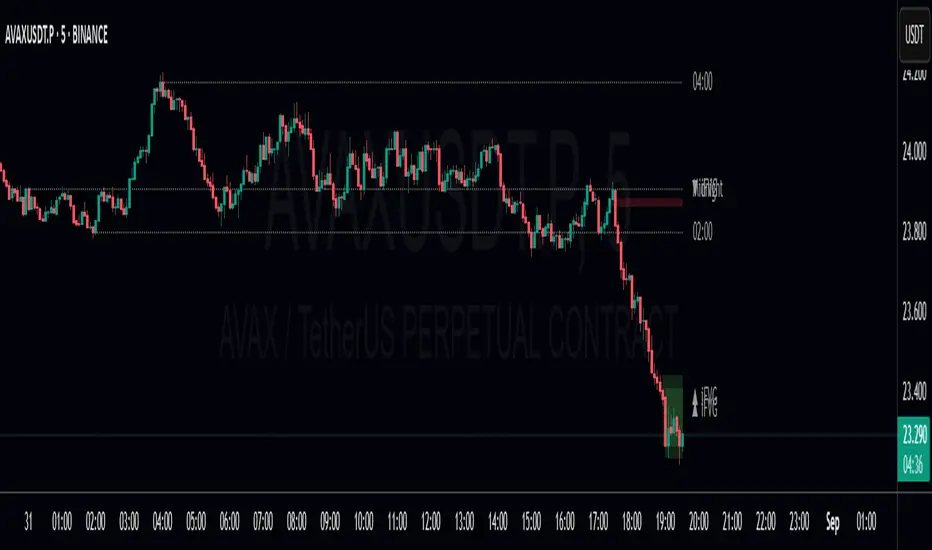
Imbalance (FVG)Indicator Description
This script is designed to automatically identify and visualize Fair Value Gaps (FVGs), also known as Imbalances, on your chart. An FVG is a key price action concept that highlights areas where the price moved swiftly, leaving a gap behind. This indicator is simple to use and fully customizable, making it an excellent tool for both novice and experienced traders.
Key Features
Automatic Detection: The indicator scans the market in real-time, automatically drawing FVG zones for both Bullish and Bearish moves.
Mitigation Tracking: When the price returns to an FVG zone, the indicator automatically marks it as "mitigated" (filled) by changing its color and style. This provides a clear signal that the imbalance has been neutralized.
Extend Zones Into the Future: Unmitigated FVG zones are automatically extended into the future, allowing them to be used as potential future support or resistance levels.
Full Customization: The user has complete control over the indicator's appearance. You can change the colors for bullish, bearish, and mitigated zones, as well as toggle their visibility on and off.
Performance Optimization: A built-in limit for the number of drawn objects prevents chart clutter and avoids errors from TradingView's drawing limits, ensuring smooth performance.
How to Use?
FVG zones can be used in various ways, including:
Price Magnets: Markets often tend to revert to "fill" these gaps.
Potential Entry Points: Price entering an FVG zone can present an opportunity to open a position, especially if confirming signals appear.
Support/Resistance Zones: Unfilled gaps can act as strong, dynamic levels of support or resistance.

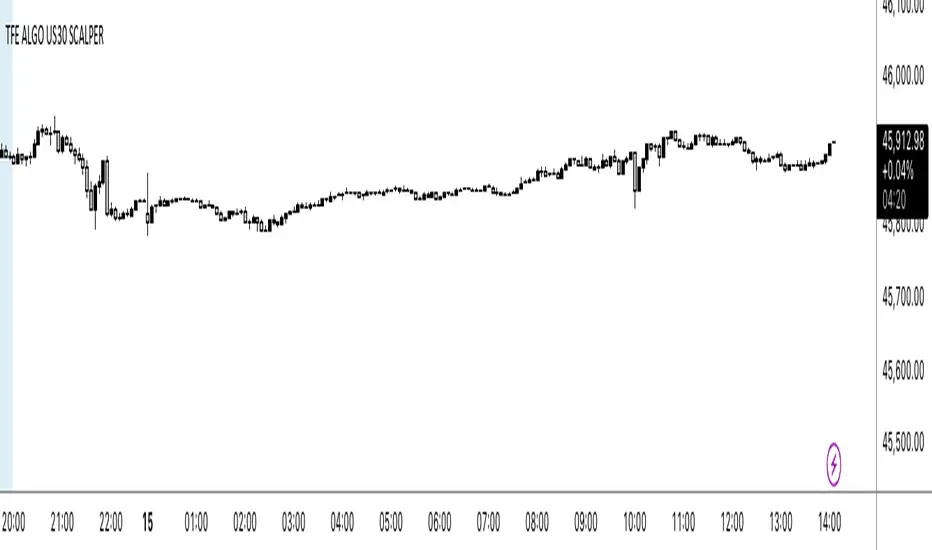
NY OPEN SIGNAL SCLAPER 📌 Indicator: US30 Scalper by TFE ALGOS
The US30 Scalper by TFE ALGOS is built for traders who want to capture fast and decisive moves on US30 during the New York session.
🔑 Key Features:
Clear Buy & Sell Signals with automatic plotting of trade levels.
Built-in Risk Management with stop loss and take profit levels, optimized at a 5:1 R:R.
Customizable Visuals – adjust colors, styles, and watermark display to fit your chart.
Alerts Included – stay updated when trade opportunities or key levels are reached.
Professional Branding – watermark logo keeps charts clean and consistent.
🎯 Designed For:
Scalpers and intraday traders who focus on US30.
Traders seeking a structured, professional charting tool.
⚠️ Disclaimer: This tool is for educational purposes only. Trading involves risk; always manage your capital wisely.
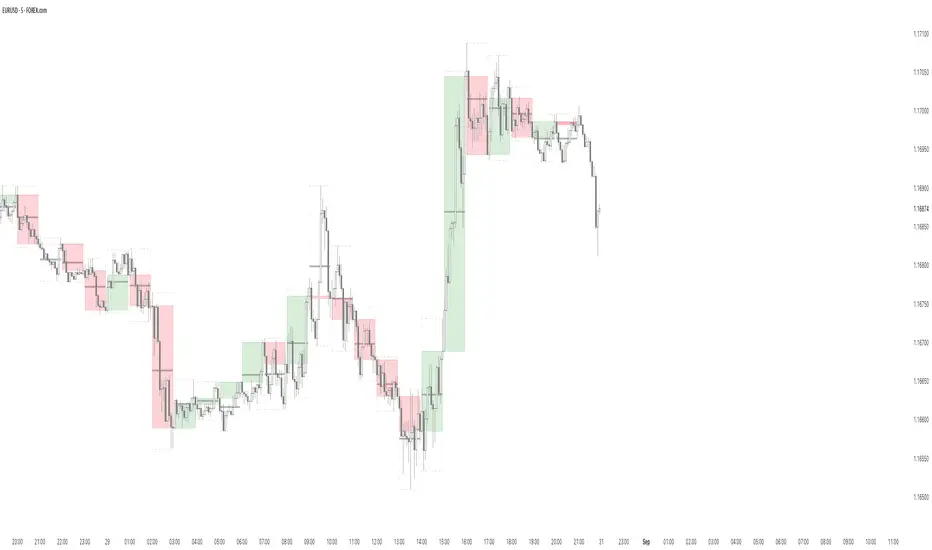
Intraday Buy/Sell/Average Zones by Chaitu50cIntraday Buy/Sell/Average Zones by chaitu50c
Timeframe:
Tested on the 5-minute chart.
Recommended timeframe: 5-minute
What it does
This indicator marks intraday Buy (green) and Sell (red) zones made by strong close-confirmed breakouts. These zones act as support/resistance. If price later closes through a zone, the zone changes color from that bar forward (support ↔ resistance). It can flip more than once.
How zones form
Single breakout: an opposite-type candle closes beyond the previous candle’s high/low.
Double breakout: a base candle, then two opposite-type candles, and the second one closes beyond the base high/low.
Zone size
Buy zone: from the combo lowest low up to the nearest open/close of the combo.
Sell zone: from the combo highest high down to the nearest open/close of the combo.
Color shift (optional)
If price closes through a zone, it flips color at that bar and behaves as the other side (support ↔ resistance). Flips can happen again later.
Overlap control
When a new zone overlaps an existing same-color zone in the same session, choose:
Merge (combine), or
Suppress (ignore the new one).
Flipped zones use their current color for this.
Right edge & session
All zones extend to the right (your offset). Detection is limited to your chosen session, and you can show only the last N sessions.
---
How to trade (simple)
A) Initial breakout trade
When a new zone forms, that breakout itself can be a trade idea in the breakout direction, The stoploss will be the zone.
B) Zone breakout trade (flip)
If price later closes out of a zone and it changes color, that breakout is another trade opportunity in the new direction.
C) Retrace & average trade
When price retests a zone, wait for a confirmation candle in the zone’s favor
— bullish close for a green zone, bearish close for a red zone — then average entries inside/near the zone.
Place stops just beyond the opposite edge of the zone.
If the zone flips color, stop averaging; bias changed.
---
Key settings
Breakout type: Single and/or Double
Confirm on Close: strict mode (no intrabar preview) or allow intrabar preview that auto-removes if fail
Color Shift on Breaks: on/off
Same-Type Overlap: Merge/Suppress
Session, Sessions to Display, Right Offset, Colors, Max Zones
Reminder: Best results on the 5-minute timeframe (tested and recommended).

[DEM] Engulfing Candlestick Identifier Engulfing Candlestick Identifier is designed to automatically detect and highlight bullish and bearish engulfing candlestick patterns by analyzing the relationship between consecutive candles and applying ATR-based size filters to ensure significant pattern validity. The indicator identifies bullish engulfing patterns when the current candle closes above the previous candle's open, opens below the previous candle's close, and both candles meet minimum size requirements based on ATR thresholds, while bearish engulfing patterns are detected under opposite conditions. The indicator colors bars green for bullish engulfing patterns, red for bearish engulfing patterns, and optionally purple for all other bars when the "Different Color" setting is enabled, helping traders quickly identify potential reversal signals where one candle completely engulfs the body of the previous candle with sufficient magnitude to suggest meaningful momentum shifts.
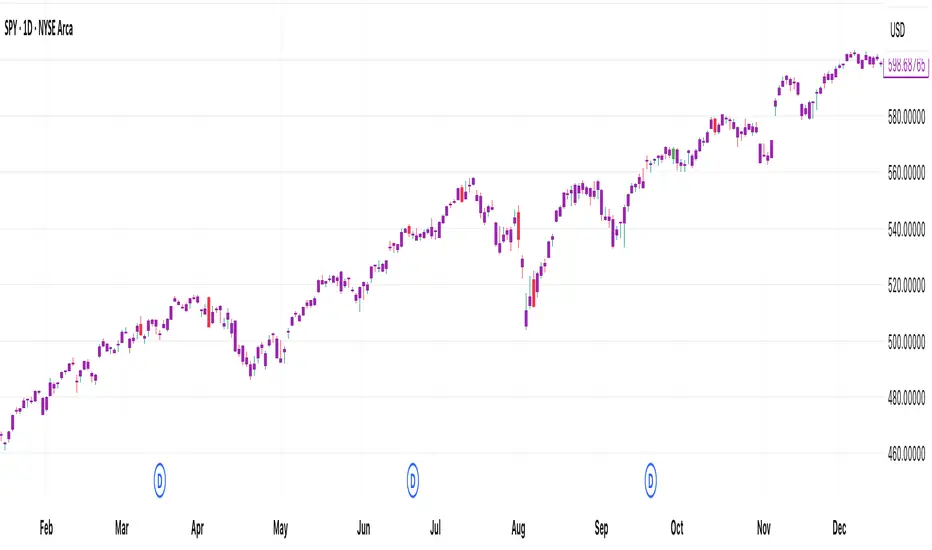
Distribution DaysThis script marks Distribution Days according to the Investors Business Daily method -- a significant decline on higher volume:
(1.) Price has declined > 0.2% from the prior day's close
(2.) Trading volume is greater than the prior day's volume

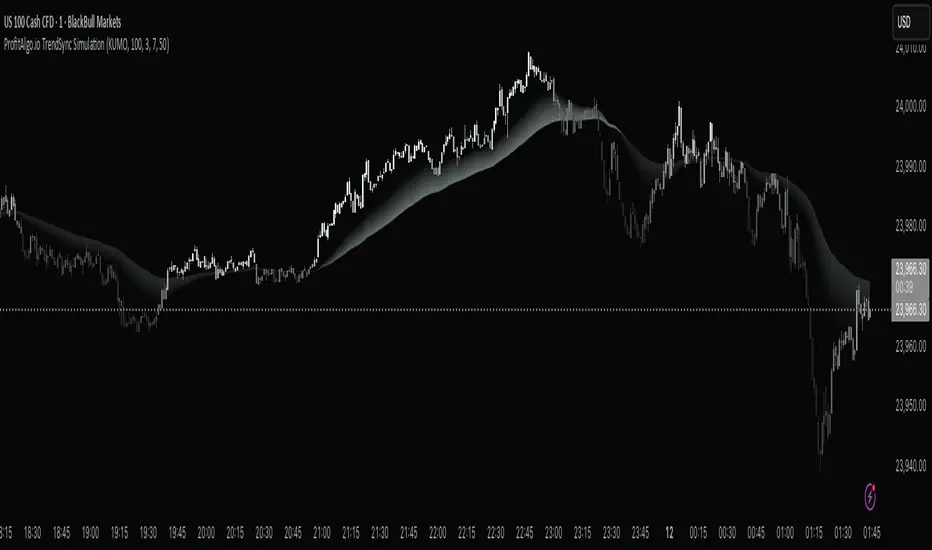
ProfitAlgo.io TrendSync SimulationThe TrendSync Simulation is a gradient-based trend-following framework that helps traders quickly identify bullish vs bearish market structure while filtering out short-term noise.
Instead of relying on a single moving average or indicator, TrendSync builds a layered “trend cloud” in 3 different MODES, KUMO, PFA, HMA anchored against a reference band. These layers create a visual gradient that shifts with market direction.
When combined with its color-adaptive candles, you can turn off your candle setting colors within the chart settings of TradingView for the TrendSync color mapping which transforms raw price action into an easy-to-read flow map of institutional momentum.
📊 How It Works
Each layer creates a smooth gradient that shifts with trend direction:
Bullish trends form a rising, green-shaded cloud.
Bearish trends form a descending, red-shaded cloud.
Transitions appear as fading or compressing gradients, signaling potential reversals or consolidations.
Candles are also dynamically colored based on normalized momentum, allowing traders to see directional strength at a glance.
🔑 Key Features
✅ Gradient Cloud – A layered trend structure that visually shifts from bearish → bullish.
✅ Multiple Modes – Choose between KUMO, PFA, or HMA logic for responsiveness vs. smoothness.
✅ Dynamic Trend Candles – Bars adapt color based on momentum strength.
✅ Customizable Visualization – Adjust transparency, colors, and gradient strength to fit your chart style.
✅ Clarity of Direction – Highlights dominant flow while reducing noise from minor fluctuations.
⚙️ Settings Explained
Trend Method (KUMO / PFA / HMA): Controls the type of moving average used for the cloud.
Gradient Colors: Define the shading of bullish vs. bearish zones.
Transparency Controls: Adjust how strong or subtle the gradient cloud appears.
Lookback Length : Longer = smoother trend; shorter = more reactive.
💡 Use Cases
Identify trend bias quickly without switching between multiple indicators.
Confirm entries with liquidity or breakout strategies by aligning with the cloud.
Detect weakening or strengthening momentum via gradient compression.
Avoid trading against dominant higher time-frame flow with trend-colored candles .
⚡ Why It Matters
Markets often look chaotic on raw candlestick charts. TrendSync cuts through that noise by layering moving averages into a visual gradient, revealing institutional momentum in real time. Whether scalping, day trading, or swing trading, TrendSync provides a synchronized view of trend direction that adapts to different trading styles.
⚡ Paired with the Back End Order Matrix, TrendSync provides the clarity of direction after liquidity zones are exposed, creating a complete institutional-style framework inside TradingView.
EXAMPLE 1A
EXAMPLE 1B
EXAMPLE 1C
EXAMPLE 2A
Open Interest OverlayOpen Interest Overlay
Overview
This indicator displays Open Interest (OI) data directly on your price chart as an overlay, eliminating the need for separate panes while preserving authentic OI movement patterns. Perfect for traders who want to analyze OI correlations without sacrificing chart real estate.
Key Features
📊 Smart Price Scaling
• Automatically maps Open Interest values to fit within your chart's price range
• Preserves all directional movements, timing, and relative magnitude relationships
• Uses official TradingView Open Interest feed for accuracy
🎨 Full Customization
• Custom Colors: Choose your own colors for rising/falling OI (defaults: teal/red)
• Line Style: Toggle between step-line (traditional) or smooth line display
• Optional Fill: Shade area between OI line and mid-price for better visual reference
• Smoothing Options: Apply moving average smoothing to reduce noise
⚙️ Intelligent Settings
• Normalization Window: 300-bar lookback (customizable) for scaling calculations
• Auto Timeframe: Uses daily data for intraday charts on traditional assets, chart timeframe for crypto
• Real Value Display: Shows actual (unscaled) OI value on the last bar
How It Works
The indicator performs proportional mapping of Open Interest data:
1. Calculates OI range (high/low) over the lookback period
2. Maps this range to your chart's price range during the same period
3. Displays OI movements that maintain authentic patterns and timing
Perfect For
✅ Correlation Analysis - See how OI moves with price in real-time
✅ Divergence Spotting - Identify when OI and price trends diverge
✅ Clean Charts - No need for separate panes or window splitting
✅ Pattern Recognition - Spot OI building/declining during key price levels
✅ Cross-Market Analysis - View any symbol's OI overlay on your current chart (e.g., Bitcoin OI while viewing Ethereum prices)
What You Get vs Traditional OI Indicators
Advantages:
• Authentic OI movement patterns preserved
• Direct visual correlation with price action
• No chart real estate sacrifice
• Immediate trend and divergence recognition
Trade-offs:
• Shows relative OI changes rather than absolute values
• Scaling is relative to the selected lookback period
Ideal For
• Day traders monitoring intraday OI flow
• Swing traders analyzing OI trends with price movements
• Futures traders tracking institutional interest
• Anyone wanting clean, correlation-focused OI analysis
Compatible With
• Futures contracts with Open Interest data
• Any timeframe (auto-adjusts for optimal data)
• All TradingView-supported OI symbols

Liquidation/Doji CandlesLiquidation/Doji Candles
This indicator highlights candles with a body length smaller than 30% of the candle’s total range. These candles are displayed in orange, representing potential liquidation points or doji candles.
The idea behind this tool is to help traders spot moments of market indecision, where buying and selling pressure are in balance. Such conditions often hint at institutional liquidation events or possible retail-driven reversals.
You can fully customize the detection sensitivity by adjusting the percentage input. This allows you to tighten or loosen the condition depending on your trading style and market preference.
To support passive traders, the script also includes built-in alerts for:
• The formation of a new liquidation/doji candle.
• A close above its high (bullish engulfment).
• A close below its low (bearish engulfment).
These alerts make it easier to stay on top of potential market shifts without needing to constantly monitor the charts.

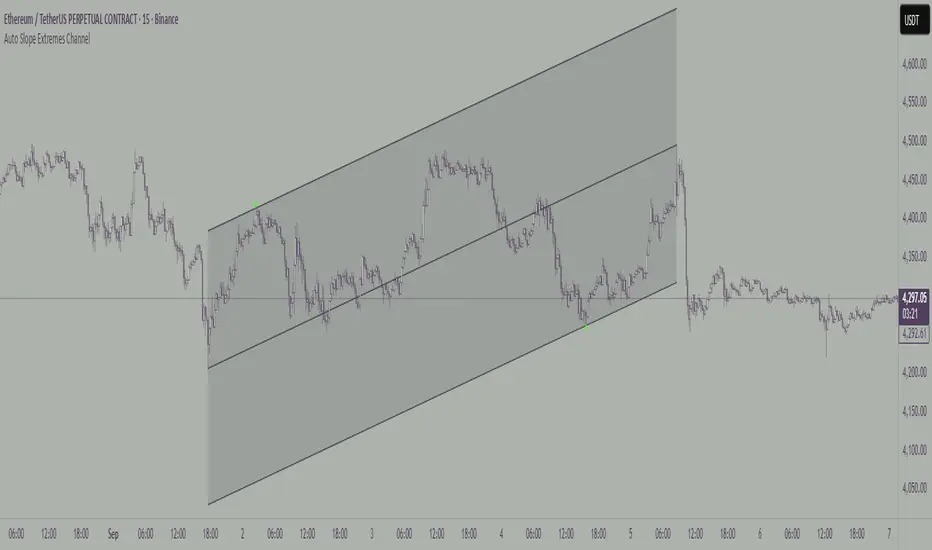
Auto Slope Extremes ChannelAuto Slope Extremes Channel
Expanding channel that locks onto the highest high and lowest low of the slope between A and B.
This indicator builds a dynamic channel between two anchors, A and B.
Unlike fixed-width channels, it adapts to the slope of the leg between A and B and expands until:
• The upper channel line touches the highest candle in that slope.
• The lower channel line touches the lowest candle in that slope.
This method ensures that the channel edges are defined only by the single most extreme high and the single most extreme low within the selected leg. No other candles in the range touch the edges.
A centerline is drawn midway between the two extremes, and small triangle markers highlight the exact candles that determine the upper and lower boundaries.
Features
• Anchored channel defined by two user-selected points (A and B).
• Expands to fit the highest high and lowest low of the slope between A and B.
• Optional centerline and channel fill.
• Extend lines left, right, or both.
• Customizable line widths and colours.
Pipnotic HTF BarsDescription:
Pipnotic HTF Bars projects higher-timeframe (HTF) candles to the right of current price so you can “peek ahead” with clean, fixed-width silhouettes. The latest HTF bar updates live until it closes; completed HTF bars are frozen and kept in a tidy row to the right. Bodies inherit up/down colours, wicks sit on the body edge (no line through the body), and transparency/borders are configurable for a lightweight, elegant overlay.
How It Works:
The script reads true HTF opens via request.security and detects new HTF boundaries precisely.
Completed HTF bars are captured with look ahead off and stored; they never repaint.
The current HTF bar uses look ahead on and updates tick-by-tick until the next HTF bar begins.
Each candle is drawn as a fixed bar-index width box and wick, anchored a set number of bars to the right of the chart, then spaced evenly.
Visualization and Management:
Candles are rendered as boxes (bodies) plus edge-wicks (coloured to match the body).
You choose how many completed HTF candles to keep visible; older ones are automatically pruned.
Width, spacing, transparency, and borders make the projection readable without cluttering price.
Designed to stay performant and within TradingView’s shape limits.
Key Features & Inputs:
Higher Timeframe (HTF): W, D, 240, 120, 60, 30, 15.
Live Current Bar: The most recent HTF candle updates until it closes (no duplicate static bar).
Number of Candles: Keep the last N completed HTF candles to the right.
Fixed Projection Geometry:
Projected width (bars) : set a constant visual width per candle.
Gap (bars) : spacing between projected candles.
Right shift : anchor the projection a fixed distance beyond the latest bar.
Styling : Up/Down colours, body transparency, optional borders, wicks coloured same as body and drawn from body edge → high/low (never through the body).
Overlay : Works on any symbol and chart timeframe.
Enhanced Visualization:
Edge-wicks align visually with the close side of the body, producing a crisp, unobstructed read of range (H–L) and direction (O→C).
Fixed widths and even spacing create a timeline-like panel to the right of price, ideal for multi-timeframe context without compressing your main chart.
Transparency lets you “ghost” the projection so LTF price action remains visible beneath.
Benefits of Using the Pipnotic HTF Script:
Instant HTF context without switching charts or compressing the main view.
Non-repainting history: Completed HTF candles are locked the moment a new one starts.
Cleaner decision surface: Edge-wicks and soft transparency reduce visual noise.
Time-saving workflow: Scan upcoming HTF structure at a glance (range, bias, progress).
Configurable & lightweight: Tune width, spacing, and count to fit any layout.
Tip: Using the daily HTF on an hourly or less timeframe and watching as price tests the open of the current day, especially if prices e.g. traded below the open, can provide some great trades as prices move above and retest the open.

Lanxang Pin Bar Pro V.2How to use (step-by-step)
Mark context first
Draw your Supply/Demand zones and note HTF structure (H1).
Use the indicator as a price action confirmation at those POIs.
Wait for a pin bar at a level
Bullish pin: long lower wick rejecting demand; Bearish pin: long upper wick rejecting supply.
Ensure it prints within your session and passes ATR/shape filters.
Choose your entry style
Conservative: Enter on break of pin high (bull) / low (bear).
Aggressive (RR-optimized): Place a limit near the 50% retrace of the pin bar (you removed lines, so measure the midpoint quickly: (High+Low)/2 from the data box).
Place stop
Beyond the wick + small buffer (e.g., 10–20 pts on XAUUSD M5–M15).
Keep SL reasonable (≤ ~1–1.2× ATR of your entry TF).
Targets & management
T1 = 1R, take partial, move to BE after structure break or at 1R depending on volatility.
T2 at the next opposing SD zone, prior swing, or session high/low.
Let a small runner trail via swing highs/lows if trend is strong.
Risk
Keep risk fixed % (e.g., 1%) per trade. Your math is already RR-driven—perfect for journaling and expectancy.
Recommended defaults (XAUUSD, M5–M30)
Min Wick : Body Ratio = 2.0–2.5
Max Body / Range = 0.30–0.35
Min Range as ATR multiple = 0.8–1.0
HTF = 60 min; EMAs = 50/200
Sessions = London core + NY open
Alerts
Turn on alerts for Bullish Pin Bar / Bearish Pin Bar (and optionally “Entry Trigger” if you use it).
Use them to route to your phone or EA bridge (you already use webhook flows).
Pro tips (fits your SMC style)
Prefer pins that sweep liquidity (wick pokes above equal highs / below equal lows) and close back inside your zone.
Extra confluence: FVG edge, HTF OB boundary, or daily/weekly high/low.
Skip mid-range pins with no level.
Track R results in your journal to monitor expectancy.

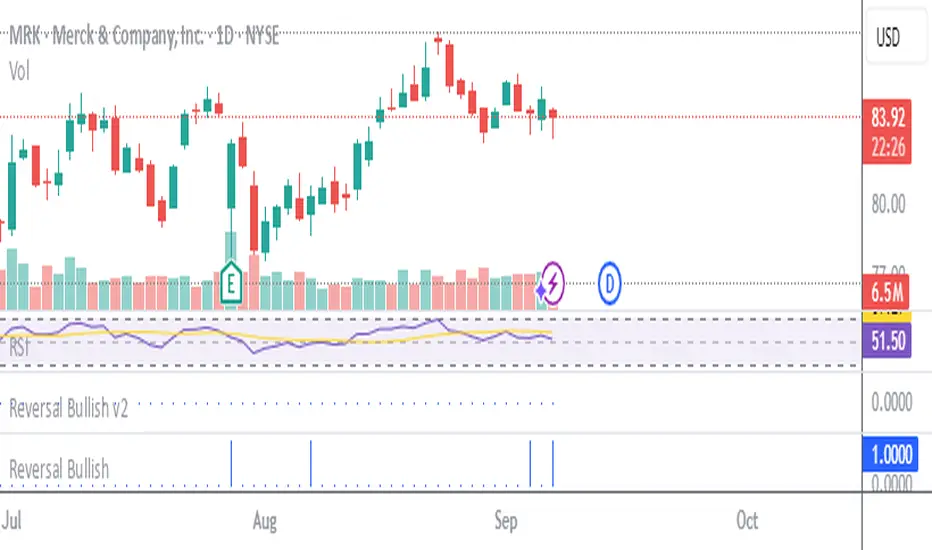
Stockbee Reversal Bullish v2Custom indicator for identifying stocks that meet the Stockbee's Reversal Bullish New criteria. This can be used as a standalone indicator or use it to screen for stocks in Pine Screener.
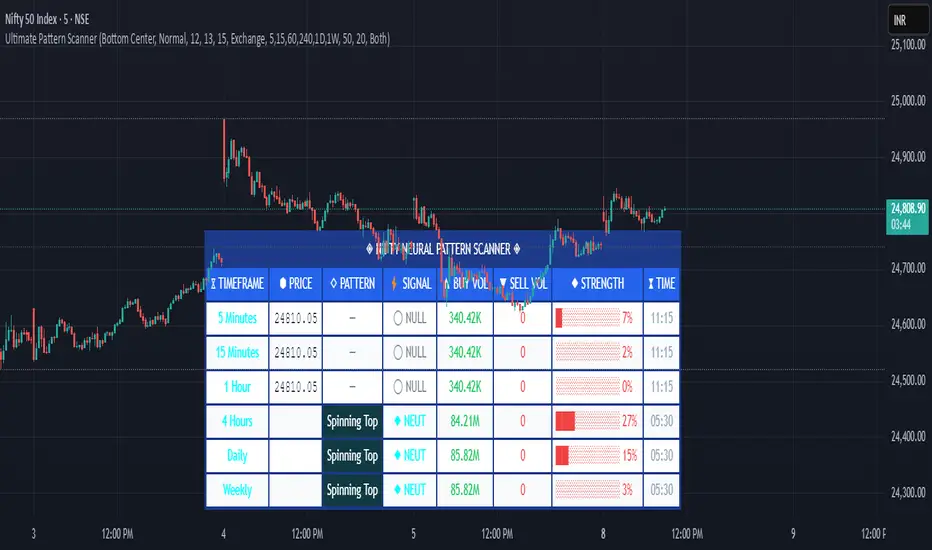
Pattern ScannerUltimate Pattern Scanner — multi-timeframe candlestick discovery tool (educational use only).
Purpose: This script scans user-selected timeframes for classical candlestick patterns (for example: engulfing, morning/evening stars, hammers, dojis, tasuki gaps, three soldiers/crows, tweezers, marubozu, and others) and reports pattern name, detection price, directional signal (Bull / Bear / Neutral), and a simple volume participation metric. It is intended as an idea-generation and training tool to help traders learn pattern mechanics, not as an automated trading system.
Main modules and rationale: 1) Pattern engine — applies classical candle structure rules to detect formations; 2) SMA trend filter (configurable length) — provides a directional bias to favor trade-with-trend setups; 3) Volume heuristic — approximates participation by separating candles into buy-like and sell-like volume and comparing total volume to a moving average; 4) Multi-timeframe aggregator — collects and presents pattern results from multiple timeframes; 5) Alerts — optional alerts list detected patterns and TFs. Combining these modules is intentional: patterns provide structure, SMA provides context, and volume supplies participation confirmation. Together they improve the educational value and practical relevance of each detected pattern.
How to use: Choose timeframes and SMA length that match your trading horizon. Use the scanner to locate pattern candidates, then confirm with higher-timeframe agreement and volume ratio before considering trade entry. Use structural stops (recent swing highs/lows or ATR-based stops) and define risk:reward rules. For learning, replay alerted bars and record outcomes over fixed horizons to build empirical statistics.
Limitations: Volume classification (close>open) is a heuristic and not a true bid/ask tape. SMA is a lagging trend proxy. Multi-timeframe agreement reduces but does not eliminate false signals, especially around news or in low-liquidity instruments. Use demo accounts and backtesting before live trading.
Inputs you can adjust: timeframe list, SMA length, volume MA length, which patterns to enable/disable, display options.
Compliance notes: This description explains why modules are combined and what the script does without exposing source code logic; it is non-promotional and contains no contact links. Remove any trademark symbols unless registration details are provided.
Risk Disclaimer: This tool is provided for education and analysis only. It is not financial advice and does not guarantee returns. Users assume all risk for trades made based on this script. Backtest thoroughly and use proper risk management.
DJPeeno - NY Open First 15 Minutes (Box + Alerts)Outlines NY open 15 Min low and high. Useful for 15 min orb trading strategy.

Cumulative Volume Delta Candles Aggregated (Lite)Cumulative Volume Delta Candles Aggregated (Lite)
Multi-Exchange CVD Visualization in Candle Format
This indicator provides an aggregated Cumulative Volume Delta (CVD) view across multiple major perpetual futures exchanges in one chart. It is designed for traders who want a broader perspective on buying and selling pressure without switching between multiple charts or relying on a single exchange feed.
What It Does
Combines volume delta data from Binance, Bybit, OKX, Bitget, and Coinbase into a unified representation.
Displays CVD as candlesticks, where each candle reflects the open, high, low, and close of cumulative delta for the selected period.
Offers a clear visual of how buying and selling pressure evolves across markets in a structured, familiar candle format.
Key Features
✔ Exchange Aggregation: Incorporates data from several top futures markets available on TradingView.
✔ Anchor Reset: Allows you to set an anchor timeframe (e.g., daily) to reset cumulative values for better readability and analysis.
✔ Unit Normalization: Since exchanges report volumes in different units, the indicator normalizes all data and outputs values denominated in the base currency (coins) for consistency.
✔ Hidden OHLC Outputs: Provides open, high, low, and close values as hidden plots for use with other indicators or strategies.
✔ Lightweight Design: Optimized for efficiency while handling multiple real-time data requests.
Why It’s Different
Unlike standard single-exchange CVD tools, this indicator aggregates the majority of perpetual volume data available on TradingView, offering a more representative view of market sentiment. The candle-based representation of CVD introduces an additional layer of structure, helping traders identify shifts in momentum and pressure with more context than a simple cumulative line.
Use Cases
- Spotting aggregated buy/sell pressure trends across multiple exchanges.
- Confirming breakout or reversal signals with broader volume delta context.
- Serving as a custom data source for other indicators or algorithmic strategies.

Turtle Body Setup by TradeTech AnalysisOverview
Turtle Body Setup is a minimalist, rules-based pattern detector built around a simple idea: a sequence of shrinking candle bodies (compression) often precedes a directional expansion (breakout). The script identifies those compression phases and then flags the first candle whose body expands significantly beyond the recent average, with polarity taken from the candle’s direction.
This is not a mash-up of many public indicators. It focuses on one original micro-structure concept: strict body-contraction → body-expansion . The logic is fully described below so traders and moderators can understand what it does and how to use it.
How it Works
1. Compression detection (body contraction):
• Over a user-defined window Compression Lookback (N), the script counts strictly shrinking candle bodies (|close-open|).
• When the count ≥ Min Shrinking Candles, we mark the market as in compression.
2. Expansion / Breakout qualification:
• Compute avgBody = SMA(body, N).
• A candle is a breakout when current body > avgBody × Breakout Body Multiplier.
• Polarity: green (close>open) → Bullish breakout; red (close

Engulfing Pro v1Engulfing Pro v1 — Pro Inside (C2-in-wick) signals
Engulfing Pro v1 finds a precise three-bar sequence designed to catch clean continuations or turns after an impulsive move. The signal—called Pro Inside—fires when price closes back inside the wick of a prior engulfing bar, often indicating a controlled pullback into freshly swept liquidity.
What it detects
Engulfing pre-condition (Bars -2 → -1):
A strict bullish or bearish body engulfing occurs one bar before the signal (larger body, full body containment).
Pro Inside signal (Bar 0 / C2):
The current bar (C2) closes inside the wick of the engulfing bar (C1):
Bullish: C2 closes inside C1’s upper wick
Bearish: C2 closes inside C1’s lower wick
Optional C3 confirmation (info only):
The next bar closes beyond C2’s extreme (above for bullish, below for bearish).
Why it matters
The “close-inside-wick” structure frequently marks a measured pullback after momentum just flipped (engulfing), offering a clear, rules-based entry with defined invalidation.
Inputs
Show Pro Inside (Bullish) — toggle bullish signals
Show Pro Inside (Bearish) — toggle bearish signals
Change bar color on signal (C2) — color C2 (lime/red)
Plot markers — C2 triangles and ✔ on C3 confirmations
Boundary padding (ticks) — nudge wick bounds to reduce marginal touches
Visuals & Alerts
Markers:
“C2” triangle up/down on qualifying bars
“✔” circle on C3 confirmations
Alert names:
Pro Inside (Bullish)
Pro Inside (Bearish)
Pro Inside — Bullish C3 confirmation
Pro Inside — Bearish C3 confirmation
How to use (ideas, not advice)
Entry: Aggressive at/after C2 close; conservative on C3 confirmation.
Stops: Common placements beyond the opposite side of C2, or beyond C1’s wick.
Confluence: Pair with market structure, higher-timeframe bias, or Supply & Demand zones for selectivity.
Timeframes/markets: Works on any symbol/TF; adapt padding for volatility.
Notes
Evaluates on bar close (no look-ahead).
Visual/alert tool for study and workflow—not financial advice.
Always forward-test and risk-manage appropriately.

Opening Range Suite by SBSniperOpening Range Suite
An all-in-one opening-range tool suite. It draws the 30-second, 5-minute, and 30-minute opening ranges for the AM session (09:30 NY). Each range is highlighted with a rectangle (high/low with midpoint) and can display a full pack of projection levels.
⸻
What it draws
• AM 09:30 ORs: 30s, 5m, 30m ranges.
• Midpoint line inside each box.
• Projections from the opening range (measured both High→Low and Low→High) at:
−0.5, −1, −1.5, −2, −2.5, −3, −3.5, −4.
• Text labels inside rectangles (fixed text):
AM — “OR 30sec / OR 5min / OR 30min”; PM — “PM 30sec / PM 5min / PM 30min”.
⸻
Smart behavior
• Today always extends to the current bar (so the current session’s box grows with price/time).
• Previous 5 days of each selected range are shown and, by default, extend to 12:00 NY for AM and 16:00 NY for PM (2.5h span).
Toggle available to extend previous 5 out to the current bar instead.
• Projection day cap: You choose how many recent days (including today) draw projection lines. This prevents chart clutter and avoids TradingView object limits.
• Weekend skip: Automatically ignores Saturdays and Sundays based on New York time.
• Single label toggle: Turn all labels on/off; styling and text are fixed for clarity and consistency.
⸻
How ranges are calculated
• The script anchors to New York local time and detects:
• AM session: 09:30 → grabs the 30s/5m/30m bar(s) that open at 09:30:00 NY.
• Each range uses the bar’s high/low, draws a rectangle spanning the selected time window, and plots the midpoint.
⸻
Notes & best practices
• The 30-second OR requires a symbol/data plan that provides 30-second bars. If your feed doesn’t have 30s, keep the 30s toggles off and use 5m/30m.
• Use on intraday charts. The tool relies on bar times to align with NY session opens.
• For non-US symbols or 24/7 markets, NY anchoring still works; just be aware that “open” is tied to 09:30 New York time.

ICT Sessions & Killzones +PRO (VinceFxBT)ICT Sessions & Killzones +PRO (VinceFxBT)
All in one Session and Killzone script for FX, Futures and Crypto markets. It includes London, New York, CBDR & Asia Sessions and Killzones.
Features
Includes London, New York, Asia, CBDR sessions
Includes all ICT Killzones
Extended session highs/lows up to 90s back, until mitigated.
Set recurring alerts for session highs and lows
Includes Indices price levels and opens
Uses UTC timezones with automatic Daylight Saving Time so NO timezone correction needed ; ) Works out of the box for all regions, including different dates of DST for US/EU.
Session highs/lows displayed on chart as lines, box or background color
Customize line styles, width and colors
Customize colors for Sessions and Killzones
Optionally include weekends for Session or Killzone separately
Optionally display day separators and labels
Fully control which options are displayed at higher or lower timeframes. (e.g. hide sessions when timeframe is 1h or higher)
Session display options
Session Background Color.
Session High & Low Lines, including Session Middle Line.
Extended session highs/lows until mitigated
Extended Session Highs & Lows until mitigated.
Session Background Color with extended Asia Session Highs & Lows until mitigated.
Set recurring alerts for session highs and lows
Set automatic alerts when previous and/or current session levels are broken.

RB — Rejection Blocks (Price Structure)This indicator detects and visualizes Rejection Blocks (RBs) using pure price action logic.
A bullish RB occurs when a down candle forms a lower low than both its neighbors. A bearish RB occurs when an up candle forms a higher high than both its neighbors.
Validated RBs are displayed as boxes, optional lines, or labels. Blocks are automatically removed when invalidated (price closes through them), keeping the chart uncluttered and focused.
How to use
• Apply on any timeframe, from intraday to higher timeframes.
• Watch how price reacts when revisiting RB zones.
• Treat these zones as contextual areas, not entry signals.
• Combine with your own trading methods for confirmation.
Originality
Unlike generic support/resistance tools, this indicator isolates a specific structural pattern (rejection blocks) and renders it visually on the chart. This selective focus allows traders to study structural reactions with more clarity and precision.
⚠️ Disclaimer: This is not a trading system or a signal provider. It is a visual analysis tool designed for structural and educational purposes.

Candle Opening Price & FVG/iFVGIndicator Description: Candle Opening Price & Fair Value Gaps w/(iFVGs)
This powerful, multi-purpose indicator combines two essential trading concepts into one comprehensive tool, designed to provide traders with key price levels and areas of market imbalance.
What It Does
1. Customizable Candle Open Lines: This feature allows you to mark the opening price of specific candles from key trading sessions throughout the day.
Up to 7 Custom Time Inputs: You can define up to seven different times (e.g., "08:30" for London Open, "09:30" for New York Open).
Automatic Horizontal Lines: The script automatically draws a persistent horizontal line at the opening price of the candle corresponding to your set time.
Full Customization: Each line can be independently enabled or disabled and styled with a unique color, width, and line style (solid, dashed, dotted), allowing for a clean and personalized chart setup.
Use Cases: Ideal for marking session opens, news event candles, or any other time-based level that you consider significant for support, resistance, or directional bias.
2. Dynamic Fair Value Gaps (FVG) & Inversions (iFVG): This part of the indicator automatically identifies, draws, and manages Fair Value Gaps, a core concept in modern price action trading.
Automatic FVG Detection: The script identifies both Bullish FVGs (areas of buying inefficiency) and Bearish FVGs (areas of selling inefficiency) based on the classic three-bar pattern.
Clear Visualization: Discovered FVGs are drawn as colored boxes on the chart, extending into the future until they are mitigated. Colors for Bullish and Bearish FVGs are fully customizable.
Inversion Logic: When price wicks into an FVG, the box changes color to signify an "inversion." A Bullish FVG that gets tapped becomes potential resistance (Bearish Inversion), and a Bearish FVG becomes potential support (Bullish Inversion). This dynamic shift helps you track how the market is interacting with these zones.
Zone Mitigation: Once an inverted FVG is fully reclaimed by a candle close, the zone is considered "mitigated" and the box is automatically removed from the chart, keeping your view focused on relevant, active zones.
Disclaimer
This indicator is for educational and informational purposes only and should not be construed as financial advice. Trading in financial markets involves substantial risk, and there is always the potential for loss. Past performance is not indicative of future results.
The signals, levels, and zones generated by this tool are based on historical price data and mathematical formulas; they do not predict the future with certainty. You should always conduct your own research, practice sound risk management, and consult with a qualified financial advisor before making any trading decisions. The author and TradingView are not responsible for any financial losses you may incur by using this script. Use at your own risk.
B A N K $ - HTF Candle Boxes (Power of 3)This indicator allows you to visualise the HTF candles on the LTF's, this is useful for using the Power of 3 / Accumulation, Manipulation & Distribution concepts.
By default, the HTF interval is set to 1h, this means that an outline will be created around the LTF candles that are within that 1h window. (i.e from 13:00-14:00 etc).
Features
HTF Interval Selector - this allows the user to customise which HTF interval to use
Candle Boxes - this outlines the full outer perimeter of the relevant candles
Include Body - this highlights the distance between the candle Open & Close
Show MidLine
Additional Settings
Hide Side Lines - this will only draw the Top & Bottom lines
Extend Lines to Current Candle - most recent Top & Bottom lines will extend to current price
Draw Lines from Exact Candle - this makes the most recent candle lines cleaner
I personally use this indicator to outline the most recent 3 1h candles to make it easier to identify sweeps & reversals however there is additional functionality to allow the user to customise the indicator to their preference.