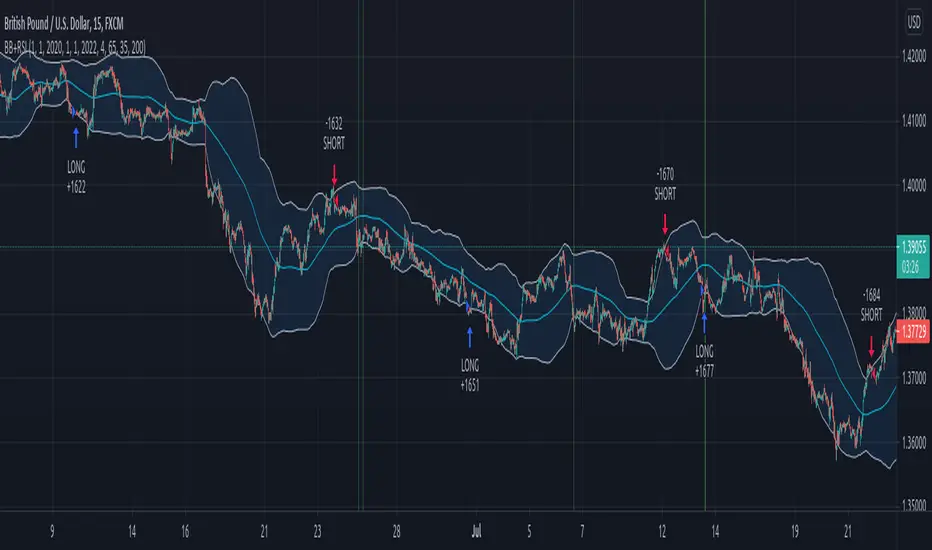
AlignedMA and Cumulative HighLow StrategyCombining the indicators:
1. Aligned Moving Average Index :
2. Cumulative High Low Index :
3. Supertrend
Works best in long only for crypto and precious metals.
My scenario is to present how much you can earn by investing 1000 for full 10 years. Hence, I am using fixed 1000 initial deposit and 100% equity per trade without any pyramiding. This allows us to compare gains to buy and hold.
트렌드 어낼리시스
PMax Explorer STRATEGY & SCREENERProfit Maximizer - PMax Explorer STRATEGY & SCREENER screens the BUY and SELL signals (trend reversals) for 20 user defined different tickers in Tradingview charts.
Simply input the name of the ticker in Tradingview that you want to screen.
Terminology explanation:
Confirmed Reversal: PMax reversal that happened in the last bar and cannot be repainted.
Potential Reversal: PMax reversal that might happen in the current bar but can also not happen depending upon the timeframe closing price.
Downtrend: Tickers that are currently in the sell zone
Uptrend: Tickers that are currently in the buy zone
Screener has also got a built in PMax indicator which users can confirm the reversals on graphs.
Screener explores the 20 tickers in current graph's time frame and also in desired parameters of the SuperTrend indicator.
Also you can optimize the parameters manually with the built in STRATEGY version.
PMax indicator :
Profit Maximizer - PMax is a brand new indicator developed by me.
It's a combination of two trailing stop loss indicators;
One is Anıl Özekşi's MOST (Moving Stop Loss) Indicator
and the other one is well known ATR based SuperTrend
Profit Maximizer - PMax tries to solve this problem. PMax combines the powerful sides of MOST (Moving Average Trend Changer) and SuperTrend (ATR price detection) in one indicator.
Backtest and optimization results of PMax are far better when compared to its ancestors MOST and SuperTrend. It reduces the number of false signals in sideways and give more reliable trade signals.
PMax is easy to determine the trend and can be used in any type of markets and instruments. It does not repaint.
The first parameter in the PMax indicator set by the three parameters is the period/length of ATR.
The second Parameter is the Multiplier of ATR which would be useful to set the value of distance from the built in Moving Average.
I personally think the most important parameter is the Moving Average Length and type.
PMax will be much sensitive to trend movements if Moving Average Length is smaller. And vice versa, will be less sensitive when it is longer.
As the period increases it will become less sensitive to little trends and price actions.
In this way, your choice of period, will be closely related to which of the sort of trends you are interested in.
We are under the effect of the uptrend in cases where the Moving Average is above PMax;
conversely under the influence of a downward trend, when the Moving Average is below PMax.
Built in Moving Average type defaultly set as EMA but users can choose from 8 different Moving Average types like:
SMA : Simple Moving Average
EMA : Exponential Movin Average
WMA : Weighted Moving Average
TMA : Triangular Moving Average
VAR : Variable Index Dynamic Moving Average aka VIDYA
WWMA : Welles Wilder's Moving Average
ZLEMA : Zero Lag Exponential Moving Average
TSF : True Strength Force
Tip: In sideways VAR would be a good choice
You can use PMax default alarms and Buy Sell signals like:
1-
BUY when Moving Average crosses above PMax
SELL when Moving Average crosses under PMax
2-
BUY when prices jumps over PMax line.
SELL when prices go under PMax line.
Donchian Channels Strategy - Long Term TrendFor Educational Purposes. Results can differ on different markets and can fail at any time. Profit is not guaranteed.
This only works in a few markets and in certain situations. Changing the settings can give better or worse results for other markets. This is a longer term trend following strategy that uses Donchian Channels for trend following and uses the upper and lower bands to find price breakouts to enter the market and then uses the middle band as a trailing stop to exit. DCs are known as the original trend following strategy made by Richard Donchian.
Usually the middle band uses the same length of the upper and lower bands in its calculation but I included the default option of using a middle band that is double the length of the other bands, but also an option to use the regular input length that most Donchian strategies use if needed. If long term trends are somehow found, this longer middle band lets the profits run longer and lets you see where the long trends were at if the market had any. The double lengthed middle band looks surprisingly very similar to a 3x ATR trailing stop, which is the recommended setting Wilder suggested for trend following. If a good ATR stop or other trailing stop can't be found, this longer middle band can act as a substitute for it.
For some reason I can't seem to find anything related to Donchian strategies on here despite the popularity and simplicity of it, not even a single working one to my liking, so I made my own. It seems this strategy only works in trending markets. I intentionally handpicked a market that the backtest does well on to illustrate the potential it might have for other markets where trending following strategies might work on and what to expect the results in those might be. Trend following strategies are said to have high profits but at the same time lower accuracy due to the failure rate of being able to catch the right trend. If you all got any suggestions or feedback please let me.
Combo Backtest 123 Reversal & Fractal Chaos Oscillator This is combo strategies for get a cumulative signal.
First strategy
This System was created from the Book "How I Tripled My Money In The
Futures Market" by Ulf Jensen, Page 183. This is reverse type of strategies.
The strategy buys at market, if close price is higher than the previous close
during 2 days and the meaning of 9-days Stochastic Slow Oscillator is lower than 50.
The strategy sells at market, if close price is lower than the previous close price
during 2 days and the meaning of 9-days Stochastic Fast Oscillator is higher than 50.
Second strategy
The value of Fractal Chaos Oscillator is calculated as the difference between
the most subtle movements of the market. In general, its value moves between
-1.000 and 1.000. The higher the value of the Fractal Chaos Oscillator, the
more one can say that it follows a certain trend – an increase in prices trend,
or a decrease in prices trend.
Being an indicator expressed in a numeric value, traders say that this is an
indicator that puts a value on the trendiness of the markets. When the FCO reaches
a high value, they initiate the “buy” operation, contrarily when the FCO reaches a
low value, they signal the “sell” action. This is an excellent indicator to use in
intra-day trading.
WARNING:
- For purpose educate only
- This script to change bars colors.
Golden Cross Optimised For Reversal (by Coinrule)A moving average crossing is a common and widely adopted trading strategy. A short-term MA crossing above a long-term one provides the buy-signal. The opposite generates a sell-signal for the strategy.
Although very popular, this strategy has some limitations that lead to frequent "false signals" and only a few very profitable trades. If the strategy provides two many trades, that generates
the risk for more potential losses
more transaction fees paid
capital allocated to the strategy, thus the impossibility of catching other potential opportunities.
Applying an additional filter to the strategy, consisting of the crossing happening below a longer-term moving average, allows increasing the chances of catching the first crossing signaling a reversal.
The indicator is set to work with three moving averages.
Buy signal: The MA(9) to cross above the MA(50), which must be below the MA(100)
Sell Signal: The MA(9) to cross below the MA(50)
This indicator works significantly better on lower time frames, where it can reduce the noise of getting too many non-profitable signals from a conventional crossing strategy.
The indicator has been backtested mostly on cryptocurrencies.
BNB Burn BuyerThis strategy is only meant to be used on BNB.
It's more of an inconclusive analysis of the effect of BNB's quarterly coin burn.
To date there have been 13 coin burns.
According to Binance's whitepaper, each quarter, they will burn BNB based on their trading volume until 50% of all BNB is burned. They eventually will destroy 100MM BNB, leaving 100MM BNB remaining.
Historically, coin burns for the 3rd quarter happen around October 17th-18th. So keep an eye out for those dates.
I built this strategy to run some experiments and test the fundamental effect a known coin burn has on the price. So far more testing is needed. So leave your insights and comments below!
Turtle Trend Trading System [racer8]This is the Turtle traders' actual system which uses a 55 period channel for entries & a 20 period channel for exits. Enjoy ;)
Donchian Channels System [racer8]Donchian Channels was developed by Richard Donchian in 1949. They have been used with great success by the Turtles, a group of traders in the 1980s who managed to obtain returns of 80% annually. Truly incredible story.
This particular indicator is a trend trading system I coded that shows you when to enter long or short and when to exit those longs or shorts.
In addition, this indicator shows the past performance results that are incredibly valuable information for backtesting this system.
The high, mid, and low lines have been plotted to show how this system works. The blue line is the high line. The gray line is the mid line. The red line is the low line.
Entry signals are generated when the current close closes above the highest price for a long trade or below the lowest price for a short trade over n periods.
Exit signals are generated when the current close crosses the mid-line (aka. baseline) and closes.
Baseline = (highest price + lowest price)/2
I encourage you to play around with the settings, although I reccomend avoiding any period below 14.
This system is no bullshit, it's the real deal.
Good luck traders, and enjoy ;)
2 Candles Inside ATR2 agitated candles falling inside ATR range, awaiting possibly a big move.
Buy / Sell signals at combined high / low can be used as order with other as stop loss.
Counter trade, when this minimal stop loss is hit, is also as useful. However, wait till the SL candle closes, before opening position on the other side.
Works quite well on 15 mins chart, with settings of ATR duration 25 and multiplier 0.6. These settings are configurable, so feel free.
Golden Triangle StrategyGolden Triangle strategy setup is a variation of the buy-the-dip strategy, by Charlotte Hudgin.
You can find the detailed explanation here by Thomas N. Bulkowski thepatternsite.com
BUY
===
1. price should be trading above sma50
2. when it touches sma50 first time , check the starting rallypoint of where it initiated
3. from the above point to current close , see if you have white space , then draw the triangle
4. then check for volume confirmation ( current volume should be greater than last 4 ) --- I have slightly changed this to fit into hourly strategy by adding condition close>vwap
EXIT
====
1. Exit when close crossing down sma50 with at least 2% profit (slightly modified original condition)
StopLoss
========
2. stop loss is set to 6%
Warning
=======
For the use of educational purposes only
Automated - Fibs with Market ordersThis script was recently shared for limit only orders here:
This version does not worry about keeping orders in the books and moving them around, instead it will simply market in and out.
I am sharing this to reveal the difference between the 2 setups.
TrianglePoint strategyThis is trend following strategy ... when price is trading well above 200 ema and forms a triangle (based on number of bars defined)
BUY
====
when fast ema > 200 ema
check for triangle of last N bars (default set to 9)
EXIT
======
when fast ema crosses down middle term ema
if price reaches above 5% of buy , it changes the color to purple. You can close any time or wait for above signal.
STOP LOSS
=======
stop loss default value set to 5%
Note: No triangle shown on the chart. I will find out how to add the lines to the chart.
Warning
=========
For the use of educational purposes only
Automated - Fibs with Limit only ordersAutomated - Fibs with Limit only orders
This script was designed to demonstrate how you can use a single alert to move your limit orders around.
It is not meant to be traded live and has been built to work with Binance Futures Testnet.
You will notice a lot of plots with 5 different titles.
New = Place your limit buy at a fixed-price.
Move = Cancel the current limit buy and place it at the new fixed-price.
Filled = Cancel any limit closes and places them anew based on the new average and take profit.
Cancel = Cancels exisiting limit buys.
Cloes All = Limit close filled, no commands necessary.
The default quantity in the command is the minimum order size on Binance.
Settings
Live
- If enabled it will only place trades after the "Stat Timestamp + Start Delay" that you provide.
Start Timestamp
- Use something similar to epochconverter to get the current timestamp.
Start Delay
- Gives you 1 minute by default to start the script and create your alert before it begins looking for a new entry.
Leverage
- Default 1. Affects the "Take Profit and DCA When" Settings.
Take Profit %
- This is the percentage above the current average you'd like to place your position close at.
DCA When %
- The percentage below your last entry that you're willing to buy again.
Note: This strategy has no stop-loss and pyramiding is enabled. It is not built for, or recommended to run live.
I hope this opens some doors and helps advance your personal trading system.
Good luck and happy scripting!
Super Guppy StrategyCM Super Guppy with Long/Short signals, backtesting, and additional options. Updated for PineScript v4.
COINBASE:BTCUSD
Features 2 primary modes, depending on your risk profile. These options are available in the settings:
"Early Signals" ON (default):
Prints a "long" on grey to green transitions AND red to gray transitions.
Prints a "short" on green to grey transitions AND gray to red transitions.
Will not print back-to-back repeated positions (i.e. green → grey → red will only print the first green → gray "short" signal and not print "short" twice).
Rotates long and short positions with no delay.
"Early Signals" OFF
Will close trades, but never open new ones, when guppy transitions to from any color to gray.
Open long: guppy transitions gray to green.
Close long: guppy transitions green to gray.
Open short: guppy transitions gray to red.
Close short: guppy transitions red to gray.
Does not rotate long and short positions back to back.
Additionally:
Can toggle on/off the 200EMA. Default is off.
Can toggle on/off short positions. Default is on.
In development: alerts
Reversal closing priceThe reversal closing price (RCP) is a candlestick pattern which follows two simples rules:
the low price of current candle needs to be lower than the low price of the last 2 candles
the closing price of current candle needes to be higher than the closing price of the last candle
This generates a signal for a long position. For a short position, the conditions are inverted:
the high price of current candle needs to be higher than the high price of the last 2 candles
the closing price of current candle needes to be lower than the closing price of the last candle
Since RCP is a trend follower indicator, the strategy is programmed in such a way that long positions are only placed if the short period EMA is above the long period EMA, and short positions are only placed if the short EMA is bellow the long EMA. Both periods are configurable, and should be ajusted for each asset.
This strategy uses a fixed stop loss and take profit, and the it's ratio is configurable. The stop price is one tick lower than the lowest price of X candles prior to the order execution for long positions, while in short positions it's one tick higher than the higher price. The amount of candles to lookback (X) is configurable. Both stop and take profit prices are displayed, the first as a red line, and the second as a green line.
This is the setting that I've found to work best with TVC:SPX , but you may find a better setting. While the RCP is universal, it's placement depends on the trend and it's strenght, something that is very heterogeneous among assets.
I really wish that I was able to place images, but I don't have PRO, so text will have to do.
This strategy was designed by Alexandre Wolwacz, a.k.a. Stormer.
Combo Backtest 123 Reversal & Fractal Chaos Bands This is combo strategies for get a cumulative signal.
First strategy
This System was created from the Book "How I Tripled My Money In The
Futures Market" by Ulf Jensen, Page 183. This is reverse type of strategies.
The strategy buys at market, if close price is higher than the previous close
during 2 days and the meaning of 9-days Stochastic Slow Oscillator is lower than 50.
The strategy sells at market, if close price is lower than the previous close price
during 2 days and the meaning of 9-days Stochastic Fast Oscillator is higher than 50.
Second strategy
Stock market moves in a highly chaotic way, but at a larger scale, the movements
follow a certain pattern that can be applied to shorter or longer periods of time
and we can use Fractal Chaos Bands Indicator to identify those patterns. Basically,
the Fractal Chaos Bands Indicator helps us to identify whether the stock market is
trending or not. When a market is trending, the bands will have a slope and if market
is not trending the bands will flatten out. As the slope of the bands decreases, it
signifies that the market is choppy, insecure and variable. As the graph becomes more
and more abrupt, be it going up or down, the significance is that the market becomes
trendy, or stable. Fractal Chaos Bands Indicator is used similarly to other bands-indicator
(Bollinger bands for instance), offering trading opportunities when price moves above or
under the fractal lines.
The FCB indicator looks back in time depending on the number of time periods trader selected
to plot the indicator. The upper fractal line is made by plotting stock price highs and the
lower fractal line is made by plotting stock price lows. Essentially, the Fractal Chaos Bands
show an overall panorama of the price movement, as they filter out the insignificant fluctuations
of the stock price.
WARNING:
- For purpose educate only
- This script to change bars colors.
VWAP and BB strategy [EEMANI]This strategy combines VWAP and BB indicators
BUY RULE
1. EMA50 > EMA 200
2. if current close > vwap session value
3. check if price dipped BB lower band for any of last 10 candles
EXIT RULE
1. price closes above BB upper band
STOP LOSS EXIT
1. As configured --- default is set to 5%
warning: for the use of educational purposes only
Function Polynomial Regression StrategyTo be clear I'm using the code from Richard Santos for the functional polynomial regression. I really loved his script idea (given that I'm into linear regression myself). I took his code and made a strategy which applies to bitcoin on the 5 minute chart (but you could adjust this for any asset), and you could make this work on anytime frame by adjusting the 'length' property of the regression until you get good results.
This strategy is very simple.
I drew lines to represent the bottom most part of the regression (green line), and top most part (red line). If the close crosses under the red line then you short. The reverse if it crosses above the green line then you go long.
Very simple but effective. To understand this script be sure to add Richard santos function polynomial regression so you can see what is going on and what I'm trying to do.
For example, on BTC with a length of 61 if you bought and held you would have only had 5% gain, instead with this strategy you are looking at very close to 60% gains! Now this could be a weird fluke of over-optimizing but I'm not sure this is the case because you can adjust the length from there +/- about 10 and still have good results. It's just certain lengths are the correct trading rhythms for different assets.
I'm excited to see how you guys use this and if you have any success. Be sure to thank Richard Santos for his great work!
The Strategy - Ichimoku Kinko Hyo and moreThe purpose of this strategy is to make the signals from my scripts available for verification by backtests. Different signal and filter combinations can be created and specific manual parameter optimization can be carried out.
In detail, this strategy includes:
23 entry signals
two entry filters with each 9 filters
two exit filters with each 9 filters
take profit and stop loss
time period for backtesting
Linear trendBy request of a user
I just put this indicator which is a linear regression that work on same logic as super trend
the control is by length (len) and the deviation
there is alerts and signals
try to find best settings according to your needs
it can done in a different way as well
this one seems to work nice on stocks
ADX strategy (considering ADX and +DI only )I have been checking the strategies on ADX indicator.
I have found that +DI crossing above ADX line under threshold 30 and exit on crossdown when ADX above 30 has better results than just following crossovers of +DI and -DI , ADX crossing above 30 .
BUY Rule
========
fast ema is above slow ema (default 13 and 55 , you can change these values in settings)
+DI cross above ADX well beloe threshold level (default 30)
Exit reule
========
when +DI cross down ADX , well above on threshold level
Stop Loss
=========
Default is set to 8%
Take a look and let me know how your symbol works with this strategy
Note : Bar color changes to yellow when the BUY condition is met.
Bar color and Background color shows to blue --- if Long position is active
fast ema and long ema doesnt print on the chart -- please add manually to the chart
Warning : for the use of educational purposes only
STRATEGY TESTER ENGINE - ON CHART DISPLAY - PLUG & PLAYSo i had this idea while ago when @alexgrover published a script and dropped a nugget in between which replicates the result of strategy tester on chart as an indicator.
So it seemed fair to use one of his strategy to display the results.
This strategy tester can now be used in replay mode like an indicator and you can see what happen at a particular section of the chart which was is not possible in default strategy tester results of TV.
Please read how each result is calculated so you will know what you are using.
This engine shows most common results of strategy tester in a single screen, which are as follows:
1. Starting Capital
2. Current Profit Percentage
3. Max Profit Percentage
4. Gross Profit
5. Gross Loss
6. Total Closed Trades
7. Total Trades Won
8. Total Trades Lost
9. Percentage Profitable
10. Profit Factor
11. Current Drawdown
12. Max Drawdown
13. Liquidation
So elaborating on what is what:
1. Starting Capital - This stays 0, which signifies your starting balance as 0%. It is set to 0 so we can compare all other results without any change in variables. If set to 100, then all the results will be increased by 100. Some users might find it useful to set it to 100, then they can change code on line 41 from to and it should show starting balance as 100%.
2. Current Profit Percentage - This shows your current profit adjusted to current price of the candle, not like TV which shows after candle is close. There is a comment on the line 38 which can be removed and your can see unrealized profit as well in this section. Please note that this will affect Draw-down calculations later in this section.
3. Max Profit Percentage - This will show you your max profit achieved during your strategy run, which was not possible yet to see via strategy tester. So, now you can see how much profit was achieved by your strategy during the run and you can compare it with chart to see what happens during bull-run or bear-run, so you can further optimize your strategy to best suit your desired results.
4. Gross Profit - This is total percentage of profit your strategy achieved during entire run as if you never had any losses.
5. Gross Loss - This is total percentage of loss your strategy achieved during entire run as if you never had any profits.
6. Total Closed Trades - This is total number of trades that your strategy has executed so far.
7. Total Trades Won - This is the total number of trades that your strategy has executed that resulted in positive increase in equity.
8. Totals Trades Lost - This is the total number of trades that your strategy has executed that resulted in decrease in equity.
9. Percentage Profitable - This is the ratio between your current total winning trades divided by total closed trades, and finally multiplied by 100 to get percentage results.
10. Profit Factor - This is the ratio between Gross Profit and Gross Loss, so if profit factor is 2, then it indicates that you are set to gain 2 times per your risk per trade on average when total trades are executed.
11. Current Drawdown - This is important section and i want you to read this carefully. Here draw-down is calculated very differently than what TV shows. TV has access to candle data and calculates draw-down accordingly as per number of trades closed, but here DD is calculated as difference between max profit achieved and current profit. This way you can see how much percentage you are down from max peak of equity at current point in time. You can do back-test of the data and see when peak was achieved and how much your strategy did a draw-down candle by candle.
12. Max Drawdown - This is also calculated differently same as above, current draw-down. Here you can see how much max DD your strategy did from a peak profit of equity. This is not set as max profit percentage is set because you will see single number on display, while idea is to keep it custom. I will explain.
So lets say, your max DD on TV is 30%. Here this is of no use to see Max DD , as some people might want to see what was there max DD 1000 candles back or 10 candle back. So this will show you your max DD from the data you select. TV shows 25000 candle data in a chart if you go back, you can set the counter to 24999 and it will show you max DD as shown on TV, but if you want custom section to show max DD , it is now possible which was not possible before.
Also, now let's say you put DD as 24999 and open a chart of an asset that was listed 1 week ago, now on 1H chart max DD will never show up until you reach 24999 candle in data history, but with this you can now enter a manual number and see the data.
13. Liquidation - This is an interesting feature, so now when your equity balance is less than 0 and your draw-down goes to -100, it will show you where and at what point in time you got liquidated by adding a red background color in the entire section. This is the most fun part of this script, while you can only see max DD on TV.
------------------------------------------------------------------------------
How to Use -
1 word, plug and play. Yes. Actual codes start from line 33.
select overlay=false or remove it from the title in your strategy on first line,
Just copy the codes from line 33 to 103,
then go to end section of your strategy and paste the entire code from line 33 to line 103,
see if you have any duplicate variable, edit it,
Add to chart.
What you see above is very contracted view. Here is how it looks when zoomed in.
imgur.com
----------------------------------------------------------------------------------
Feel free to edit and share and use. If you use it in your scripts, drop me tag. Cheers.
Long Term Breakout entry + 25% Trailing stopThis script enters on a long term breakout and exits using a 25% trailing stop
ZVWAP strategyThis strategy is based on Z distance from VWAP indicator by LazyBear
I have added few filters to utilize the indicator ...
BUY Rule
=======
1. fast ema is above slow ema
2. zvwap is dipped below oversold area (default set to -0.5)
3. after the dip , while crossing above zero --- BUY
Note , when the above criteria is met , bar color is changed to yellow
Exit Rule
========
1. Exit when zvwap enters overbought line (default set to 2.0)
Stop Loss
========
default set to 5% ( you can change it in settings )
Note : strategy does not draw ema lines on the chart. Please add manually to your chart
warning: for education purposes only