MornStoch 10Mscription : Combine 3 major stochastics
Use : to be used on the 5 mins timeframe , showing the 10 mins stochs
스토캐스틱 오실레이터


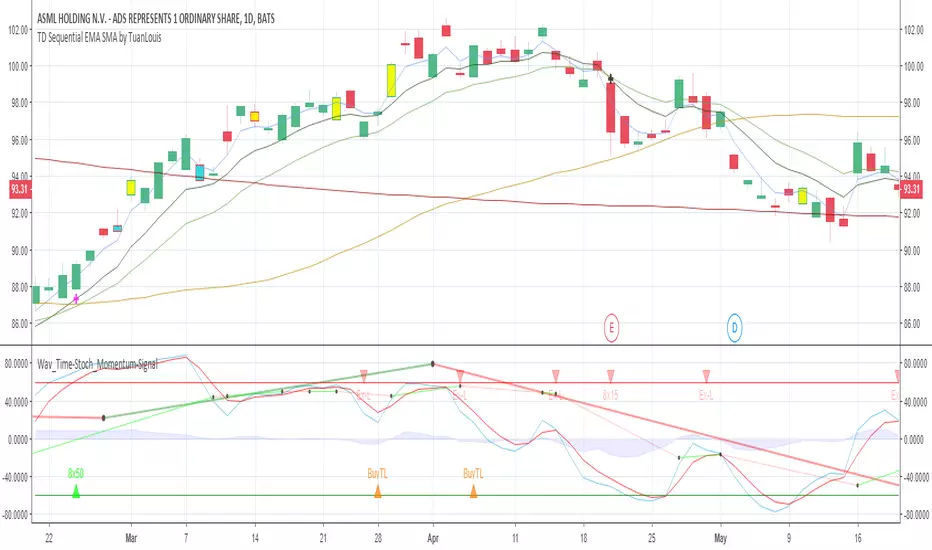
Momentum MultiTimeFrame + EMA SMA SignalsThis combines multiple ideas and indicators into one script.
This can be used for all time frames minutely, daily, weekly etc.
Relies heavily on EMA(8) and EMA(15) and looks at SMA(50) and SMA(200) levels at times.
It also gives an indication of next higher level momentum (Custom Time Frame - Ideally should be next level than selected time fractal.) momentum with thick Lines and Daily (21) trend with thin lines.
There's an option to Hide/Display Exit Short labels (hidden by default). Also, an option to display/Hide Weaker Buy Signal (Enabled by default).
Exit Long (Ex-L) can't be configured to hide as each Ex-L indicator is important and will help in exiting the trade.
Roadmap:
Include Ex-L signal below EMA(3) when gap is more between EMA(8) and EMA(3)
Include Candle stick lower wicks to indicate strong Buy Signals.
Inverse Fisher Transform on STOCHASTIC (modified graphics)Modified the graphic representation of the script from John Ehlers - From California, USA, he is a veteran trader. With 35 years trading experience he has seen it all. John has an engineering background that led to his technical approach to trading ignoring fundamental analysis (with one important exception). John strongly believes in cycles. He’d rather exit a trade when the cycle ends or a new one starts. He uses the MESA principle to make predictions about cycles in the market and trades one hundred percent automatically.
In the show John reveals:
• What is more appropriate than trading individual stocks
• The one thing he relies upon in his approach to the market
• The detail surrounding his unique trading style
• What important thing underpins the market and gives every trader an edge
About INVERSE FISHER TRANSFORM:
The purpose of technical indicators is to help with your timing decisions to buy or sell. Hopefully, the signals are clear and unequivocal. However, more often than not your decision to pull the trigger is accompanied by crossing your fingers. Even if you have placed only a few trades you know the drill. In this article I will show you a way to make your oscillator-type indicators make clear black-or-white indication of the time to buy or sell. I will do this by using the Inverse Fisher Transform to alter the Probability Distribution Function (PDF) of your indicators. In the past12 I have noted that the PDF of price and indicators do not have a Gaussian, or Normal, probability distribution. A Gaussian PDF is the familiar bell-shaped curve where the long “tails” mean that wide deviations from the mean occur with relatively low probability. The Fisher Transform can be applied to almost any normalized data set to make the resulting PDF nearly Gaussian, with the result that the turning points are sharply peaked and easy to identify. The Fisher Transform is defined by the equation
1)
Whereas the Fisher Transform is expansive, the Inverse Fisher Transform is compressive. The Inverse Fisher Transform is found by solving equation 1 for x in terms of y. The Inverse Fisher Transform is:
2)
The transfer response of the Inverse Fisher Transform is shown in Figure 1. If the input falls between –0.5 and +0.5, the output is nearly the same as the input. For larger absolute values (say, larger than 2), the output is compressed to be no larger than unity. The result of using the Inverse Fisher Transform is that the output has a very high probability of being either +1 or –1. This bipolar probability distribution makes the Inverse Fisher Transform ideal for generating an indicator that provides clear buy and sell signals.

ShortSqueeze StochasticOscillatorHey!
I made a StochasticOscillator with BITFINEX:BTCUSDLONG & BITFINEX:BTCUSDSHOTS
Hope you enjoy it, and remember it's not about the asset's price, but about the asset's interest with these finantial tools.

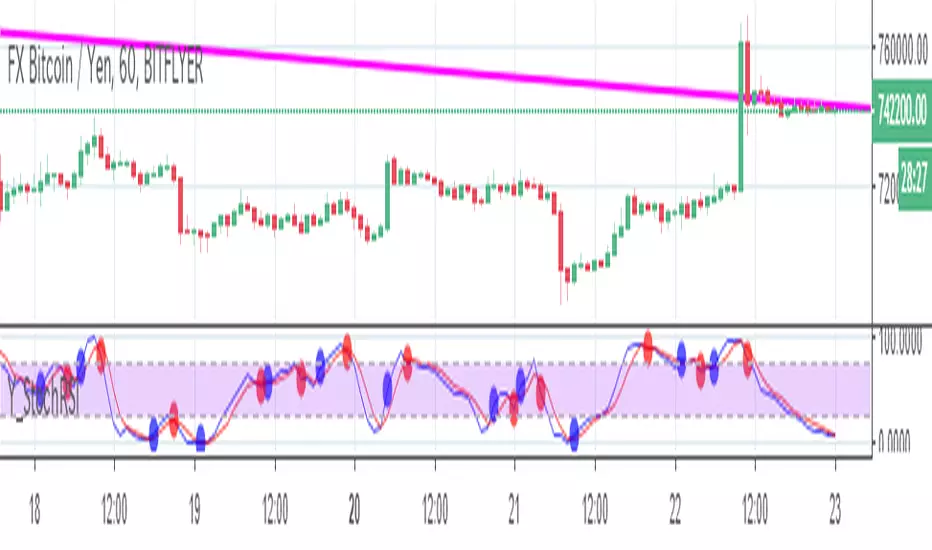
yutas_StochRSIver.1.0
With StochRSI time axis change and cross sign display function.
StochRSIの時間軸変更やクロスサイン表示機能付き。
08-2018 Stochastic 5m [ALERT SETUP] [INDICATOR]This is an accumulation of small buy orders and a complete sell order strategy, that can be used for manual trading or for a trading bot. The strategy is based on stockastic divergences ( an indicator that I made myself and is published on my profile earlier ), and I added my personnal touch of course. Note that the bullish and bearish stochastic divergences are calculated separately and can be configured in the inputs.
To be used with a 5m timeframe, and on a flat or bullish pair.
Everyone can favorite the script, apply it to the chart, but only I can see or modify the code. If you need anything, leave a comment, thanks :D
More info about the script, such as inputs description, how to configure the script, strategy explanation, alert configuration can be found here : blockchainfiesta.com
--------------------------------------------------------------------------------------------------------------
I do commission work: TradingView Pine Script development & Reverse Engineering.
contact@blockchainfiesta.com.
You can also send me a message in TradingView or Discord (discord.gg)
Bitcoin address: 19sVQvCDmVfEACq7BiMnWSMqFPZ8qfSQ2K
ETH address: 0xc8a5d3a63a05db0c2363ea1c08b37a01cce9ebfb

EMA analysis with Stoch OverSold/Bought indicator + IchimokuThe script will analyze trend around EMAs (configurable periods) and let you know when to short or long the market.
It will also tell you when there is a Overbought / Oversold Cross over Stochastic indicator
The script also includes a Ichimoku cloud so you can add this to your analysis for a trading action.
There will be more indicators coming into this script since im constantly working on Trading view scripts and analysing new strategys.
If you want access to it, contact me. (Its not free but also not expensive)
Best Regards.

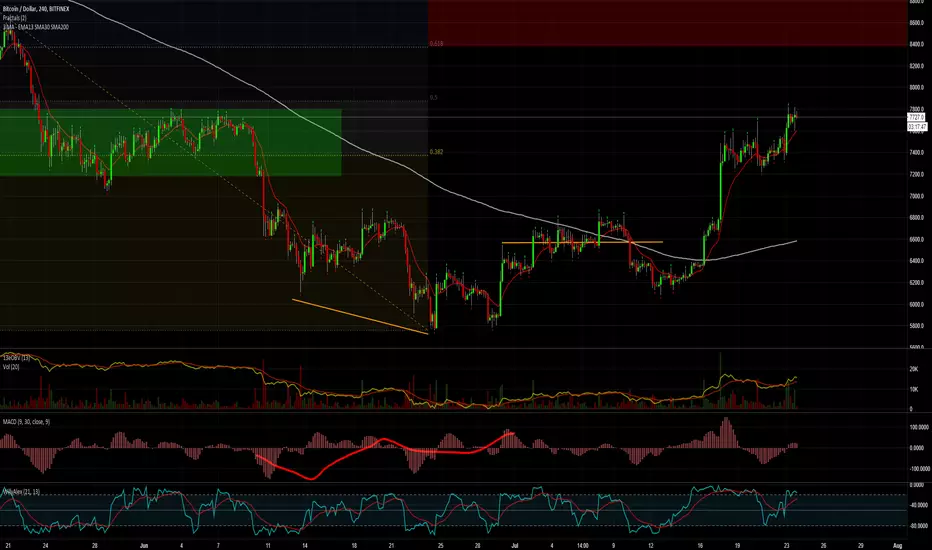
3-forcesThis strategy has three components.
Philakones EMAs are a sequence of five fibonacci EMAs. They range from 55 candles (green) to 8 candles (red) in length. A strong trend or breakout is marked by the emas appearing in sequence of their length from 8 to 55 or vice versa.
These EMAs are also used to signal an exit. Only two EMAs are used for exit signals - when the 13 EMA crosses over/under the 55 EMA .
RSI gives a bullish signal when 40 > rsi > 70. Exit signals are oversold (30) or overbought (70)
Stochastics give a bullish signal when stoch < 80 and an exit signal when > 95.
Results include 3 ticks of slippage and taker fees of .002. Provides a pretty smooth equity curve with a 73% win rate and beats buy and hold by than 10x (returns about 60x overall) since start of 2017.

RSI vs Stochastic vs Stochastic RSITo compare each indicator's performance toggle between the various buy and sell methods while watching results in the Strategy Tester pane.
OSC = Oscillates between crossing the chosen Lo or Hi levels for either RSI or Stochastic/Stochastic RSI.
CROSS = When the Stochastic or Stochastic RSI k crosses d.
Outer gray band equals Stochastic/StochasticRSI range.
Inner gray band equals RSI range.
NOTICE: This script does not require access from me, simply open Indicators on chart and search for "RSI vs Stochastic vs Stochastic RSI". By accessing this script you acknowledge that you have read and understood that this is for research purposes only and I am not responsible for any financial losses you may incur by using this script!


Stochastic (Double-Smoothed Bressert)Bressert's Double-Smoothed Stochastic formula, with some extra features. Visual highlighting of overbought/oversold values with dots. On intraday charts you can optionally show the Daily Stochastic instead of using the minutes/hours data.

Stoch_Williams_RSI[wozdux]2Strategy. The indicator gives buy and sell signals based on two or three indicators.
Alert 2 is the signal from the two indicators is the Stochastic + Williams. Alert 3 signal from three Stochastic + Williams+ RSI indicators is simple. The Alert4 signal from the three Stochastic + Williams+MTF indicators is simple. Alert5 signal from three Stochastic + Williams+ RSI-2 indicators smoothed.
Settings.
""alert 2 show" - show signal button
""alert 3 show" - show signal button
""alert 4 show" - show signal button
""alert 5 show" - show signal button
To use, you need to connect the "alert" by one of the "alert-2-3-4-5".
Стратегия. Индикатор дает сигналы на покупку и продажу на основе двух или трех индикаторов.
Alert2 это сигнал от двух индикаторов Stochastic + Williams. Alert3 сигнал от трех индикаторов Stochastic + Williams+ RSI простой. Alert4 сигнал от трех индикаторов Stochastic + Williams+MTF простой. Alert5 сигнал от трех индикаторов Stochastic + Williams+ RSI-2 сглаженный.
Настройки.
"alert2 show"- кнопка показать сигнал
"alert3 show"- кнопка показать сигнал
"alert4 show"- кнопка показать сигнал
"alert5 show"- кнопка показать сигнал
Чтобы воспользоваться, нужно подключить "оповещение" по одному из «alert-2-3-4-5».

3 in 1 (BB, Stoch ,rsi) with alert On the chart there are the BB with purple and green circles to give the entry signal once the price has come back in the bands.The background alert appair when BOTH RSI and STOCH are in overbuy or oversell. the defalt is 20/80 but can set it by yourself.

5 in 1 (rsi,aroon,stoch,macd,adx di)5 indicators in 1.
You can choose wich one you want to see (rsi ,aroon,macd,stoch or adx di)
Usefull to save space for other indicators

Stoch RSI K/D DifferenceGet the difference between Stochastic RSI k and d. When k > d, the value is positive, and vice versa.
Sudden change/reversal of the difference can indicate price reversal.

Willams %R with 13 EMA and middle pointWillams %R with 13 EMA and middle point. It also uses the textbook formula instead of the Tradingview one.
Miscbot 5m 2.2aAn automated strategy utilizing Autoview and Bitmex on the 5m.
Use at your own risk. I take no responsibility lost currency using this.
Link to strategy:

RSI AND SMOOTHED STOCH RSI TOGETHERi dont know pine script but here i used some free ones and merged them and modified some
especially smoothed stoch rsi is Good to decide when buy coz i modified it and when fast K value is over D value it changes color
visually better this way
also rsi is shown as area o histogram but if u dont like u can change to line
for stoch rsi i unclick xtrigger (d value) for better appearance

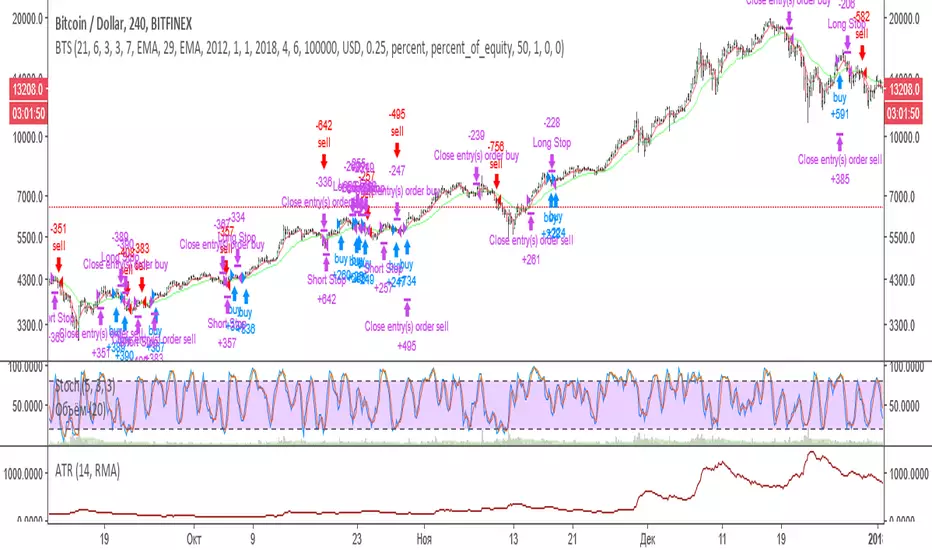
Base Trading StrategyEnglish description:
Following script is the realisation of strategy that discribed in one of educational video on YouTube .
First of all strategy choose trend direction using moving averages and then searching for entry using stochastic and waiting for a price rollback.
Conditions for long entry:
1. Fast MA is under slow MA.
2. Stochastic is increasing.
3. Price fluctuation touch fast MA or is lower then fast MA.
For short entry it uses conditions in reversive way.
Exit conditions:
1.Stop is equal 1 ATR.
2. Fast and slow MAs crossed in the opposite direction.
We set comission in script equal to 0.25% and amount of bet is equal to 50% of deposit by default.
Authors of video recomends to use next settings: 12 EMA, 34 EMA and Stochastic 5,3,3. But judging by backtesting for different pairs absolutely different parameters can match better then this. It's possible to find profitable parameters for stock, forex and crypto markets as well. Anyway this strategy is weak on flat movement and quite well on trend movement.
Описание на русском:
Данный скрипт является реализацией стратегии описанной в этом видео .
Стратегия исопльзует определения тренда по скользящим средним, а затем определяет точки входа, используя стохастик и откат цены.
Условия входа в лонг:
1.Быстра МА должна быть выше медленной МА.
2. Стохастик должен возрастать.
3. Цена должна коснуться или уйти ниже быстрой МА.
Для входа в шорт условия должны быть выполняться в обратную сторону.
Условия выхода:
1. Стоп составляет 1 ATR.
2. Быстрая и медленная скользящие должны персечся в обратном направлении.
Отличие от стратегии видео только в том, что отсутствует тейк-профит. Выход из сделки происходит только по стопу, либо по обратному пересечению скользящих средних. В скрипт по умолчанию вставлена комиссия 0.25% и по умолчанию торг идёт на 50% капитала.
Авторы видео предлагают использовать: 12 EMA , 34 EMA и Stochastic 5,3,3. Но судя по бэктесту по очевидным причинам для разных инструментов подходят абсолютно различные параметры.
Возможно подобрать профитные варианты как для фондового рынка, валютного рынка, так и рынка криптовалют. В любом случае стратегия очень слабо себя ведёт на флете и достаточно не плохо на движении.
В своём канале на YouTube мы выложили разбор данной стратегии на бэктестинге.