Cryptopeep RSI, Stochastic RSI, Stochastic and Williams %R, 4in14 Charts all in one chart, RSI, Stochastic RSI, Stochastic and Williams %R
Hope you like, please let me know your thoughts.
If you would like to be kept up to date please FOLLOW us and try our indicators and strategies here: uk.tradingview.com
If you like it please click the LIKE button.
스토캐스틱 오실레이터

Stochastiques Divergences [BACKTEST]Hi.
I'm really angry at TradingView for giving fake results when backtesting with H.A. candles. I had to rethink my strategies and find a workaround.
I'm also relieved I figured it out before losing money.
Anyway. Here is a strategy based on stochastic , and a little of my own feelings.
The access if for sale, a small donation will do, but the source code is more valuable.
Backtesting is done on the maximum time range, with commission included. Only long entries and exits.

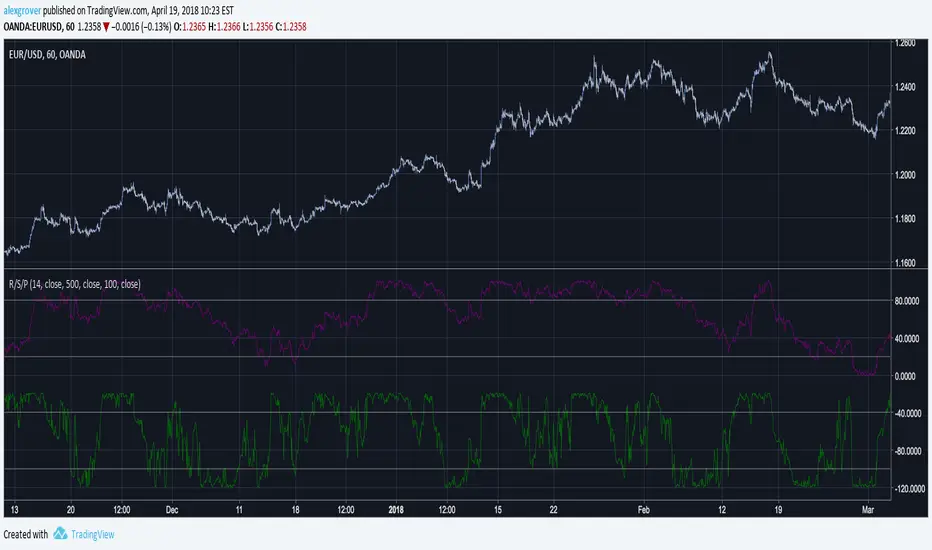
RSI/Stochastic/Percentrank all on chart and all in oneThe limitation of max 3 indicators on tradingview is pretty bad for indicators lovers (like me) so i made this script able to contain a rsi, a stochastic and a percent rank and that in only one indicator !! Pretty cool isn't it ? ;)
Every parameter is linked to one indicator, you can have all of them with differents period lengths
You have the possibility to disable each indicators and add clarity to the chart.
Do you want me to add more indicators ? If yes witch ? Comment bellow :D
Hope this help
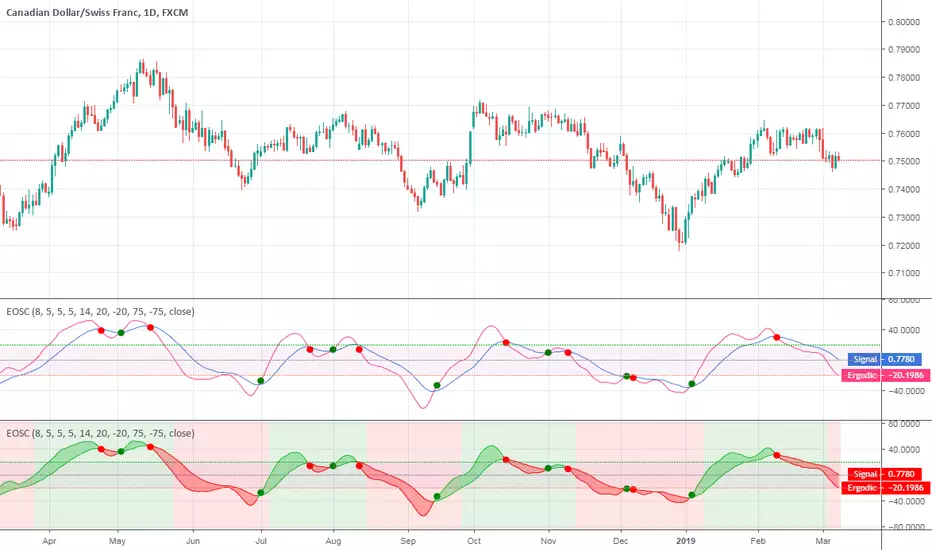
Ergodic OscillatorErgodic Oscillator indicator script.
Ergodic Oscillator is based on True Strength Index (TSI) by William Blau.
EAG MULTI TIME FRAME STOCH RSINeeded an indicator for displaying Stoch RSI's across multiple timeframes. Teal is standard RSI and main graph is Stoch RSI for current timeframe. Cells from top to bottom represent 1D, 2H, 1H, 30min Stoch RSI values, with color code of green for low and black being high.
Currently experimenting with different configurations for the arrow indicators at top. The hope is for these to make identifying trends across the multiple timeframes faster/easier.
Still a work in progress.


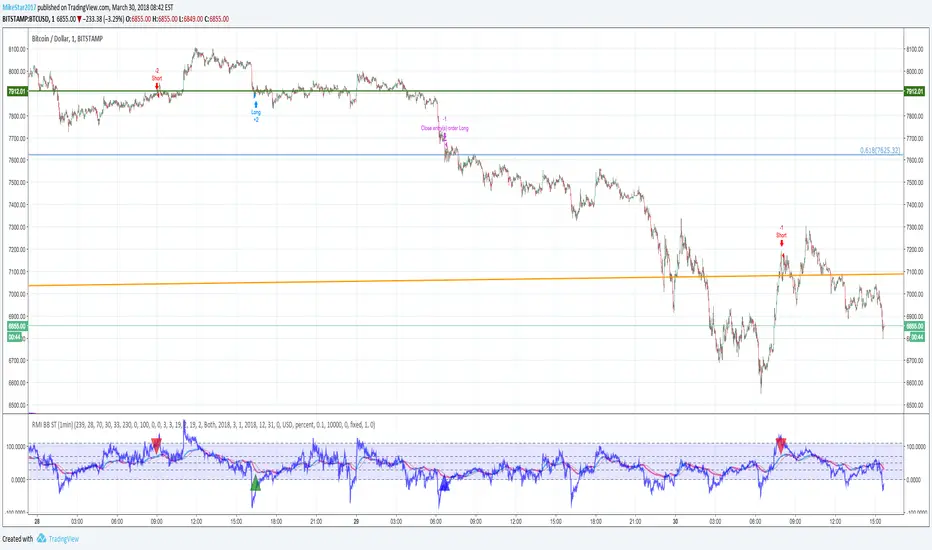
SW SVE - Stochastic+Vol+EMAs [Sergio Waldoke]Script created by Sergio Waldoke (BETA VERSION v0.5, fine tuning PENDING)
Stochastic process is the main source of signals, reinforced on buying by Volume. Also by Golden Cross.
Selling is determined by K and D entering overselling zone or EMA's Death Cross signal, the first occurring,
and some other signals combined.
Buy Long when you see a long buy arrow.
Sell when you see a close arrow.
This is a version to be tuned and improved, but already showing excelent results after tune some parameters
according to the kind of market.
Strategy ready for doing backtests.

Stochastic MFIJust like the standard Stochastic RSI, this is a MFI(Money Flow) version.
The MFI is a Volume Weighted RSI and so this indicator will give that dimension to your technical analysis.
It also includes a "midway" line that can be altered if need be.
// Created 2018 - by @Squiggles#8806
// LTC Tip Jar: LX4bUBdjiRPsagUbZoAczSGgDC4YqTJL7w

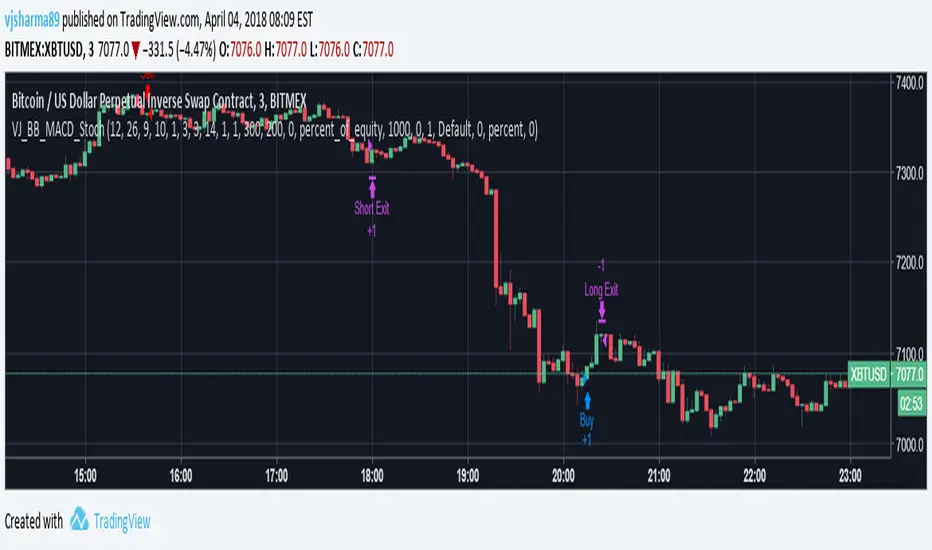
VJSHARMA_BB_MACD_Stoch_Short_Trade_StrategyThis strategy was developed keeping in mind the accuracy of signals. Due to which the time-frame had to be small as in longer timeframe, the probability of a particular movement decreases. The best application of this strategy is with Margin Trading as the signals achieved have really high accuracy.
To get the best out of this strategy, keep in mind the following
1. Choose 3 min time frame
2. Changing the stoploss and trailing stop settings could/would interfere with the accuracy of the trades.
3. Pyramiding affects the profitability of trades.
DMI StochasticModification of DMI Stochastic indicator created by USGEARS, as requested by another user. This version just colors columns along with the indicator arrow.

RSI + StochasticRSI overbought and oversold histogram
Just indicator combo of oldschool slow stochastic and rsi, just looking a little bit better for someone.
Strategy is simple:
1) RSI is overbought or oversold (above 70, below 30)?
2) Stochastic line crosses its ema?
3) Stochastic and stochastic ema are in overbought = sell, oversold = buy.
Works good in volitile stocks/pairs and suits for fast scalping timeframes 1m 5m 15m
Strategy is old as the books, this is just a better visual for it.

Buy and Sell signals using StochasticSimple Buy and Sell signals using Stochastic with the ability to further change backtest's start and end date.

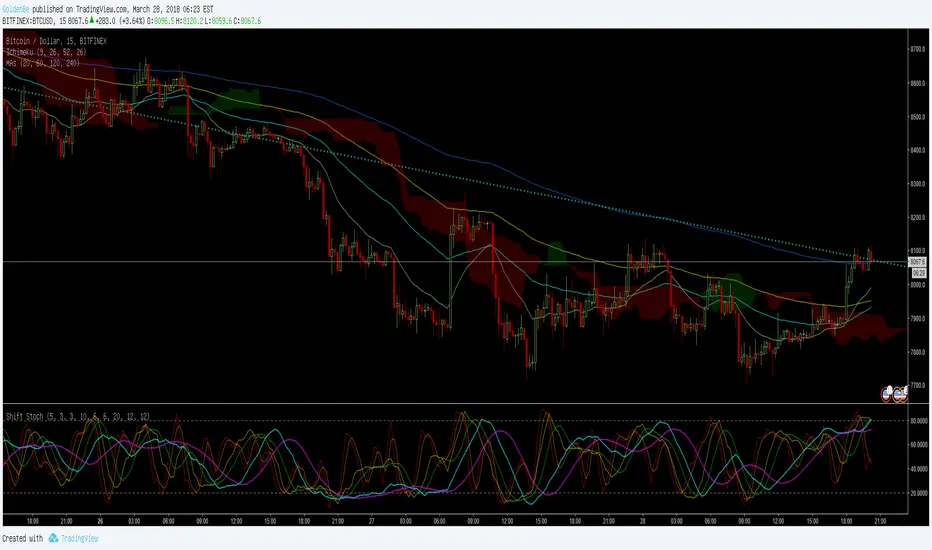
ShiftPower StochasticThis indicator is a combination of the following three slow stochastics commonly used.
ⓐ 5 - 3 - 3
ⓑ 10 - 6 - 6
ⓒ 20 - 12 - 12
( n - %k - %d )
I hope it helps. Thanks.
<한국어>
일반적으로 많이 사용하는 다음 3개의 슬로우 스토케스틱을 하나로 합친 지표입니다.
ⓐ 5 - 3 - 3
ⓑ 10 - 6 - 6
ⓒ 20 - 12 - 12
( n - %k - %d )
도움이 됐으면 좋겠습니다. 감사합니다.
Stochastic Momentum IndexStochastic Momentum Index indicator script. This indicator was originally developed by William Blau (Stocks & Commodities V. 11:1 (11-18)).

Stochastic Volume OscillatorThis is a hybrid indicator combining the classic Stochastic Oscillator with the Volume Oscillator.

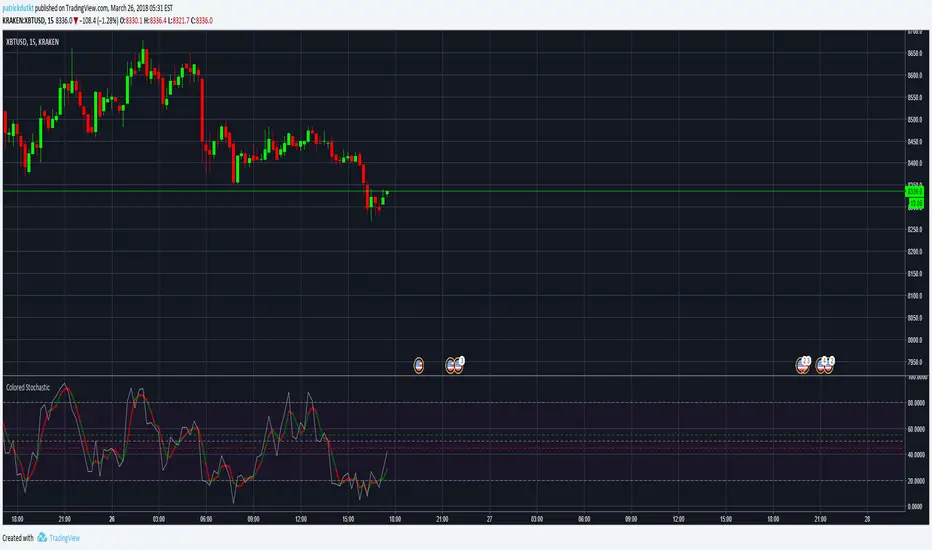
Wave Cycle StochasticThis is based of a modified stochastic numbers. The settings come from Barry Burn's foundation and advanced courses.
There are two stochastic indicators one on top of another. at the same time, you can turn off the lines and show the moving averages of percent D and percent K, this is something I added personally to farther investigate if they can be helpful or not.
Those who went through Barry's courses know that is oscillator is being used to find cycle high and cycle low in waves. Also Barry teaches what he calls mini-divergence and for that he uses this same oscillator. If you switch to weekly chart, the settings will automatically switch to those Barry teach for non 1 to 3 ratio situations so you don't need to worry about that. If seeing the higher time frame cycle indicator on the same oscillator is bothering you, you can again add another copy and only keep that one and turn off the rest.

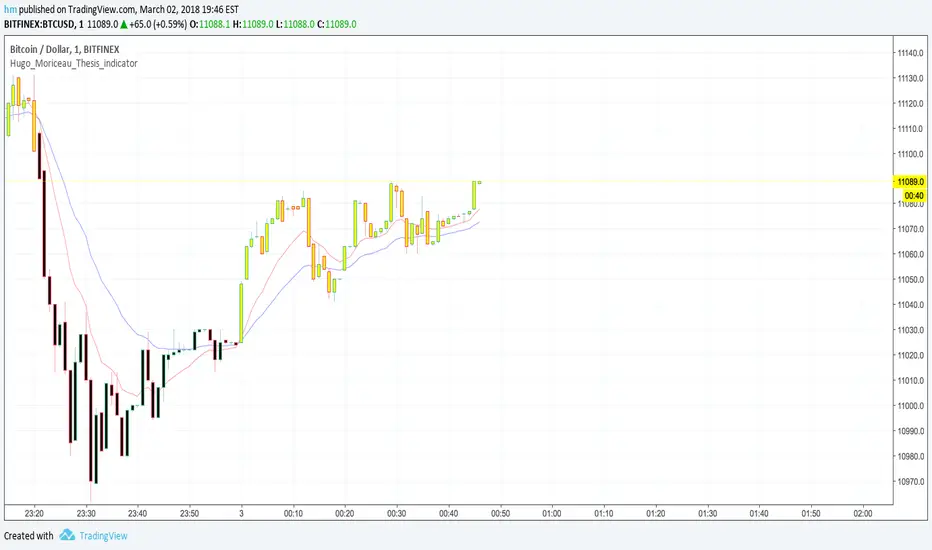
Macd_Reader_Signal_Moriceau_Thesis_indicatorThe idea is to create a MACD "Reader" that can tell you when you should buy (yellow candle sticks) and when to Sell (black one) you have also strong signal of with B and S write on graphic automatically. This indicator is set and back tested with BTCUSD and Gold. I used also for french equities and it works really good.
Let me know if you want any change or have comments.
Hugo Moriceau
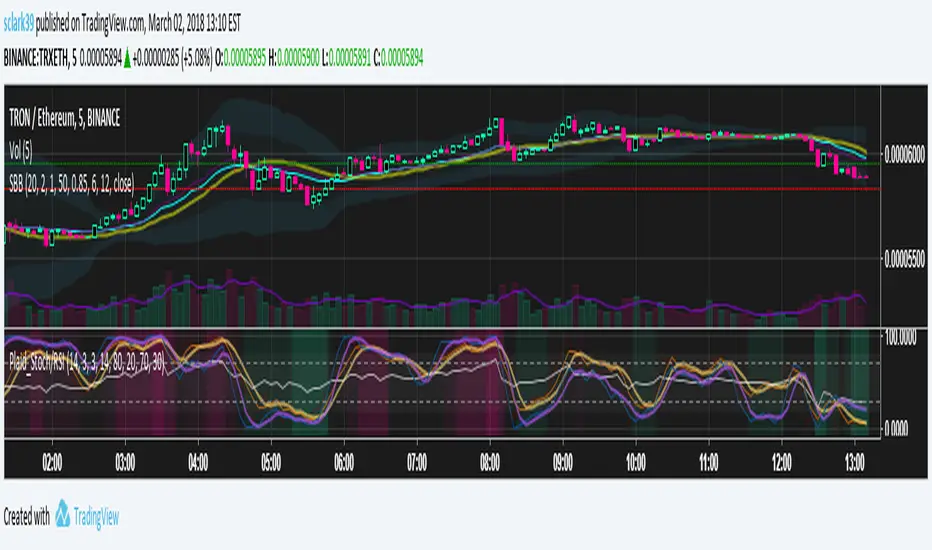
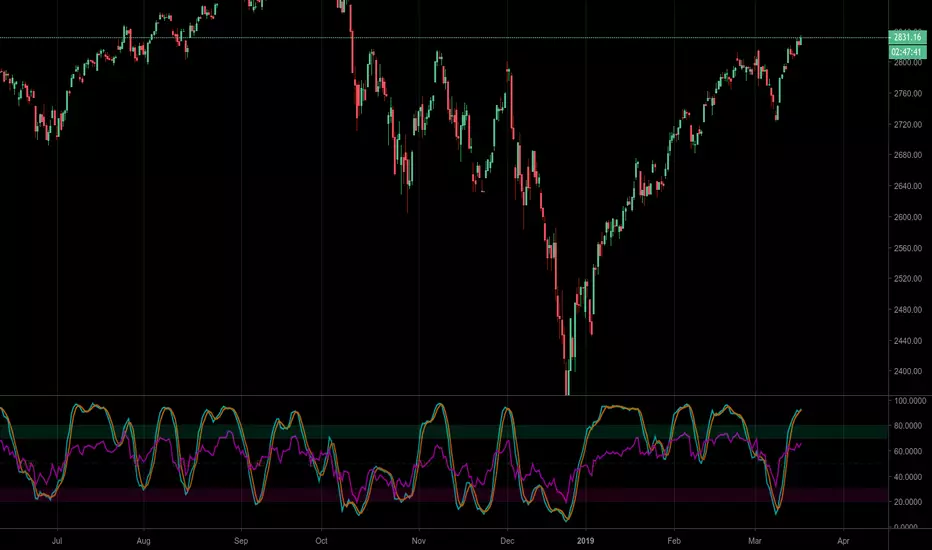
Plaid Stochastic / RSI Triple Combo Indicator [sclark39]Welcome to my "Plaid" Stochastic / RSI / StochRSI Combo indicator.
This shows the Fast and Slow Stochastic (orange and yellow), Relative Strength Index (white), and the Stochastic RSI (purple). As the lines cross the 80/20 and 70/30 lines, the background color changes to make it easy to see at a glance how many of the indicators have crossed their threshold. In the options you can change the period lengths and hide/show each of type of indicator to best fit your trading style.
Use this indicator for trades at your own risk, I made this for fun and it is not a trade recommendation.
That being said, if you like my work please tip me!
ETH: 0xf8E0Ea503B5c833fD4546E7fa2c70EcE42A27C8A
Please comment with feedback and requests!