Stochastic RSI (with alerts)This is a modification of original Stochastic RSI oscillator, but with addition of highlighted death and golden crosses. It also allows you to receive alerts: "Stochastic RSI: Death cross on 4hours"
스토캐스틱 오실레이터
Hashem Extended Stochastic (V2)Extended Stochastic with All Zones. From Neutral to Danger Zones.
The Most Complete and Extended Stochastic Indicator.

Market Cycle & Scalping entry / exitCycle indicator is an oscillator commonly used to identify market trends and provide buy and sell signals to traders. The Cyle indicator is based on the assumption that currency trends accelerate and decelerate in cyclical patterns that may reflect the dominant price cycle of any stock, during any time frame. It works best on a 1 min chart for quick scalp plays.

Options - StochasticThis is a simple stochastic oscillator with predefined settings for short, mid, and long time. These settings are specially fabricated for options trading.

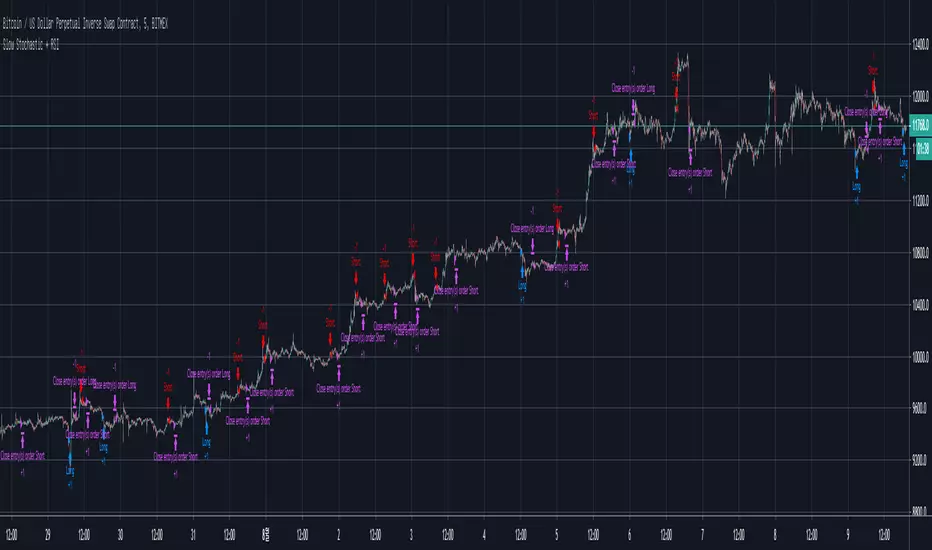
[XBTUSD 5M] Slow Stochastic + RSI Strategyhis Strategy is Low lisk, middle Return
But, The signal does not occur often.
I think a good strategy is to buy (or sell) as a split
In this way, most transactions will be profitable.
Caution! It seems good to end the deal at once.
Even if you are losing money
Do not be greedy
If it helped, please leave a comment and Like
Good Luck :)
안녕하세요.
처음으로 전략 스크립트 글을 남깁니다.
이 전략은 비트맥스 스캘핑용 전략이며,
낮은 위험성으로 중간의 수익률을 기대할 수 있습니다.
하지만 시그널이 자주 발생하지는 않습니다.
전략의 핵심은 시그널이 발생했을 때, 분할로 매수하거나 매도하며
클로즈 시그널이 나왔을 때, 한 번에 파는 것이 중요합니다.
전략은 한번에 끝내는 것이 좋습니다.
손실을 보고 있거나, 더 큰 수익률을 위해 욕심을 부리지 마세요.
만약 도움이 되었다면 좋아요와 댓글을 남겨주세요.
감사합니다.
Hashem Extended StochasticExtended Stochastic with All Zones.
From Neutral to Danger Zones.
The Most Complete and Extended Stochastic Indicator.
Scott's MTF: RSI with ema and stochasticI made this for backtesting the 1 hour TF where I am more interested in 4 hour stochastic and RSI than the default 1 hour stoch and RSI.


Profit Runner Strategy v2.0This is the strategy version of the recently posted Profit Runner v2.0 study. We include both together so that users can use the strategy for backtesting and figuring out the optimal settings for their specific usage and then implement those settings in the study version(which includes alerts for automated trading).
Green background highlights are buy signals and red background highlights are sell signals. Red and green filled area show the user's stop loss .

Profit Runner Study v2.0Updated version of our Profit Runner indicator. All of our invite-only scripts are available through our website profitprogrammers.com. All studies come together with their strategy equivalent!

Scott's RSI with ema and stochsRSI with ema of RSI with regular stochastic overlaid into the same panel with control zones.

TA-Money Flow-Version3This is the MACD of a stochastic OBV movement indicator. It is good (right) to work with both price and volume. I've included highlighting based on price divergence. It works great on any time frame, but you need to have volume data. Not sure where I originally got this (stoch-OBV, somewhere off Tradingview several years ago, thanks to the person who shared), just publishing because of a request.
Enjoy.
Version 2 - TA-Money-Flow-v2-Stochastic-OBV

Stochastic ConfluenceShows 5 stochastic plots with moving average cross marks for different time-frames. Each plot is based on the current interval times the configurable multiplier.
E.g.: If you are viewing 1h chart, the settings 1, 2, 3, 4, 6 will get you stochs for the 1h, 2h, 3h, 4h and 6h.

Hedging CryptocurrencyПри написании скрипта автор мотивировался статьей о хэджировании криптовалют . Для работы с данным скрипом необходима установить дневной таймфрейм.
Скрипт " Hedging Cryptocurrency ", по своей сути, является стохастическим осциллятором данных спрэда между ценой (годичной давности) на BTC и равноценным количестве выбранного альткоина. Стоит сразу заметить, что для корректного использования данного скрипта необходима выбирать инструмент вида XXX/USD (где XXX - выбранный альткоин, а USD - стабильный альткоин, привязанный к доллару). В настройках можно включать/выключать сигналы на покупку (зеленые точки) и продажу (красные точки) альткоина. Закрывать сделку можно, когда осциллятор перешагнет нулевую отметку. ВАЖНО, что для хэджирования криптовалют, при открытии сделки на альткоин, необходимо также открыть сделку и на BTC, но уже в обратном направлении. Кроме всего перечисленного сам осциллятор имеет градацию зеленых и красных оттенков, которые говорят об условной перекупленности и перепроданности соответственно. Добавлю, что индикатор чаще ошибается при низкой корреляции между инструментами, поэтому в такие моменты он начинает сигнализировать черными крестиками. В этих ситуациях скрипт не гарантирует ту точность, которую может предложить :-)
Само собой данный индикатор только инструмент, а его сигналы не являются абсолютно верными, поэтому с большим удовольствием почитаю в комментариях ваши предложения по его усовершенствованию.

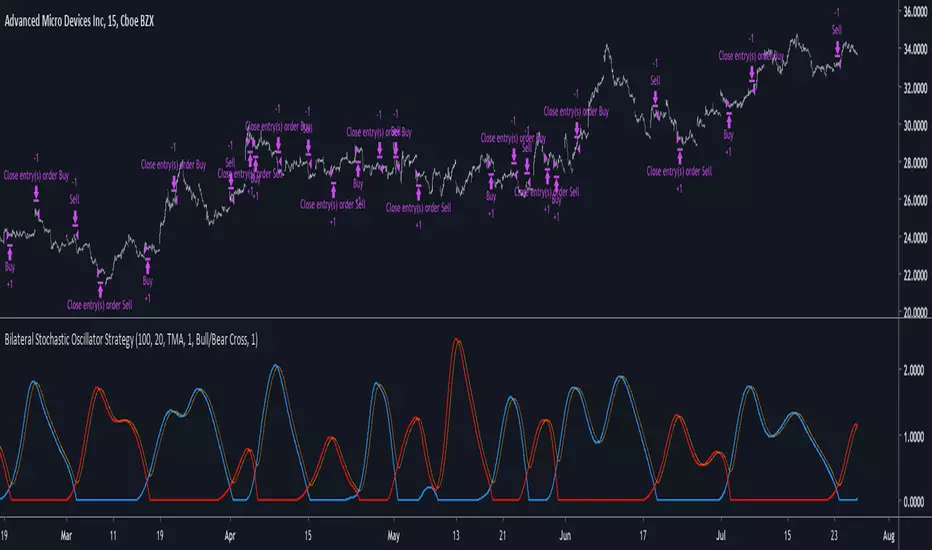
Bilateral Stochastic Oscillator StrategyIntroduction
Strategy based on the bilateral stochastic oscillator, this oscillator aim to detect trends and possible reversal points of the current trend. The oscillator is composed of 1 bull line in blue and 1 bear line in red as well as a signal line in orange, the strategy have many options such as two different strategy framework and a martingale mode. If you require more information about the indicator go check it into my uploaded indicators.
Strategy Frameworks
There are two frameworks available that can be selected from the strategy settings window. Both have the same closing conditions, the "Bull/Bear Cross" entry conditions are :
Buy : when the bull line cross over the bear line
Sell : when the bear line cross over the bull line
The "Signal Cross" entry conditions are :
Buy : when the bull line cross over the signal line
Sell : when the bear line cross over the signal line
Both have the same close conditions that is : close when bull/bear cross under the signal line.
Introduction To Martingale
The martingale money management system consist to double the order size after a loosing trade and can be described as a 2^x where x is the current number of loosing trades since the last win trade, when we win a trade the order size return to the default order size. Therefore our order size function is based on exponential growth.
This system enable the trader to win back his previous losses plus a potential profit, martingales must always be used with stops and sometimes take profits in order to get control in a strategy.
It must always be taken into account that in a series of losses the balance can exponentially decay thus ending to 0 in a matter of trades, this is why it is not recommended to use such system. The strategy allow you to select a martingale multiplier that can be inferior to 2 thus limiting risks, a multiplied of 1 disable the martingale.
Results
Those are the some statistics of the strategy applied to some forex majors by using the default settings in a time frames of 15 minutes.
//-------------------------------------------------------
EURUSD - Order Size 1000 - Spread 0.0002
Profit : $ 21.08
Trades : 19
PP : 57.89 %
Profit Factor : 3.228
Max Drawdown : -$ 3.81
Average Trade : $ 1.11
//-------------------------------------------------------
GBPUSD - Order Size 1000 - Spread 0.0002
Profit : $ 2.31
Trades : 20
PP : 55 %
Profit Factor : 0.938
Max Drawdown : -$ 20.29
Average Trade : $ 0.12
//-------------------------------------------------------
EURAUD - Order Size 1000 - Spread 0.0002
Profit : -$ 9.22
Trades : 20
PP : 40 %
Profit Factor : 0.698
Max Drawdown : -$ 23.44
Average Trade : $ 0.46
//-------------------------------------------------------
EURCHF - Order Size 1000 - Spread 0.0002
Profit : $ 1.58
Trades : 24
PP : 54.17 %
Profit Factor : 1.103
Max Drawdown : -$ 7.23
Average Trade : $ 0.07
//-------------------------------------------------------
Conclusions
Based on the results the strategy does not posses the sufficient performance in order to apply a martingale or any other growth systems as order size. Parameters might be subject to drastic changes depending on the market/time-frame in order to return long-term positive results. I let you draw your conclusions.


StochRSI 𝝙Enhanced version of StochRSI inspired by my premium RSI Delta script.
Check my premium advanced indicators:

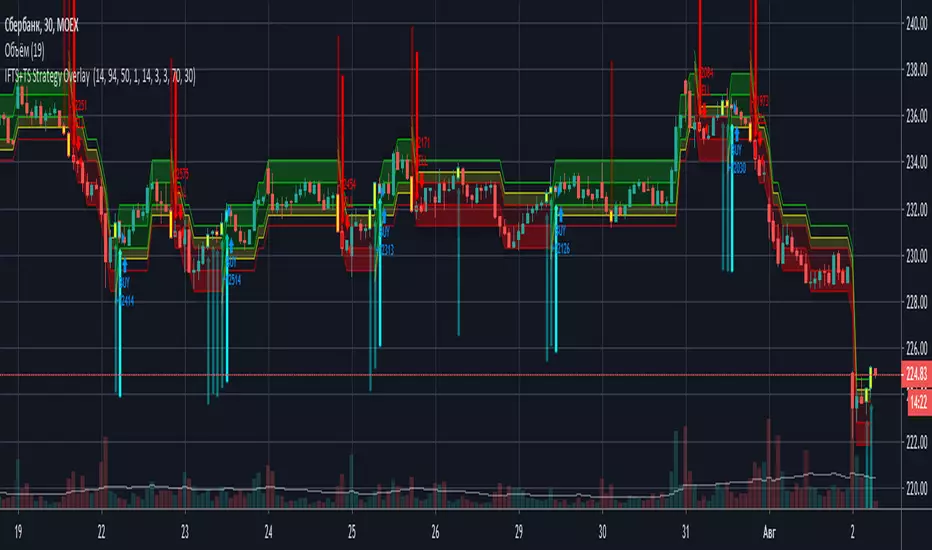
IFTS+TS Strategy OverlayInverse Fisher transform on stochastic with Hull MA and Donchian Channels with oversell/overbuy levels and dynamic trailing stop
Options:
Fixed trailing stop
Dynamic, based on ATR trailing stop
Re-enter after trailing stop
Includes Hull MA
Hull MA filtration for re-entering after trailing stop
Donchian channels, with overbuy/oversell levels
No repaints
Strategy JonathanThis script is a request from trader Jonathan.
We use Bolinger bands to scan for market extremes.

Stochastic Rsi based trading strategyThis strategy checks if the stochastic rsi is oversold, then checks if %K and %D are less than 10. If all these conditions happens, we have a buy signal.
After this, we will receive a sell signal when the stochastic rsi crosses under.

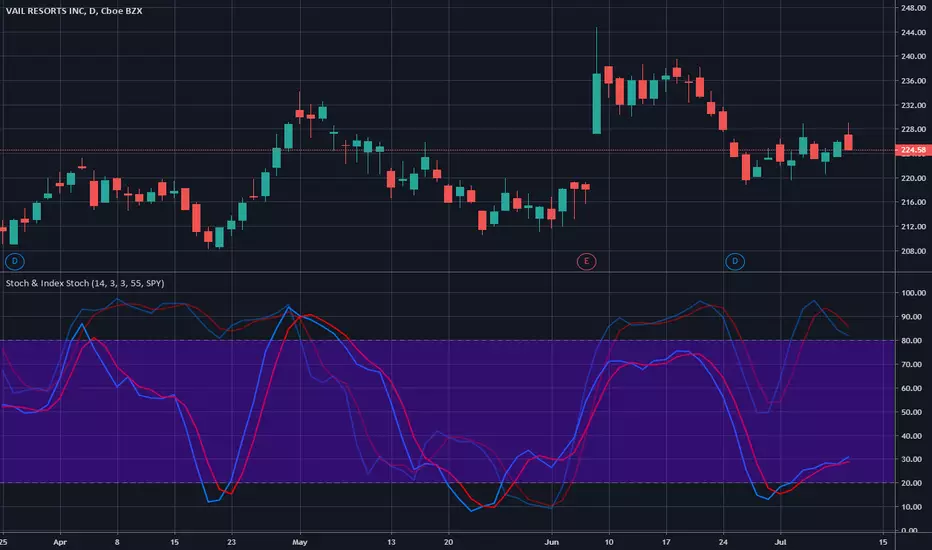
Stochastic & Index StochasticUsing this indicator you will be able to use the standard stochastic of a stock ticker as well as the stochastic of a stock market index simultaneously and without changing charts - both stochastics combined in only one indicator.
The stock market index stochastic can be changed in the indicator settings and is displayed with higher transparency. The degree of transparency and default color settings can also be adjusted.
For special analysis purposes, it is possible to display only the stochastic of the selected stock ticker or only the stochastic of the selected stock market index.
If you would like to test or use this indicator please drop me a line and send a request for it.