No-lose trading targets (based on RSI) By Mustafa ÖZVERThis code shows expected reaction target prices after sudden moving based on RSI. Red area means the price is on overbought area, green area means the price is on oversold area. If you see red area under price, you can make short option to next to the horizontal beginning price of red area. If you see green area over price, you can make long option to next to the horizontal beginning price of green area.
When this code works
- The green area starts where rsi value is on oversold
- The red area starts where rsi value is on overbought
Of course, this code may be failed, do not forget the target may never come. But hopefully price will cross over the target.
And you (as developers) can develop this code by using anything instead of rsi to get up-down target prices.
But only this values can not guarantee good results for trading. BE CAREFUL
Sellsignal

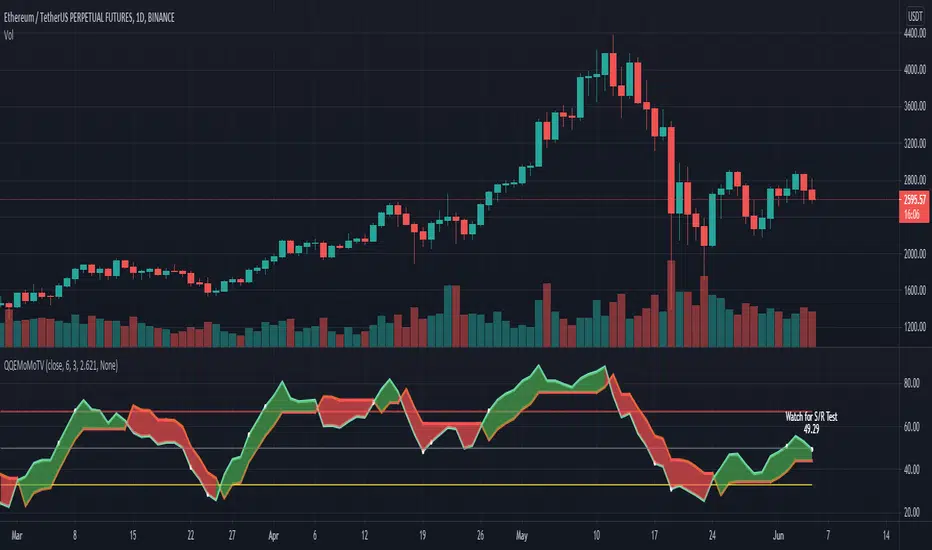
QQEMoMoTV█ OVERVIEW
This plots the QQE (Quantitive Qualitative Estimation)
with the addition of labels to show areas to watch out for and a colored cloud to show Green Upwards or Red Downwards Momentum
The QQE indicator is based on Wilder's RSI, which is based on a smoothed RSI comparing the change (delta Δ) between between bars
to compute the FastTL and SlowTL depending on the RSI Period, Slow Factor and QQE settings selected
As this works similarly to the RSI, it provides areas of overbought and oversold, and a cross at 50 for more bullish or more bearish
The FastTL and SlowTL crossovers works similarly to the crossover of a fast and slow moving average which can indicate bullish or bearish
When the SlowTL crosses above the FastTL a Green cloud indicating upwards momentum is drawn and vice versa when FastTL crosses above SlowTL
Bullish signals generated when Blue line crosses above Orange line, or Green MoMo cloud, Uptrend
Bearish signals generated when Orange line crosses above Blue line, or Red MoMo cloud, Downtrend
QQE Areas of interest:
Oversold: QQE < 33, Overbought: QQE > 67
Cross at 50: QQE crossing 50, this is an area that is between more bullish >50 and more bearish <50 zones
Note: as 50 is the switch between more bullish or more bearish zones , it is common to watch out for Support/Resistance Tests at this level
Tip: when QQE appears to be flat, this indicates a flat trend, this can commonly happen around the 50 zone when direction is relatively undecided, see the image below for an example
Very Overbought: QQE > 90, Careful! Watch out! QQE is showing very overbought and is generally a good area to take profit as others may sell soon too
QQE Fast settings: gives earlier signals, but also gives more shorter term signals
RSI_Period = 6, Slow_Factor = 3, QQE = 2.621
QQE Slow settings: gives more reliable signals, but sometimes a little late, best to use both fast and slow together for confirmation of the trend
RSI_Period = 20, Slow_Factor = 5, QQE = 4.236
You can add the QQEMoMoTV indicator to your chart twice and change one of them to the Fast settings and one of them to the Slow settings.
By comparing the QQEMoMoTV Fast and QQEMoMoTV Slow together you can get a better idea of the overall trend.
To best determine if this is a entry point or a trend reversal, it is recommended to use in conjunction with the MashumeHullTV indicator
█ FEATURES
Calculations
Calculates the change (delta Δ) between between bars based on Wilder's smoothed RSI to compute the FastTL (Orange) and SlowTL (Blue) lines
These are dependent on the QQE Fast settings or QQE Slow settings from the input RSI Period, Slow Factor and QQE selected
Labels are shown when QQE crosses areas of interest on the chart as Label text and shown with white dots on the QQEMoMoTV indicator
Inputs
You can use the script's inputs to configure:
• Calculation Source (default close)
• RSI Period (default 20)
• Slow Factor (default 5)
• QQE (default 4.236)
• Whether to show Green/Red MoMo Cloud
• Whether to show the QQE Label
• Style and Position of the QQELabel (default None)
None is selected as default to take up least space for optimal viewing when on Tradingview mobile, but you are free to change the style however you like
Alerts
Buy Signal alert based on rsi_ma crossing above FastAtrRsiTL, when Blue Line Cross above Orange Line, Green MoMo Cloud, Bullish
Sell Signal alert based on FastAtrRsiTL crossing above rsi_ma, when Orange Line Cross above Blue Line, Red MoMo Cloud, Bearish
█ CREDITS
Original Author: greyghost7
Feature upgrades and usage: Xiuying
Converted to Tradingview by: Machdragon
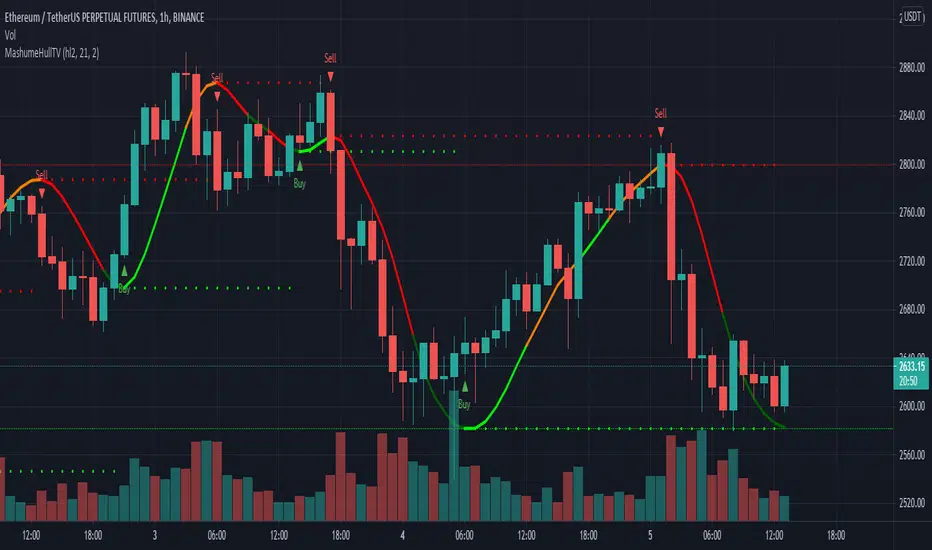
MashumeHullTV█ OVERVIEW
This plots the Hull Moving Average Turning Points and Concavity
with the addition of colored segments representing concavity and turning points: maxima, minima and inflection.
a fast way to determine the trend direction and possible reversals based on concavity of the trend
Dark Green: Concave Up but HMA decreasing. The 'mood' has changed and the declining trend of the HMA is slowing. Possible trend change to Uptrend soon
Light Green: Concave up and HMA increasing. Price is increasing, and since the curve is still concave up, it is accelerating upward. Uptrend
Orange: Concavity is now downward, and though price is still increasing, the rate has slowed, perhaps the mood has become less enthusiastic. Possible trend change to Downtrend soon
Red: Concave down and HMA decreasing. Downtrend
Buy signals generated when Hull turns from Dark Green -> Light Green
Sell signals generated when Hull turns from Orange -> Red
To best determine if this is a entry point or a trend reversal, it is recommended to use in conjunction with the QQEMoMoTV indicator
█ FEATURES
Calculations
Calculates the concavity of the Hull Moving Average comparing the Hull concavity of the current bar to the previous bar and displays the concavity in the form of 4 different colors.
Note: may cause repainting, so recommended to use with another indicator such as the QQEMoMoTV indicator to confirm signals.
Calculates divergence between the calculated HMA and the actual price and displays this in the Divergence Label.
Calculates the local minima, maxima and inflection points with the ability to display these as auto support/resistance lines.
Inputs
You can use the script's inputs to configure:
• Calculation Source (default HL2)
• HMA Length (default 21)
• Lookback (default 2)
• Whether to show Auto Support/Resist Lines
• Whether to show Buy/Sell Arrows
• Whether to show Divergence Label
• Whether to extend Local Auto Support/Resist Lines
Alerts
Buy Signal alert based on HMA crossing above MA_Min/Hull Support, when Hull turns from Dark Green -> Light Green, Bullish
Sell Signal alert based on HMA crossing below MA_Max/Hull Resistance, when Hull turns from Orange -> Red, Bearish
Experimental support for applying the indicator to higher time frames
eg. charting the hourly MashumeHull indicator on 15 min chart. See the commented code to access this feature
█ CREDITS
Original Author: Seth Urion (Mashume)
Feature upgrades and usage: Xiuying
Converted to Tradingview by: Machdragon
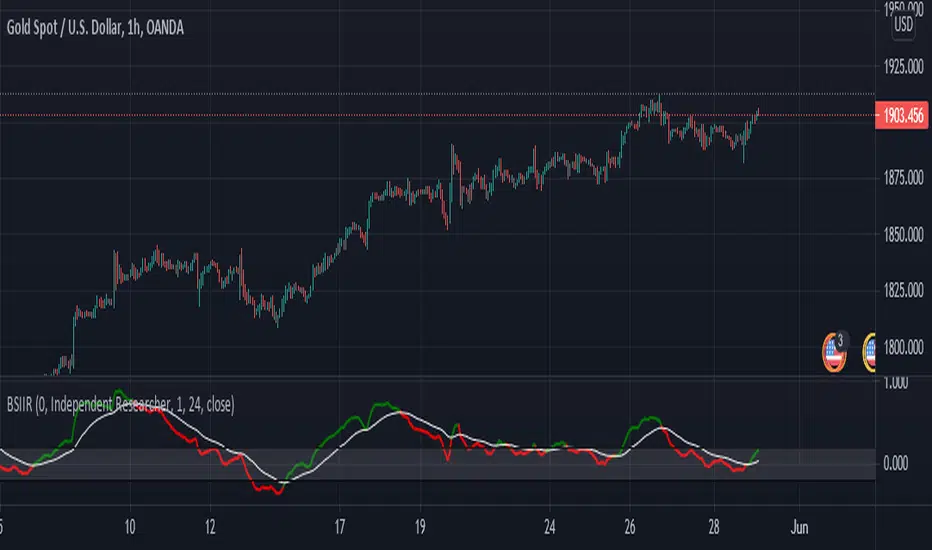
Buy Sell Indicator by Independent ResearcherThis is an Buy and Sell Oscillator. Its show the trend reversal or change in price action of the market. This indicator is a combination of various moving averages. This is like a MACD but a very powerful version.
How To Use It
If green line gives crossover white line towards down then price is expected to fall.
If red line gives crossover white line towards up then price is expected to rise.
For better results of indicator trade after closing of crossover candle.
There is a band +.20 to -.20 for better results trade on crossover happens between that band.
Below you will see an example:-
XAUUSD
EURUSD
[GJ]IFRSITHE INVERSE FISHER TRANSFORM STOCH RSI
HOW IT WORKS
This indicator uses the inverse fisher transform on the stoch RSI for clear buying and selling signals. The stoch rsi is used to limit it in the range of 0 and 100. We subtract 50 from this to get it into the range of -50 to +50 and multiply by .1 to get it in the range of -5 to +5. We then use the 9 period weighted MA to remove some "random" trade signals before we finally use the inverse fisher transform to get the output between -1 and +1
HOW TO USE
Buy when the indicator crosses over –0.5 or crosses over +0.5 if it has not previously crossed over –0.5.
Sell when the indicator crosses under +0.5 or crosses under –0.5 if it has not previously crossed under +0.5.
We can see multiple examples of good buy and sell signals from this indicator on the attached chart for QCOM. Let me know if you have any suggestions or thoughts!

MATR 4H Strategy - UpTradingEN // MATR 4H Strategy - UpTradin
Use 1:
This script is effective for all assets. Find out how to get the best performance. This indicator offers several possibilities:
- Only in TimeFrame 4H.
- The gray curve shows you the trend. You should not trade against it.
- Once the trend is established you can buy or sell according to the Buy and Sell sign.
- When the orange point (warning) appears you must remain attentive to a continuation of the movement or a reversal.
Use 2:
You can program limit orders using the green or red stripe. These are two bands that anticipate the high or low point of the price.
Legend:
- The gray line is an Ema 20 based on a Daily TimeFrame.
- The orange point means a continuation or a reversal.
- Buy means a buy zone.
- Sell means a sales area.
- The green curve allows you to program a limit order to buy.
- The red curve allows you to program a limited order to sell.
Operation:
This script works from an ATR programmable according to your needs and correlated according to an Ema. It also shows you the trend in a single one thanks to an Ema 20 based on Daily data.
FR // MATR 4H Strategy - UpTrading
Utilisation 1 :
Ce script est efficace pour la totalité des actifs. Découvrez comment obtenir le fonctionnement idéal. Cet indicateur offre plusieurs possibilités :
- Uniquement en TimeFrame 4H.
- La courbe grise vous indique la tendance. Il ne faut pas trader contre celle-ci.
- Une fois la tendance établie vous pouvez acheter ou vendre selon le signe Buy et Sell.
- Lorsque le point orange (warning) apparaît vous devez rester attentif à une continuation du mouvement ou d’un retournement.
Utilisation 2 :
Vous pouvez programmer des ordres limites grâce à la bande verte ou rouge. Il s’agit de deux bandes qui anticipent le point haut ou bas du prix.
Légende:
- La courbe grisée est une Ema 20 basée sur un TimeFrame Daily.
- Le point orange signifie une continuation ou un retournement.
- Buy signifie une zone d’achat.
- Sell signifie une zone de vente.
- La courbe verte vous permet de programmer un ordre limite à l’achat.
- La courbe rouge vous permet de programmer un ordre limité à la vente.
Fonctionnement:
Ce script fonctionne à partir d’un ATR programmable suivant vos besoins et corrélé suivant une Ema. Il vous indique également en une seule la tendance grâce à une Ema 20 basée sur des données en Daily.

Simple way to BEAT the market [STRATEGY]This script has been created to demonstrate the effectiveness of using market regime filters in your trading strategy, and how they can improve your returns and lower your drawdowns
This strategy adds a simple filter (A historical volatility percentile filter, an implementation of which can be found on my trading profile) to a traditional buy and hold strategy of the index SPY.
Note, There are other filters that could also be added including a long-term moving average/percentile rank filter/ADX filter etc, to improve the returns further.
The filter closes our long position during periods of volatility that exceed the 95th percentile (or in the top 5% of volatile days) and buys back when the volatility is below 95% rank of the past 100 days
Have included the backtest results since 1993 which is 28 years of data at the time of writing. Comparison of traditional buy and hold with this modified strategy can be found below:
Traditional buy and hold:
Return per year: 7.95 % (ex Dividends)
Total return: 851.1 %
Max drawdown: 50.79 %
'Modified' buy and hold (this script):
Return per year: 9.92 % (ex Dividends)
Total return: 1412.2 %
Max drawdown: 31.57 %
Feel free to use some of the market filters in my trading profile to improve and refine your strategies further, or make a copy and play around with the code yourself. This is just a simple example for demo purposes.

Agisko Crypto Scalper v4.2 (BUY/SELL)Indicator that generates BUY and SELL shapes with alerts.
OSC scale can be configured to visualize the oscillator better. Nothing required, just for visualization.
DMI mark is by default 10 which is fine for most situations.
DMI range is the buffer zone where BUY orders will be created. E.g.: DMI mark 10 and DMI range 1 will create a zone for BUY when DMI+ is between 9 and 11 (10-1 and 10+1).
This works perfect on the 5 minute chart and is suggested to use the SELL alert for exits or use a take profit (TP) of 1% with optional trailing if you use bots like 3 commas.
Stoploss is the same. Use the SELL alert or set a manual stoploss of 2-5%.
TDI - Traders Dynamic Index + RSI Divergences + Buy/Sell SignalsTraders Dynamic Index + RSI Divergences + Buy/Sell Signals
Credits to LazyBear (original code author) and JustUncleL (modifications)..
I added some new features:
1- RSI Divergences (Original code from 'Divergence Indicator')
2- Buy/Sell Signals with alerts (Green label 'Buy' - Red label 'Sell')
3- Background colouring when RSI (Green line) crosses above MBL (yellow line)
- Buy and Sell Signals are generated using Dean Malone's method (The Author of the TDI indicator) as mentioned in his PDF: (( www.forexfactory.com )), according to:
** Buy (Green Label) = RSI > 50, Red line, & Yellow line
** Sell (Red Label) = RSI < 50, Red line, & Yellow line
- I found that the best quality long trades generated when RSI crosses above red line, yellow line and they are all above 50, and vice versa for sell trades.
-I figured out another way to generate Buy/Sell Signals when RSI crosses above the yellow line, and you can stay with the trade till RSI crosses under the yellow line (I made a background colouring for that to be easily detected)
Hope you all wonderful trades..
مؤلف المؤشر هو (Dean Malone)
وكتب LazyBear كوده في tradingview
وأضاف JustUncleL بعض التعديلات عليه
أضفت إليه بعض المزايا الأخرى المتمثلة في:
1- رصد انحرافات مؤشر القوة النسبية
2- إشارات بيع وشراء بناء على طريقة مؤلف المؤشر
3- تظليل بالأخضر للمنطقة التي يعبر فيها مؤشر القوة النسبية الخط الأوسط (الخط الأصفر)
إشارات البيع والشراء تكون كالتالي:
** الشراء عندما يكون مؤشر القوة النسبية فوق الخط الأحمر وفوق خط الـ 50 وفوق الخط الأصفر
** البيع عندما يكون مؤشر القوة النسبية تحت الخط الأحمر وتحت خط الـ 50 وتحت الخط الأصفر
** أفضل إشارات الشراء حينما يعبر مؤشر القوة النسبية فوق الخط الأحمر والأصفر، ويكونوا جميعا فوق خط الـ 50، والعكس بالنسبة لإشارات البيع
يمكن استخدام المؤشر في دخول صفقات متوسط المدى، وذلك عندما يعبر مؤشر القوة النسبية فوق الخط الأصفر (قمت بتظليل المنطقة بالأخضر لسهولة رصدها) والخروج من الصفقة إذا نزل مؤشر القوة النسبية عن الخط الأصفر،
يرجى التنبه إلى أن الدخول والخروج يكون بأسباب فنية مدروسة، والمؤشر يدعم قراراتك فقط، ولا يمكن الاعتماد عليه منفردا في تحديد نقاط الدخول أوالخروج.
تجارة موفقة لكم جميعا :)

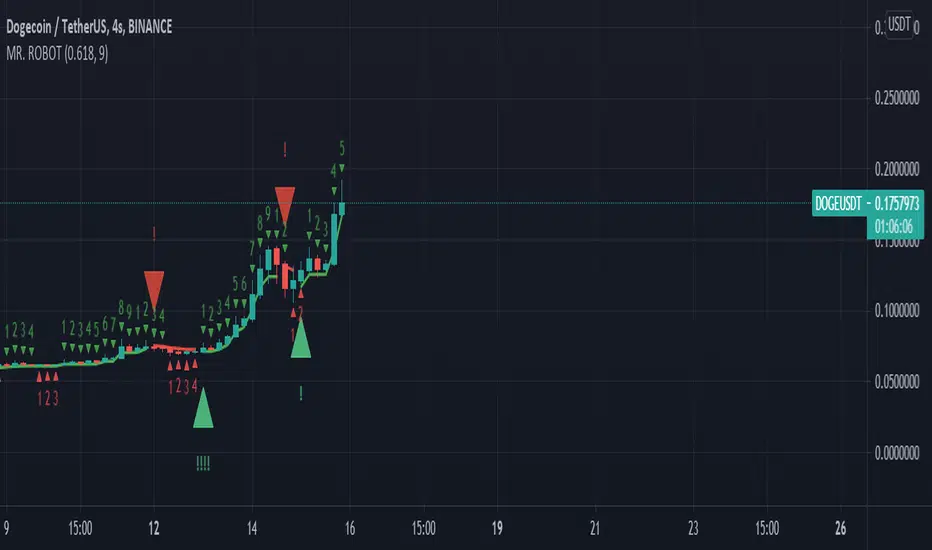
MR. ROBOT v.1.0.0This script consists of a logical blend of TD Sequental, MACD and Stochastic RSI based on the Supertrend function. In addition, these indicators use the golden proportional point of each candle as a source.
The exclamations on the signal indicating signs express the strength of the signal and consist of four levels;
! : Weak level signal
!! : Partial level signal
!!! : Medium signal
!!!! : High level signal
The fact that these interjections refer to four different levels is related to the programmatic consideration of four different indicators and functions. Since the script is based on four different indicators
basically, the exclamation numbers of the signals are related to how many indicators are signaling at the same time. However, it does not always overlap. For example, when 3 indicators signal at the same time, 3 exclamation points may not appear on the signal sign. This is because the script also takes into account special bar algorithms.
The only setting that you can intervene on the script - for now - is the multiplier and length values of the supertrend function. Changing these settings changes the signal strengths and frequencies. The script is based on the supertrend function alone, it is the ability to follow the trend after the signals given by the internal indicators. This situation decreases the rate of false signals and frequent signals in internal indicators.
This script or its author is not responsible in any way for any profits or losses arising from transactions. Does not contain investment advice.
AEE indicator* Indicator is based on average pricing and optimized exit points
* Indicator can identify trend direction in most time frames (preferably 1H & 4H tf)
* Indicator can be used on a variety of currency pairs in FOREX, crypto, and also commodity’s/stocks
* Always use the indicator with confluence
* Always use a risk to reward of 1:1 (or more if you are confident enough)
This indicator was made to simplify your trading and give a different perspective of the market. Enjoy!
Source code is not for sale…

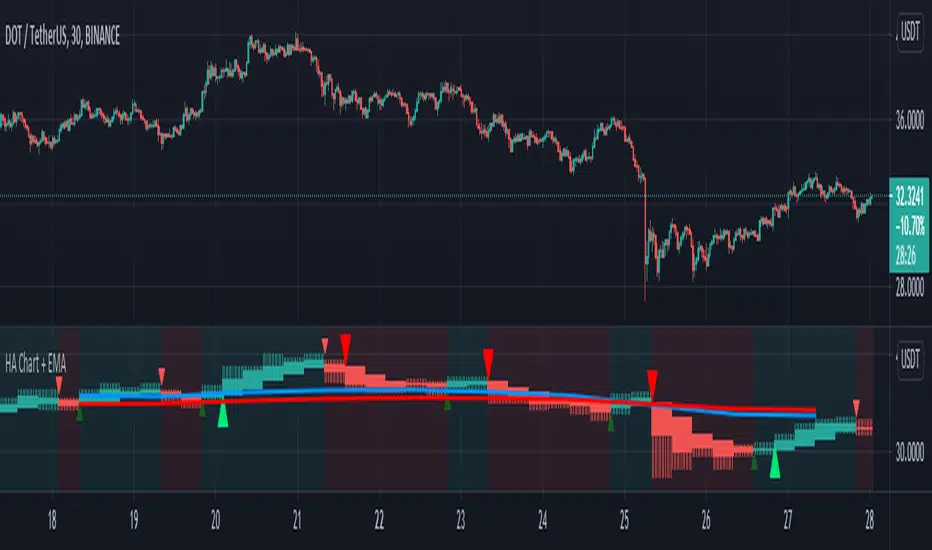
HA Chart with two EMA Trends and Signal Alert by GodtrixHi guys, how ya doing!
Benefits:
1) This tool is to add convenience of viewing HA chart at the same time with your main candle chart at different timeframe (resolution), so you save energy from switching between the candles and timeframe.
2) It comes with two seperate EMA:
a) 1day EMA trend lines set at length 10 & 20, this is the best setting ever for seeing long term trend.
-> Bull Trend - Blue line (10) above Red line (20) AND the same time price candle is above the Red line
-> Bear Trend - Red line (20) above Blue line (10) AND the same time price candle is below the Blue line
b) 2nd EMA trend lines for your own preference and conveniences. I use it at 2 hour timeframe, to help me decide for Entry/Exit orders, works great for me.
3) Provided with Singal Alert for Buy Sell Entry & Exit (This is not strategy, please study history and do your own calculation before following the Alert Signals)
There is two choices:
-> Normal Crossover - it simply alert you going from Red to Green or Green to Red candle
-> Strong Crossover with short Tail - This is a better version that checks on the candle size, tail size and body (open-close) size
If you want a complete Strategy, please go over to my script section, I've also published Strategy tool.
COINBASE:BTCUSD COINBASE:ETHUSD
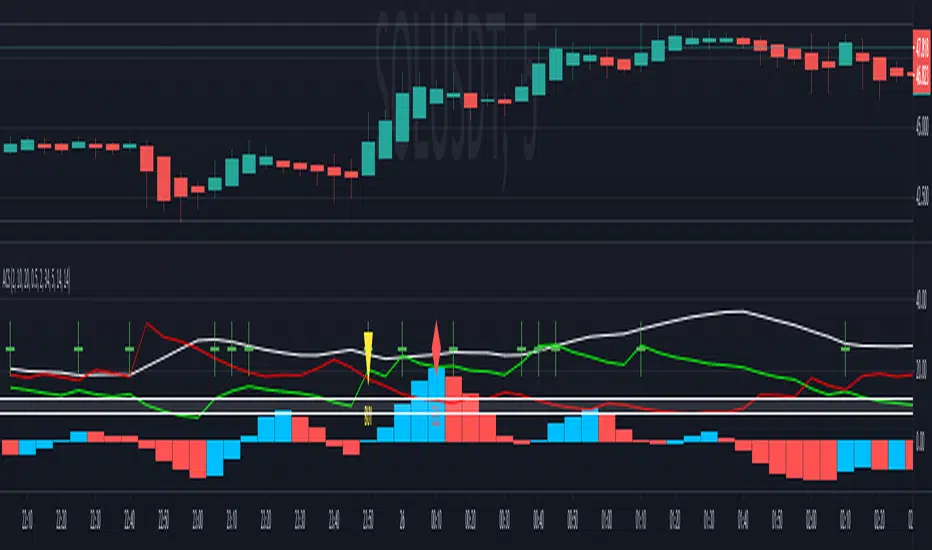
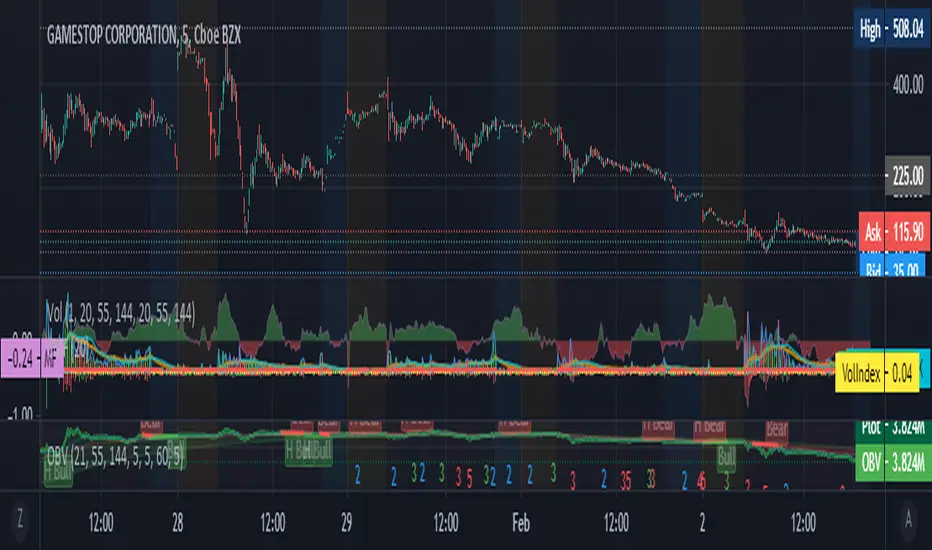
The Bayesian Q OscillatorFirst of all the biggest thanks to @tista and @KivancOzbilgic for publishing their open source public indicators Bayesian BBSMA + nQQE Oscillator. And a mighty round of applause for @MarkBench for once again being my superhero pinescript guy that puts these awesome combination Ideas and ES stradegies in my head together. Now let me go ahead and explain what we have here.
I am gonna call it the Bayesian Q Oscillator I suppose. The goal of the script is to solve an issue both indicators on their own suffer from. QQE signals are not new and often the problem has always been false signals for them. They are good for scalping but the difference between a quality move and a small to nearly nonexistent move following a signal is not so clear. Kivanc made his normalized version to help reduce this problem by adding colors to his histogram type verision that would essentially represent if price was a trending move or in a ranging structure. As you can see I have kept this Idea but instead opted for lines as the oscillator. two yellow line (default color) is a ranging sideways area and when there is red or green it is trending up or down. I wanted to take this to the next level with combining the Bayesian probability oscillator that tista put together.
The Bayesian indicator is the opposite for its issue as it is a probability indicator that shows which candle or price movement is more likely to come next. Red rising means possibly down move soon and green means up soon. I will not go into the complex details of this indicator but will suggest others take a look at his and others to understand the idea behind them. The point I am driving at is that it show probabilities or likelyhood without the most effecient signal device to match it. This original was line form and now it is background filled colors.
The idea. is that you can potentially get some stronger and more accurate reversal signals with these two paired together. when you see a sell signal or cross with the towering or rising red... maybe it is a good jump potentially. The same for green. At the same time it is a double added filter effect from just having yellow represent it is ranging... but now if you get a buy signal (example) and have yellow lines (example) along wi5h a red rising or mountain color background... it not only is an indication of ranging, but also that there is potentially even a counter move coming based on the probabilities. Also if you get into a good trade and see dual yellow qqe crosses with no color represented by the bayesian background... it is possible it might only be noise.
I have found them to work decently in the 1 hour timframe. Let me know your experience.
I hope everyone takes a look at the originals to understand them. Full credit goes to those guys for this to be here. Let me know how it is working out for you.
Here are the original links.
bayesian
Normalized QQE

Ninja Scalping: IndicatorThis is a strategy version for scalping signals. The objective of these signals is to accumulate more BTC through buying and selling of Altcoins. Thus, it is expected that these signals yield BTC gains when the crypto market has bullish days, as when BTC bleeds, other coins bleed even more. Let us get ready for the altseason!!
As mentioned above, the goal is to increase BTC's holdings through buying and selling of Alts. However, different Alts react differently against BTC. Therefore, there is no set of parameters that works for all Alts. The good news is that I tried my best to limit the number of parameters required to be tuned for a specific Alt to two. Also, this strategy helps back-test and tune the parameters for the desired Altcoin, with no guarantee that what happened in the past would happen in the future. This strategy is generally conservative, and it does not enter many trades. However, you can be more aggressive by changing the multiplier value: the smaller the value, the more aggressive the strategies. One can be more aggressive when the market is super bullish. Actually, you can test this by playing with the dates for the back-testing to have an idea of what would be suitable parameters when BTC is strong or weak. For the image attached, the strategy is back-tested from Jan 1, 2021, to March 18, 2021, assuming an initial capital of 1 BTC.
For the time span parameter, typical values are 5, 10, 14, 21, 34, 50, and 100. For the multiplier, typical values range between 0.01 and 2.
Use it at your own risk. Feedbacks are more than welcome. Happy trading!

Ninja Scalping: StrategyThis is a strategy version for scalping signals. The objective of these signals is to accumulate more BTC through buying and selling of Altcoins. Thus, it is expected that these signals yield BTC gains when the crypto market has bullish days, as when BTC bleeds, other coins bleed even more. Let us get ready for the altseason!!
As mentioned above, the goal is to increase BTC's holdings through buying and selling of Alts. However, different Alts react differently against BTC. Therefore, there is no set of parameters that works for all Alts. The good news is that I tried my best to limit the number of parameters required to be tuned for a specific Alt to two. Also, this strategy helps back-test and tune the parameters for the desired Altcoin, with no guarantee that what happened in the past would happen in the future. This strategy is generally conservative, and it does not enter many trades. However, you can be more aggressive by changing the multiplier value: the smaller the value, the more aggressive the strategies. One can be more aggressive when the market is super bullish. Actually, you can test this by playing with the dates for the back-testing to have an idea of what would be suitable parameters when BTC is strong or weak. For the image attached, the strategy is back-tested from Jan 1, 2021, to March 18, 2021, assuming an initial capital of 1 BTC.
For the time span parameter, typical values are 5, 10, 14, 21, 34, 50, and 100. For the multiplier, typical values range between 0.01 and 2.
Use it at your own risk. Feedbacks are more than welcome. Happy trading!

MTF SwingSwiss - Premium@panthair9, a SwingSwiss user, asked me to develop this script based on the two SwingSwiss crosses.
The indicator shows in real-time how the other timeframes are trading the asset.
It's pretty useful to know that the higher timeframes are also trading your way as it limits your risk (because you are trading the right trend)
You can choose up to five timeframes and style the lines and colored blocks 😃
There is one line per timeframe and whenever the green cross appears on the timeframe, it will get updated into the line as well !! I love the thing, thanks again @panthair9 ❤️
PS:
Dear SwingSwiss community, I am really trying to build the best indicator out there!
If you feel like I could improve the indicator in any way, just ask!
I'll do my best to make your dream indicator come true 🙌
Have A Great Day
Dan

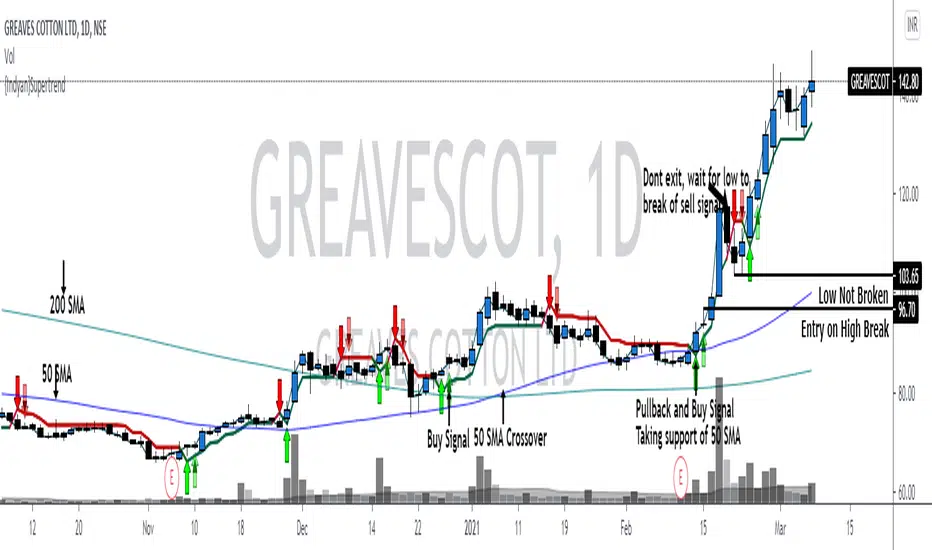
{Indyan}SupertrendHello trader friends,
A very simple but effective supertrend startegy which help u to get good RR. It is combination of 3 supertrend values with sma crossover. Enrty at pullback after sma crossover , exit only if sell signal low is broken.
I hope it will help my trader friends.
Love Indyan
Vol Buy/Sell %s, CMF, and Stocahstic Osc & UOPlots % Buy / Sell Volume , Chaikin Money Flow , Stochastic Oscillator, and Ultimate Oscillator on same axis, bound -1 to 1.
Show Volume Percentage, displaying buying as green and positive, selling as red and negative.
Showing the CMF, with green / red fill for positive / negative values.
Modified Stochastic Oscillator, converting bounds to -1 and 1, moving overbought/sold to -0.6 and 0.6, accordingly. Green fill (buy signal) with %D below -0.6 and %K lower than %D. Red fill (sell signal) with %D above 0.6 and %K higher than %D. Fill is between %D and bound, to be more visible.
Modified Ultimate Oscillator, converting bounds to -1 and 1, moving overbought/sold to -0.6 and 0.6, accordingly.

Chaikin Money Flow with Volume PercentsShowing the CMF, with green / red fill for positive / negative values, overlaid with Volume Percentage, displaying buying as green and positive, selling as red and negative.

MACD Strategy (SL/TP Levels and Risk Management)Strategy based on MACD and EMA.
- Risk/Reward Ratio can be adjusted
- SL level can be slightly adjusted (Takes the last low/high as SL)
- Visual representation of SL and TP levels
- Risk management => 1 % max loss on a trade

[FTA] Double Responsive Price FilterThis is a very special indicator which uses a series of double filtering methods to filter out bad price data.
Each filter uses a very complex mathematical formula to obtain the data, based on the Wave Function, then applies initial signal filtering on the output.
The output of each filter is then compared to each other, and the output of this stage goes through another signal filtering process which is used in aviation industry (NASA) to track objects and keep them under radar!
The final output is then squeezed through a truncated bandpass filter and plotted as two colors.
This is to ensure a very quick and responsive entry and exit signal without any lagging, and also to ensure that the trader stays in the trade as long as profitable!
Buy when color is aqua.
Sell when color is fuchsia.

Precise_SignalThis signal combines a portion of Chris Moody's 2014 SlingShot and my 2017 MTF Indicators. Both of our prior scripts over indicated Buy and Sell Points. This signal indicates a buy or sell point much less than our prior scripts did but with absolute precision.
I would say it is 100% accurate, but that is because I am yet to find a timeframe and symbol where the Buy signal failed to see the equity move up or the Sell signal failed to see the equity move down over the next 5 bars. I have tested 2000 charts so far. To be safe, I would rather state this indicator is accurate nearly 100% of the time.
The indicator is made up of 2 main portions and both of them have to agree on a buy or sell in order to indicate such with a vertical green or maroon bar beneath the chart. If there is a failure to agree, nothing is signaled.
Indicator 1 combines a stochastic of a 3 hour chart and a daily chart to determine when the stochastics are in agreement on direction. When there is agreement, both of them MUST cross from a buy state to a sell state and vice versa at exactly the same time. This is difficult to achieve and it is already rare for this occurrence to produce a signal. When a signal is produce it is combine with Chris Moody's 2014 SlingShot Indicator which conservatively determines Buy and Sell signals based on EMAs and market direction. Signals from his SlingShot are infrequent.
BUY Signal
When my MTF signals Buy at the same time that the SlingShot signals a Buy, a vertical green bar will appear in the window containing this script. The vertical bar is based on the close price of the equity and is only final when the close price is final. A BUY signal means the equity will move up potentially as early as the next bar and achieve a higher value from the close price on the signal bar.
SELL Signal
Likewise, a sell signal from the MTF at the same time as a sell signal from the SlingShot will create a maroon bar in the window containing this script. The vertical bar is based on the close price of the equity and is only final when the close price is final. A SELL signal means the equity will move down potentially as early as the next bar and achieve a lower value from the close price on the signal bar.
The default values for this script are hard-coded into this script. You can edit any of the value you would like to play with other timeframes, stochastic, and moving average lengths.
I have played with these values and have hard-coded the ones that are most accurate. Please let me know if you find others that work.
Hopefully this becomes an extra tool in your technical trading toolkit.
