스크립트에서 "stoch"에 대해 찾기
Stochastic XThe "Stochastic X" script is a customizable momentum oscillator designed to help traders identify potential overbought and oversold conditions, as well as trend reversals, by analyzing the relationship between a security's closing price and its price range over a specified period. This indicator is particularly useful for traders looking to fine-tune their entry and exit points based on momentum shifts.
🔧 Indicator Settings and Customization
The script offers several user-configurable settings to tailor the indicator to specific trading strategies:
In addition to the source type, %K Period, %D Period, and Signal line periods you can now change moving average calculation for the stochastic and signal lines.
This script allows selection among various moving average methods (e.g., SMA, EMA, WMA, T3) for smoothing the %K and signal lines. Different methods can affect the responsiveness of the indicator.
🎨 Interpreting Background Colors
The script enhances visual analysis by changing the background color of the indicator panel based on the %K line's value:
Green Background: Indicates that the %K line is above 50, suggesting bullish momentum.
Red Background: Signifies that the %K line is below 50, pointing to bearish momentum.
Light Green Overlay: Appears when the %K line exceeds 80, highlighting overbought conditions.
Light Red Overlay: Shows up when the %K line falls below 20, indicating oversold conditions.
These visual cues assist traders in quickly assessing market momentum and potential reversal.
📈 Trading Strategies Using Stochastic X
Traders can utilize the Stochastic X indicator in various ways:
Overbought/Oversold Conditions:
A %K value above 80 may suggest that the asset is overbought, potentially signaling a price correction.
A %K value below 20 could indicate that the asset is oversold, possibly leading to a price rebound.
Signal Line Crossovers:
When the %K line crosses above the signal line, it may be interpreted as a bullish signal.
Conversely, a %K line crossing below the signal line might be seen as a bearish signal.
Divergence Analysis:
If the price makes a new high while the %K line does not, this bearish divergence could precede a price decline.
If the price hits a new low but the %K line forms a higher low, this bullish divergence might signal an upcoming price increase.
Trend Confirmation:
Sustained %K values above 50 can confirm an uptrend.
Persistent %K values below 50 may validate a downtrend.
In this chart, observe how the background colors change in response to the %K line's value, providing immediate visual feedback on market conditions. The crossovers between the %K and signal lines offer potential entry and exit points, while the overbought and oversold overlays help identify possible reversal zones.
⚙️ Adjusting Settings for Optimal Use
The Stochastic X indicator's flexibility allows traders to adjust settings to match their trading style and the specific asset's behavior:
Short-Term Trading: Use shorter periods (e.g., 5 for %K) and more responsive moving averages (e.g., WMA, VWMA, EMA, DEMA, TEMA, HMA) to capture quick market movements.
Long-Term Trading: Opt for longer periods (e.g., 14 for %K) and smoother moving averages (e.g., SMA, RMA, T3) to filter out noise and focus on broader trends.
Volatile Markets: Consider using the T3 moving average for its smoothing capabilities, helping to reduce false signals in choppy markets.
By experimenting with different settings, traders can fine-tune the indicator to better suit their analysis and improve decision-making.

Avg Stoch-RSIThis is a Stochastic RSI measurement that averages four different RSI lengths in order to catch short length as well as longer length trends. The lengths are intentionally chosen to give you periods between 1 to 4 days on the 1hr and proportionally further back by increased period.


MTI Stochastic RSI with Color Bars and ZonesPlots the %D line of a Stochastic Oscillator calculated from the RSI of close of length 14.
Red Sell Zone above 80, candles paint red
Green Buy Zone below 20, candles paint green

quad Stoch'sIt's like a Stochastic Oscillator, but there are four of them. Wait for all four to show overbought or oversold and then enter once the fastest moving oscillator breaks out
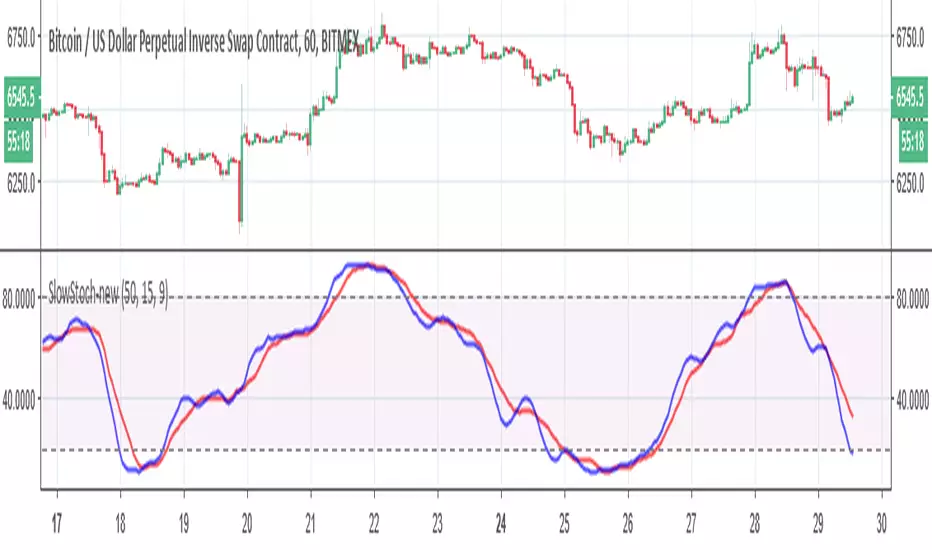
Slow Stochastic-newnothing fancy here, just some modification to the old stoch to make it more realistic
Classical Stochastic OscillatorI guess the build in STOCH indicator has some problem, it shows totally different compare to other software like MT4, so I create this one with the original definition, enjoy it!

MTF Stochastic, A versionHey everybody,
Here is a version of a MTF Stochastic script I wrote a while ago. The code is based on a formula written by Peter_O and the built in Tradingview Stochastic indicator. See this link to the original script of Peter_O. I use this formula a lot if I want to build in a Stochastic trend filter in my strategies. In this version I added options to plot different signals and trends.

Upgraded Stochastic by YenJust an enhanced version of stochastic which added with special symbol whenever K and D line crossing up or down.
Background color is green whenever K line is above middle level 50 and red when below middle level 50.
You may also turn on the histogram in settings.

StochasticUser request. A tuned version of the built-in Stochastic indicator with the following options included:
K-D Histogram
K/D Crossovers
K/D Ribbon
Bands breakouts highlighting
Middle line crossovers background

Fibonacci StochasticMy attempt to smooth out the classic Stochastic indicator based on Fibonacci levels - 0.236, 0.382, 0.5, 0.618, 0.786
Includes optional "Smoothed Moving Average" (SMMA), SMA and EMA.
This is an interesting experiment, comments would be helpful to improve this indicator.

Double Stochastic Multi-TimeframeI personalized a double stochastic oscillator.
HOW IS IT USED ?
Everyone should adapt the parameters to its way of trading.
First you must have a confirmation of the trend.
In positive trend, a double stochastic > 20 can be used t enter long.
In negative trend, a double stochastic < 80 can be used t enter long.
Of course this is only one possibility that everyone should adapt.
I added the possibility to add on the chart a 2nd timeframe for confirmation.
If you found this script useful, a tip is always welcome... :)


MultiTime Stochastics ProMultiTime Stochastics Pro
This indicator is an enhanced version of the stochastic indicator, featuring two separate stochastics. This functionality allows you to adjust the settings and time frame for each stochastic individually, enabling a more precise analysis of market fluctuations.
The Double Stochastic indicator enables you to simultaneously analyze the market in different time frames with two separate stochastics. One of the standout features of this indicator is that when the chart's time frame changes, each stochastic is displayed according to the time set for it and does not change in other time frames. This feature provides greater flexibility and accuracy in market analysis.
How the Indicator Works
This indicator calculates two separate stochastics:
The first stochastic (K1 and D1) with its own specific time frame and settings.
The second stochastic (K2 and D2) with a different time frame and settings.
These two stochastics are displayed simultaneously on one chart, and overbought and oversold lines are also included.
How to Use
Parameter Adjustment : Adjust the parameters K1 Length, D1 Smoothing, and K1 Time Frame as desired. Do the same for the second stochastic.
Signal Analysis : Analyze buy and sell signals based on the stochastic values and the overbought and oversold lines.
Advantages
Greater Precision : With two separate stochastics, you can follow market fluctuations with greater accuracy.
Flexibility : The ability to individually set the time frame and parameters for each stochastic makes this indicator highly flexible.
Stronger Signals : The simultaneous display of two stochastics allows you to receive stronger buy and sell signals.
Multi-time frame Analysis : The ability to analyze the market in different time frames simultaneously.
This indicator is suitable for traders seeking more precise and flexible market analysis tools. I hope these explanations help you publish your indicator in the best possible way!

Dual Stochastic Enhanced (with Presets giua64)Script Title: Dual Stochastic Enhanced (with Presets giua64)
Overview:
This indicator enhances the traditional Dual Stochastic strategy, aiming to provide more filtered and potentially reliable trading signals. By integrating dynamic overbought/oversold levels via Bollinger Bands on the slow stochastic, a trend filter based on a moving average, momentum confirmation via RSI, and user-friendly selectable presets, "Dual Stochastic Enhanced" seeks to offer a more robust approach to identifying potential entry points.
Key Features:
Dual Stochastics: Utilizes a slow stochastic (configurable, e.g., 14 periods) as a context filter and a fast stochastic (configurable, e.g., 5 periods) as a signal trigger.
Bollinger Bands on Slow Stochastic: Instead of fixed overbought/oversold levels (80/20), Bollinger Bands are applied to the %K line of the slow stochastic. This creates dynamic zones that adapt to the stochastic's own volatility.
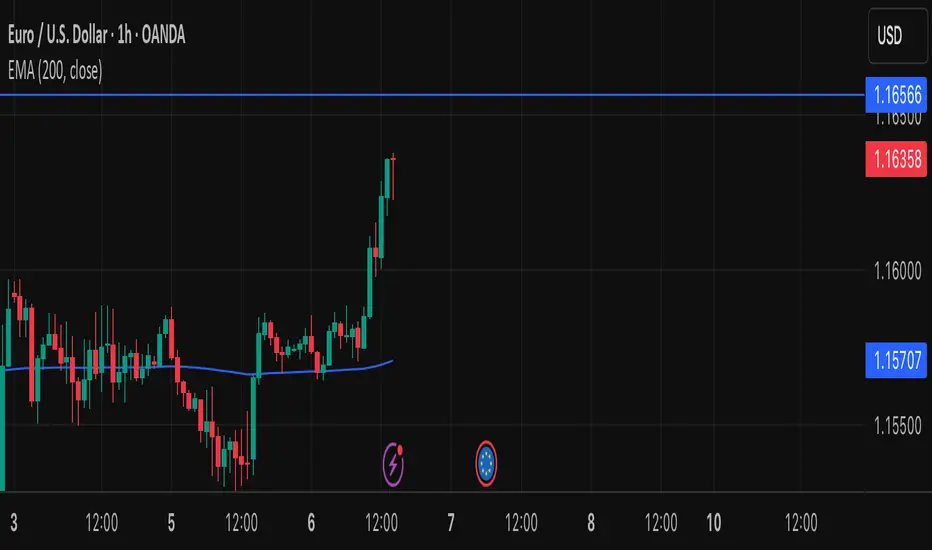
Trend Filter: A moving average (configurable type and length, e.g., EMA 100 as seen in the example chart for general context) on the price helps filter signals, allowing only trades aligned with the prevailing trend.
RSI Confirmation: An RSI oscillator (configurable length, e.g., 14 periods) is used to confirm momentum. Signals require the RSI to cross certain thresholds to validate the strength of the move.
User Presets: Includes presets for "Scalping," "Intraday," and "Swing trading," which quickly set all key parameters to suit different styles and timeframes. A "Custom" option is also available for full manual configuration.
Clear Visual Signals: Long (green) and Short (red) arrows appear on the chart when all entry conditions are met.
Active Zone Highlighting: The background of the indicator panel changes color (green or red) when "active zone" conditions (a combination of stochastics, trend, and RSI) are favorable.
Information Panel: A table in the top-right corner of the indicator panel displays the current status of the selected preset, trend filter, RSI value, and stochastic levels.
Signal Logic:
A LONG signal is generated when:
The fast stochastic %K crosses above its %D line.
The slow stochastic %K line is below its lower Bollinger Band (dynamic oversold condition).
The fast stochastic %K line is also in a low area (e.g., <25) to confirm the trigger is not premature.
The closing price is above the trend moving average (uptrend).
The RSI is above its long confirmation level (e.g., >40), indicating sufficient bullish momentum.
A SHORT signal is generated when:
The fast stochastic %K crosses below its %D line.
The slow stochastic %K line is above its upper Bollinger Band (dynamic overbought condition).
The fast stochastic %K line is also in a high area (e.g., >75).
The closing price is below the trend moving average (downtrend).
The RSI is below its short confirmation level (e.g., <60), indicating sufficient bearish momentum.
How to Use:
Select a Preset suitable for your trading style and the timeframe you are analyzing (e.g., Scalping for M1-M15, Intraday for M5-H1, Swing for H4-D1).
Alternatively, choose "Custom" and manually adjust all parameters (stochastic lengths, smoothing, Bollinger Bands, Moving Average, RSI, confirmation thresholds).
Observe the Information Panel for a quick understanding of the current conditions.
Evaluate the arrow signals, always considering the broader market context, price action, and any other confluences (supports/resistances, chart patterns).
The background highlighting can help quickly identify periods where conditions are aligned for potential trades.
Disclaimer:
This script is provided for educational and informational purposes only. Trading involves significant risk, and past performance is not indicative of future results. Always thoroughly test any strategy or indicator on historical data and on a demo account before risking real capital. The author assumes no responsibility for any losses incurred from the use of this script.
Author: giua64

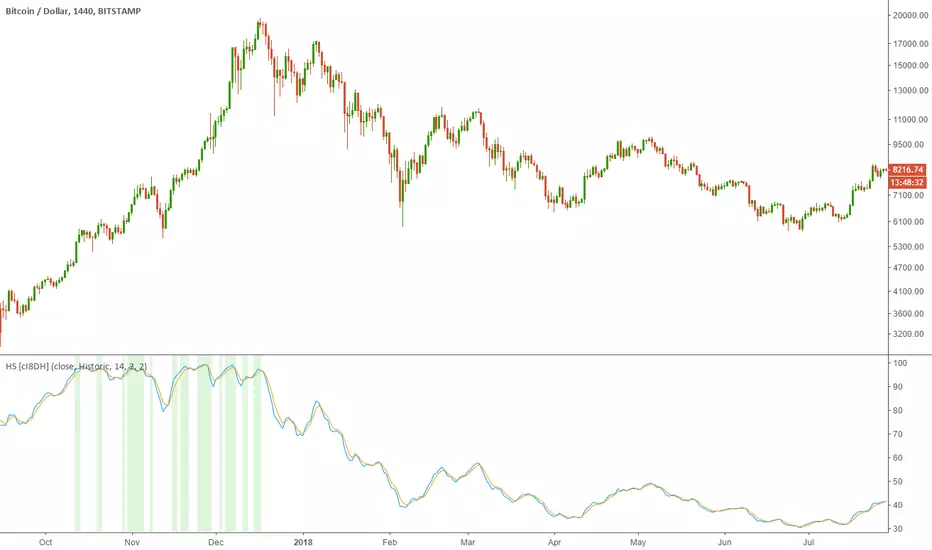
Historical Stochatic (HS) [cI8DH]This indicator calculates historical stochastic (HS). It also includes the standard stoch. HS works similar to the standard stochastic . The difference is that the standard stochastic has a set look-back period, while HS looks as far back as the first bar. This allows identifying ATHs and ATLs (background highlights green and red respectively). Basically, HS shows inverse retracement from ATL to ATH in percentage.
This indicator works best on non-range bound indicators such as MACD. As you can see in the chart below, MACD is not useful to compare against periods that price is wildly different. Applying HS on MACD fixes this issue (To achieve the same results, add MACD indicator > change the source to MACD on HS settings > since MACD is a smoothed indicator, smoothing length is set to 1. To get similar smoothing length on the signal as in standard MACD, set %D to 5 smoothed MA which is equivalent to 9 EMA smoothing on standard MACD).
Gain/Loss Moving Average (GLMA) is another indicator that can benefit well from HS. GLMA is the simplest and probably the most accurate momentum indicator. But it is not as convenient as RSI since it is not range bound. HS can make it range bound without compromising its accuracy. (To achieve the same results, add GLMA indicator > change the source to GLMA on HS settings > set %K length to 1).
Chart below shows HS applied to Accumulation/Distribution Money Flow (ADMF) and compares it against its range bound counter part, ADP.
Conclusion:
There are different ways of making an indicator normalized or range bound. Some indicators use RSI's approach (positive changes MA / all changes MA) such as MFI, CMF, ADP. This approach is great but the divergence near extremes can sometimes be misleading. HS fixes this problem as long as the indicator is not making a new ATH or ATL . When it does make new ATH or ATL , this indicator gives a warning to avoid using it for detecting divergence.
PS:
It is a bit geeky to apply HS on other indicators. I will publish some of my indicators with HS and standard stoch built-in. So stay tuned if u r interested in this indicator.
Read more here about using stochastic
www.tradingview.com(STOCH)
Three StochRSI ComboThree StochRSI with adjustable lengths in one indicator, with no extra bells or whistles. Lazybear's Apirine Slow RSI is used for the RSI formula for the third Stoch.
14-period StochRSI (red) is considered short term.
20-period StochRSI is another short to mid term preset I've seen used in various indicators on different platforms by default, and is included as the yellow stochRSI.
Lazybear's Apirine Slow RSI is used as the base for the third, slower stoch - parameter input adjustment for your specific timeframe and instrument is recommended. The Apirine Slow RSI doesn't have as effective strong divergences during established trends, so the way it would react in when run through a stoch should be more synergistic than not during trending periods for longer term trends.
StochRSI:
StochRSI measures the value of RSI relative to its high/low range over a set number of periods - It's important to note that StochRSI is technically an indicator of an indicator (RSI), which makes it the second derivative of price. This is part of the main contributing factors to how it looks and functions in relation to price.
A move above 80 ---> considered overbought.
A move below 20 ---> considered oversold.
Moves around the midline (50) can also be interpreted as continuation of upward/downwards trend depending on whether the midline is acting more of as a support (uptrend) or a resistance level (downtrend).
Stoch K-line disabled by default/D-line enabled by default.
Stoch K/D lengths are set to 3/3/14/14 (red), 6/6/20/20 (yellow), 12/12 (green) by default.
Midline (50) set to white/silver to make more visible on darkmode charts.
Additional adjustable levels for Overbought/Oversold beyond 20/80 (set at 10/90 by default - see dashed grey line. Dotted line is 20/80.)
Three stochRSI with 3/3/14/14, 6/6/20/20, and 12/12/14/14/6 length are shown below the indicator for reference.
Acknowledgements:
// Aprine Slow RSI - Lazybear
//
// Stockcharts for StochRSI reference
// school.stockcharts.com
Medium Term Weighted Stochastic (STPMT) by DGTLa Stochastique Pondérée Moyen Terme (STPMT) , or Mᴇᴅɪᴜᴍ Tᴇʀᴍ Wᴇɪɢʜᴛᴇᴅ Sᴛᴏᴄʜᴀꜱᴛɪᴄꜱ created by Eric Lefort in 1999, a French trader and author of trading books
█ The STPMT indicator is a tool which concerns itself with both the direction and the timing of the market. The STPMT indicator helps the trader with:
The general trend by observing the level around which the indicator oscillates
The changes of direction in the market
The timing to open or close a position by observing the oscillations and by observing the relative position of the STPMT versus its moving average
STPMT Calculation
stpmt = (4,1 * stoch(5, 3) + 2,5 * stoch(14, 3) + stoch(45, 14) + 4 * stoch(75, 20)) / 11.6
Where the first argument of the stoch function representation above is period (length) of K and second argument smoothing period of K. The result series is then plotted as red line and its moving average as blue line. By default disabled gray lines are the components of the STPMT
The oscillations of the STPMT around its moving average define the timing to open a position as crossing of STMP line and moving average line in case when both trends have same direction. The moving average determines the direction.
Long examples
█ Tʜᴇ CYCLE Iɴᴅɪᴄᴀᴛᴏʀ is derived from the STPMT. It is
cycle = stpmt – stpmt moving average
It is indicates more clearly all buy and sell opportunities. On the other hand it does not give any information on market direction. The Cycle indicator is a great help in timing as it allows the trader to more easily see the median length of an oscillation around the average point. In this way the traders can simply use the time axis to identify both a favorable price and a favorable moment. The Cycle Indicator is presented as histogram
The Lefort indicators are not a trading strategy. They are tools for different purposes which can be combined and which can serve for trading all instruments (stocks, market indices, forex, commodities…) in a variety of time frames. Hence they can be used for both day trading and swing trading.
👉 For whom that would like simple version of the Cycle indicator on top of the main price chart with signals as presented below.
Please note that in the following code STMP moving average direction is not considered and will plot signals regardless of the direction of STMP moving average. It is not a non-repainting version too.
here is pine code for the overlay version
// © dgtrd
//@version=4
study("Medium Term Weighted Stochastic (STPMT) by DGT", "STPMT ʙʏ DGT ☼☾", true, format.price, 2, resolution="")
i_maLen = input(9 , "Stoch MA Length", minval=1)
i_periodK1 = input(5 , "K1" , minval=1)
i_smoothK1 = input(3 , "Smooth K1", minval=1)
i_weightK1 = input(4.1 , "Weight K1", minval=1, step=.1)
i_periodK2 = input(14 , "K2" , minval=1)
i_smoothK2 = input(3 , "Smooth K2", minval=1)
i_weightK2 = input(2.5 , "Weight K2", minval=1, step=.1)
i_periodK3 = input(45 , "K3" , minval=1)
i_smoothK3 = input(14 , "Smooth K3", minval=1)
i_weightK3 = input(1. , "Weight K3", minval=1, step=.1)
i_periodK4 = input(75 , "K4" , minval=1)
i_smoothK4 = input(20 , "Smooth K4", minval=1)
i_weightK4 = input(4. , "Weight K4", minval=1, step=.1)
i_data = input(false, "Components of the STPMT")
//------------------------------------------------------------------------------
// stochastic function
f_stoch(_periodK, _smoothK) => sma(stoch(close, high, low, _periodK), _smoothK)
//------------------------------------------------------------------------------
// calculations
// La Stochastique Pondérée Moyen Terme (STPMT) or Medium Term Weighted Stochastics calculation
stpmt = (i_weightK1 * f_stoch(i_periodK1, i_smoothK1) + i_weightK2 * f_stoch(i_periodK2, i_smoothK2) + i_weightK3 * f_stoch(i_periodK3, i_smoothK3) + i_weightK4 * f_stoch(i_periodK4, i_smoothK4)) / (i_weightK1 + i_weightK2 + i_weightK3 + i_weightK4)
stpmt_ma = sma(stpmt, i_maLen) // STPMT Moving Average
cycle = stpmt - stpmt_ma // Cycle Indicator
//------------------------------------------------------------------------------
// plotting
plotarrow(change(sign(cycle)), "STPMT Signals", color.green, color.red, 0, maxheight=41)
alertcondition(cross(cycle, 0), title="Trading Opportunity", message="STPMT Cycle : Probable Trade Opportunity\n{{exchange}}:{{ticker}}->\nPrice = {{close}},\nTime = {{time}}")

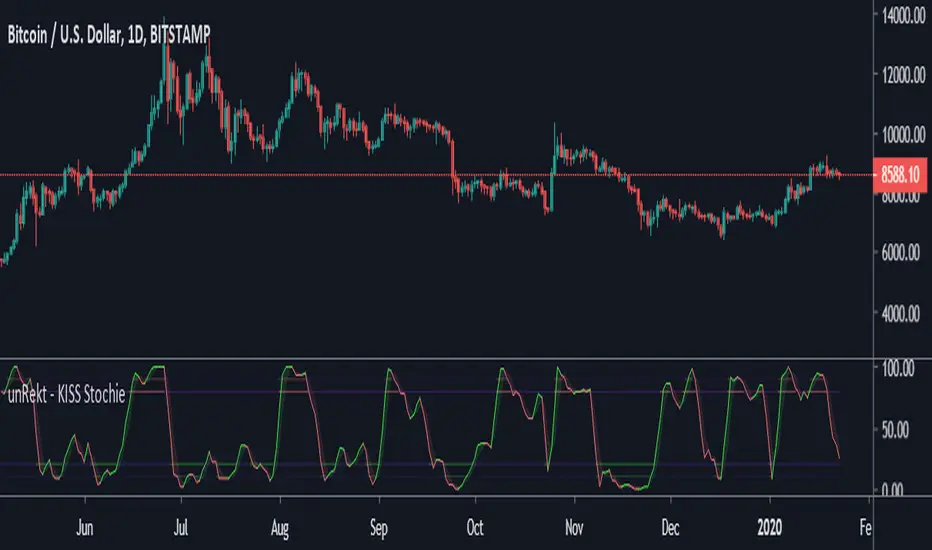
unRekt - KISS StochieStochie is the StochRSI indicator and is part of the ''keeping it simple' series that have a similar color scheme. The Stochastic RSI technical indicator applies the Stochastic Oscillator to values of the Relative Strength Index (RSI). The indicator thus produces two main plots FullK and FullD oscillating between oversold and overbought levels. The StochRSI can also be used to detect divergence and trend.
"The Stocashi" - Stochastic RSI + Heikin-AshiWhat up guys and welcome to the coffee shop. I have a special little tool for you today to throw in your toolbox. This one is a freebie.
This is the Stochastic RS-Heiken-Ashi "The Stocashi"
This is the stochastic RSI built to look like Heikin-Ashi candles.
a lot of people have trouble using the stochastic indicator because of its ability to look very choppy at its edges instead of having nice curves or arcs to its form when you use it on scalping time frames it ends up being very pointed and you can't really tell when the bands turn over if you're using a stochastic Ribbon or you can't tell when it's actually moving in a particular direction if you're just using the K and the D line.
This new format of Presentation seeks to get you to have a better visual representation of what the stochastic is actually doing.
It's long been noted that Heikin-Ashi do a very good job of representing momentum in a price so using it on something that is erratic as the stochastic indicator seems like a plausible idea.
The strategy is simple because you use it exactly the same way you've always used the stochastic indicator except now you can look for the full color of the candle.
this one uses a gradient color setup for the candle so when the candle is fully red then you have a confirmed downtrend and when the candle is fully green you have a confirmed up trend of the stochastic however if, you a combination of the two colors inside of one candle then you do not have a confirmed direction of the stochastic.
the strategy is simple for the stochastic and that you need to know your overall trend. if you are in an uptrend you are waiting for the stochastic to reach bottom and start curving up.
if you are in a downtrend you are waiting for the stochastic to reach its top or its peak and curve down.
In an uptrend you want to make sure that the stochastic is making consistently higher lows just like price should be. if at any moment it makes a lower low then you know you have a problem with your Trend and you should consider exiting.
The opposite is true for a downtrend. In a downtrend you want to make sure you have lower highs. if at any given moment you end up with a higher high than you know you have a problem with your Trend and it's probably ending so you should consider exiting.
The stochastic indicator done as he can actually candles also does a very good job of telling you when there is a change of character. In that moment when the change of character shows up you simply wait until your trend and your price start to match up.
You can also use the stochastic indicator in this format to find divergences the same way you would on the relative strength index against your price highs and price lows so Divergence trading is visually a little bit easier with this tool.
The settings for the K percent D percent RSI length and stochastic length can be adjusted at will so be sure to study the history of the stochastic and find the good settings for your trading strategy.
