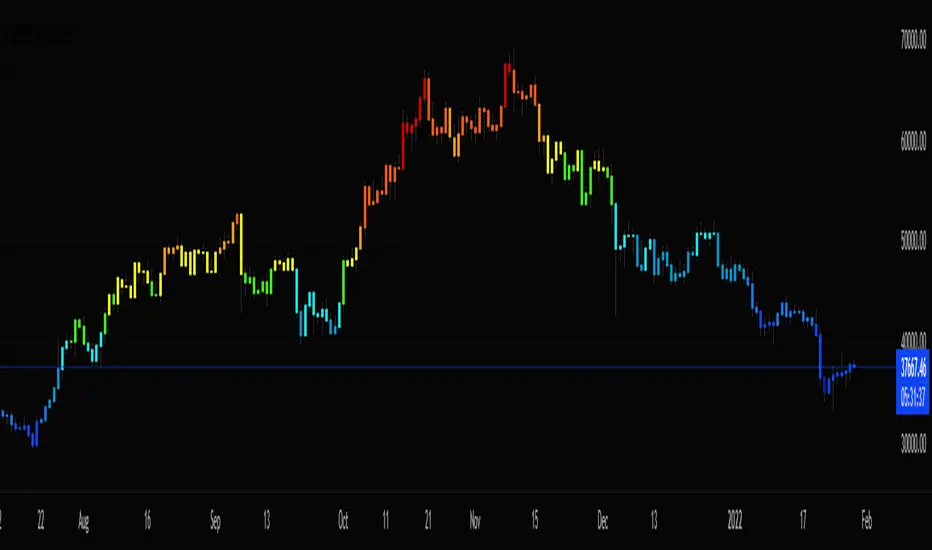
Stochastic CandlesA series of up to 28 stochastics oscillators used to form an average stochastic value, which is then used to colour the candles based on the momentum.
Each candle can be coloured one of ten colours and each one represents a position on the stochastic oscillator.
The indicator helps traders to visualise the momentum and helps trend following.
Inputs:
MA: multiple smoothing methods
Theme: multiple colours
Increment: stochastic length start and increments
End: stochastic length end
Smooth: smooth stochastic
스크립트에서 "stoch"에 대해 찾기
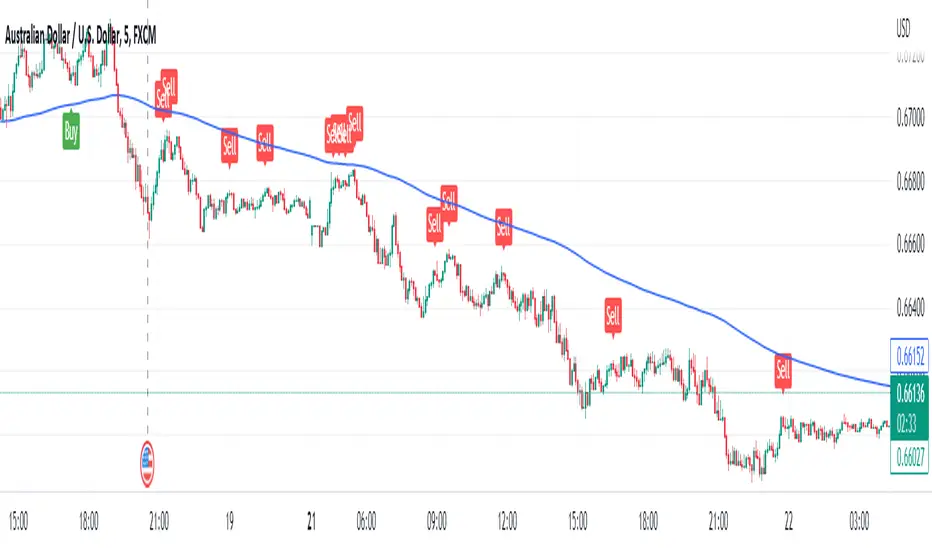
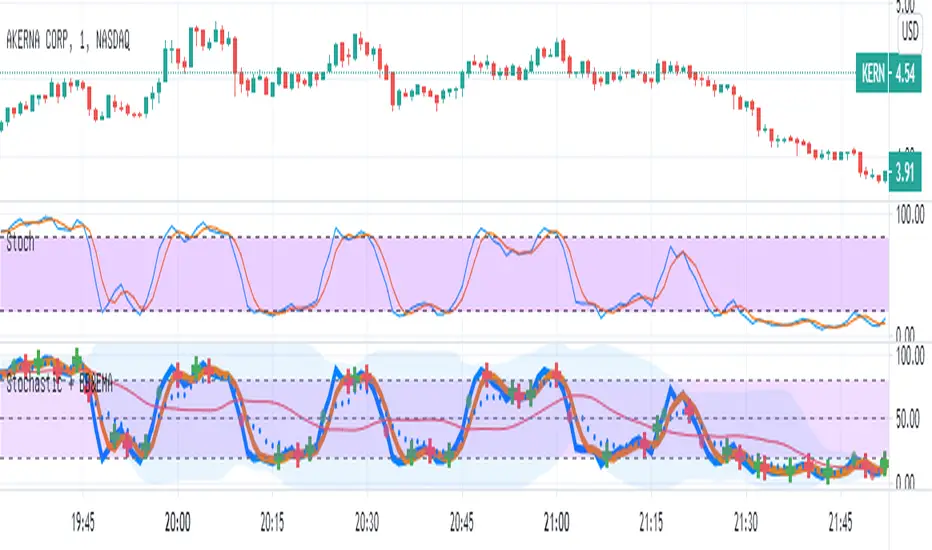
Stochastic Buy Sell with EMA TrendStochastic Buy Sell with EMA Trend is combination of two indicators only.
The Stochastic Oscillator ( STOCH ) is a range bound momentum oscillator. The Stochastic indicator is designed to display the location of the close compared to the high/low range over a user defined number of periods. Typically, the Stochastic Oscillator is used for three things; Identifying overbought and oversold levels, spotting divergences and also identifying bull and bear set ups or signals.
The Exponential Moving Average (EMA) is a specific type of moving average that points towards the importance of the most recent data and information from the market.
1) Stochastic - It is giving signal whenever cross happen in oversold or overbought zone.
2) EMA 200 - EMA 200 is used to identify market trend.
Long :
If stochastic giving buy signal and price is over 200 EMA.
Short :
If stochastic giving sell signal and price is below 200 EMA.
STOCH MTF with Moving AverageBasic STOCH indicator with MTF support with moving average
USE EMA Cross with Stoch for buy / sell signal

Stochastic MomentumThis RSI indicator uses the difference between the K and D values in the Stochastic RSI indicator. Using the same layered lengths of 12, 24, 48 and 96 intervals that the Avg Stoch RSI indicator, this offers a rate of change momentum measurement. Crossovers are at zero, this indicator gives a clearer indicator of market momentum.

Stoch Momentum Index* Original code from UCSgears.
* Added circles for when Stoch MI and signal line crosses.

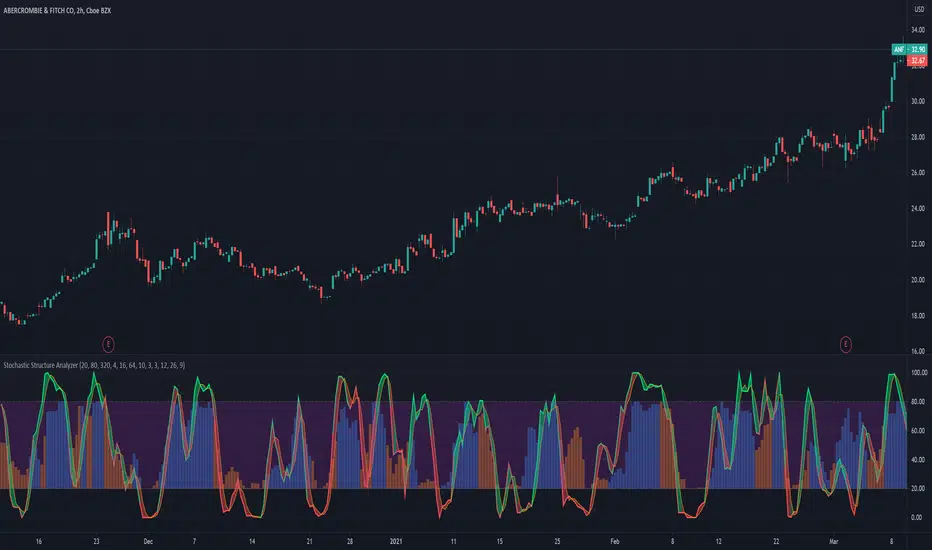
Stochastic Structure AnalyzerA momentum indicator that uses the highest and lowest values for price in three different lookback lengths to find the performance relative to three timeframes.
- Stochastic can be used for buy and sell signals as usual.
- The bars at the back represent the stochastic value of the OBV based structure calculation.
- The color of the stochastic line is a preliminary indicator of an up move.
- The fill color between the stochastic lines indicate the trend strength,
How to use: I suggest combining this with a higher timeframe to buy when the both stochastics are crossing below 20 line. And sell when one of the stochastics crosses-down.
This is the stochastic version of the structure analyzer().
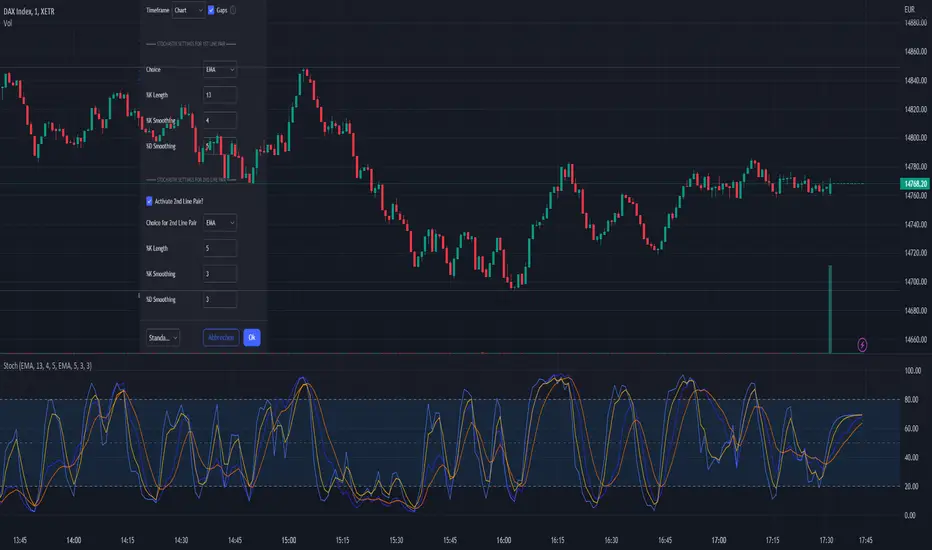
Stochastic EMA, SMA, VWMA + DivergenceEvery MetaTrader User knows the function to switch the stochastic calculation from simple to exponential.
So i took the original Stochastic code from TV and enhanced it for the SMA, EMA, and VWMA smoothing. If you are using a longer K Smoothing interval you will recognize a notable difference between SMA and EMA.
Standard Stochastic Calculation that is well kown
Option to switch smoothing calculation
Choice between Simple Moving Average, Exponential Moving Average, Volume Weighted Moving Average
If you have more wishes regarding the smoothing, just leave a comment i can add a lot more...
On my to-do list is also the divergence lines known from the "divergence indicator" (RSI).
I hope this helps to get better entries ;-)
Have fun!
Stochastic with Lines - ChartWhat is Stochastic with Lines - Chart and why do you need it?
I use it for chart analysis to identify key K/D levels from which bullish / bearish market structure continues to develop.
Chart means that every K/D cross above/below the signal lines will be notified on your Chart and not on the stocahstic oscillator. To see them on your chart please choose "Stochastic with Lines - Default" in my library.
Once K or the D line cross over or under your upper or lower signal line you will see background colors which you can adjust in the settings menu.
This small indicator is for a larger project which will be uploaded in several days/weeks.

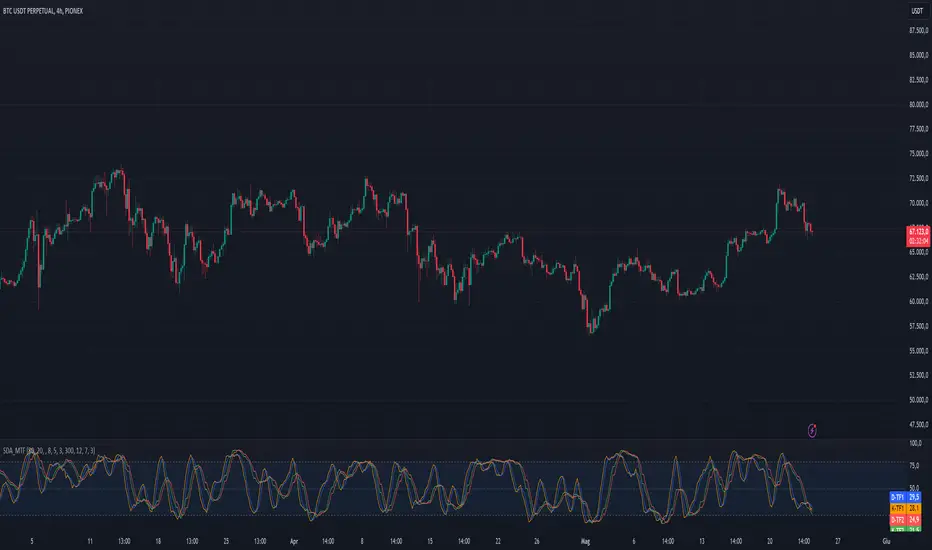
Stoch Double Analysis MTFThis indicator utilizes the Stochastic Oscillator on two different timeframes and generates alerts for potential long and short conditions based on the crossovers of the %K and %D lines of the Stochastic Oscillator. Here's a detailed breakdown of the code:
Inputs
Overbought and Oversold Levels:
ob_stc: Overbought level (default 80).
os_stc: Oversold level (default 20).
Timeframe 1 Configuration:
tf_stoch_1: The first timeframe for analysis.
length: Stochastic length (default 8).
smoothK: Smoothing for %K line (default 5).
smoothD: Smoothing for %D line (default 3).
Timeframe 2 Configuration:
tf_stoch_2: The second timeframe for analysis.
length_another: Stochastic length for the second timeframe (default 12).
smoothK_another: Smoothing for %K line for the second timeframe (default 7).
smoothD_another: Smoothing for %D line for the second timeframe (default 3).
Calculations
Volume Trend Calculation:
For both timeframes, the script calculates the volume trend. It determines up days and down days based on whether the closing price is higher or lower than the opening price and accumulates the volume accordingly.
Cumulative Volume:
Calculates the cumulative volume for up days and down days using the average of the high prices and the respective volumes.
Stochastic Oscillator Calculation:
Computes the %K and %D lines of the Stochastic Oscillator for both timeframes using the given lengths and smoothing factors.
Alerts
The script generates alerts for potential long and short conditions based on the crossovers of the %K and %D lines for both timeframes:
Long Condition: When %K crosses above %D.
Short Condition: When %D crosses above %K.
Plotting
Stochastic Lines:
Plots the %K and %D lines for both timeframes with different colors (orange and blue for the first timeframe, green and red for the second timeframe).
Overbought/Oversold Bands:
Adds horizontal lines at the overbought and oversold levels and a middle band at 50.
Fills the background between the overbought and oversold levels with a semi-transparent color.
Code Structure
Inputs Definition:
Defines all input variables for customization.
Volume Trend and Cumulative Volume Calculation:
Computes volume trends and cumulative volumes for both timeframes.
Stochastic Oscillator Calculation:
Calculates the %K and %D lines using the request.security function to get data from the specified timeframes and apply the smoothing functions.
Alert Conditions:
Checks for crossovers between the %K and %D lines to generate alerts for potential trading signals.
Plotting:
Plots the %K and %D lines for both timeframes and adds visual elements for overbought and oversold levels.
This indicator helps traders analyze market trends using the Stochastic Oscillator on multiple timeframes, providing potential buy and sell signals based on the interaction of the %K and %D lines.
The alerts generated by the "Stoch Double Analysis MTF" indicator can be viewed as part of a broader educational and training path for traders!
Stochastic ConfluenceShows 5 stochastic plots with moving average cross marks for different time-frames. Each plot is based on the current interval times the configurable multiplier.
E.g.: If you are viewing 1h chart, the settings 1, 2, 3, 4, 6 will get you stochs for the 1h, 2h, 3h, 4h and 6h.

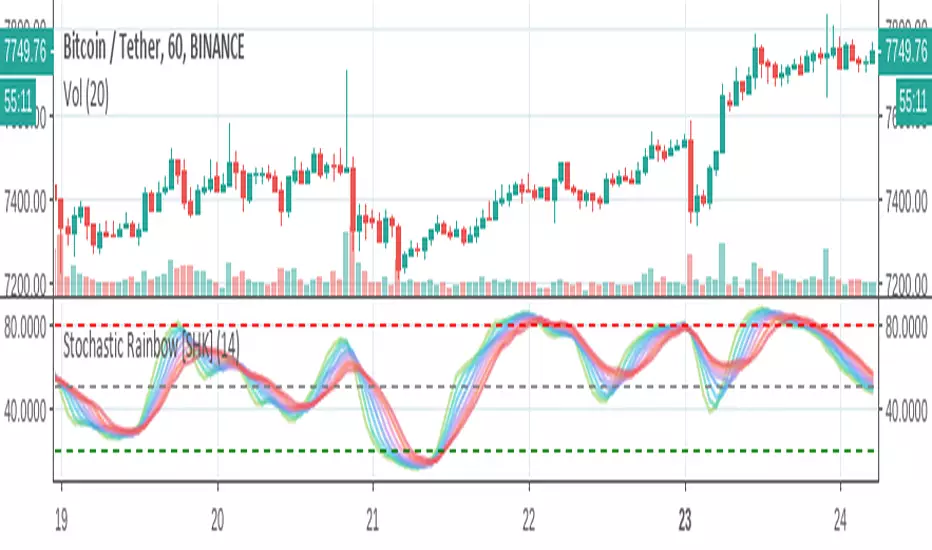
Stochastic Rainbow [SHK]Stochastic Rainbow consists of 8 stochastic oscillators with different speeds. So It has lower noises and better visualization comparing to simple stochastic.
I welcome comments, suggestions.
Stochastic CandlesIn this indicator I have transformed the %K line into adjustable candles. Because of this I have increased the length of the %D line to be more useful in this context. It is worth noting that you get the same momentum indication as %D set to 4 just because of the default candle transform setting. Incase you need to brush up on how stoch works here is the built in summery.
The Stochastic Oscillator (STOCH) is a range bound momentum oscillator. The Stochastic indicator is designed to display the location of the close compared to the high/low range over a user defined number of periods. Typically, the Stochastic Oscillator is used for three things; Identifying overbought and oversold levels, spotting divergences and also identifying bull and bear set ups or signals.

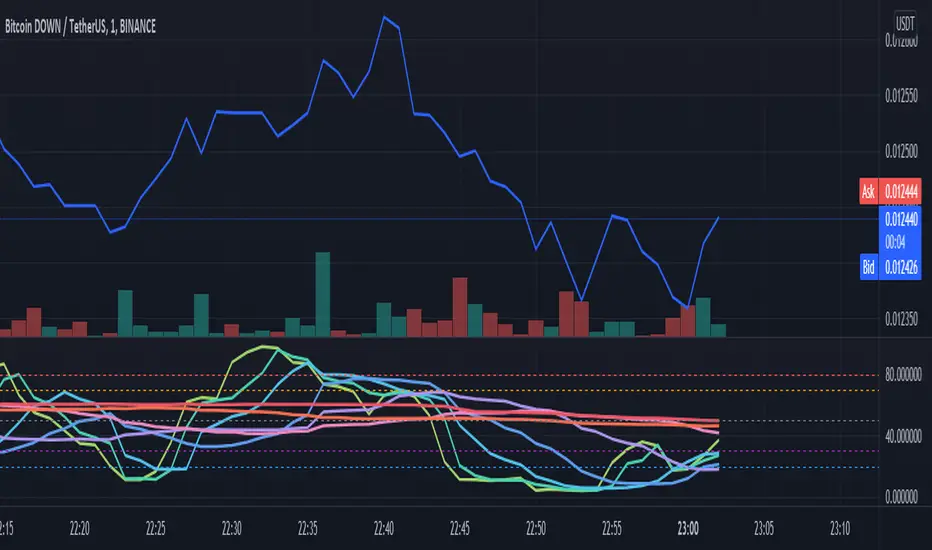
Stochastic RSI rainbow in fibonacci sequence using VWMAThe standard stochastic RSI gives limited information as it only contains two reference lines. This Stochastic RSI rainbow contains more lines in shorter timeframes and progressively fewer as the reference time increase. This is done in a FIB sequence 2,3,8,13,21,34,55.... The shorter timeframes are more reactive to current market conditions indicating recent price action and the longer lines represent more significant periods of time. The indicator uses VWMA for its calculations (volume weighted moving average)
HOW TO USE THIS INDICATOR:
When multiple lines are above, either 70 or 80, you can consider the commodity overbought, or OB. The more lines that are above the threshhold, the more significant the signal. The same is true in inverse. In addition, you can use each cross to signify a buy/sell signal according to the type and quantity of trading you are doing. If you are looking to get in and out quickly you can use the lower timeframe signals.
OPTIONS:
You can change what data is used for the VWMA calculation... Of course, you can select colors and other properties as well.
Stochastic MFIDue to some similarity of the Relative Strength Index(RSI) and Money Flow Index(MFI), I thought of creating a Stoch MFI inspired by the Stoch RSI.
- can be used similar to the Stoch RSI
- useful for pullback during trending markets and for S&R trading during ranging markets
TAYOR!

Stochastic [Gu5]To know if we are in range, I recommend my other indicator "Trend Channel Gu5"
Stochastic shows overbought / oversold
--
Para saber cuando no hay tendencia y estamos en rango, recomiendo usar mi indicador "Trend Channel Gu5"
El cruce de K & D nos muestra cundo el mercado esta en sobre-compra o sobre-venta
Las alertas con banderas ayudan a visualizar mas claramente, evitando las alertas duplicadas

Stochastic Momentum Index (SMI)Stochastic Momentum Index (SMI) or Stoch MTM is used to find oversold and overbought zones. It also helps to figureout whether to enter short trade or long trade.
Red Shade in the Top indicates that the stock is oversold and the Green shade in the bottom indicates overbought.
Strategy:
Enter Long once the Overbought Zone ended and there's a crossover below -35.
Exit Long once the oversold zone is ended and there's a crossover.
Enter Short once the oversold zone is ended and there's a crossover above 35.
Exit Short once the Overbought Zone ended and there's a crossover.
Backup: Always use with another indicator because there will be multiple up and down movement in one Trend.

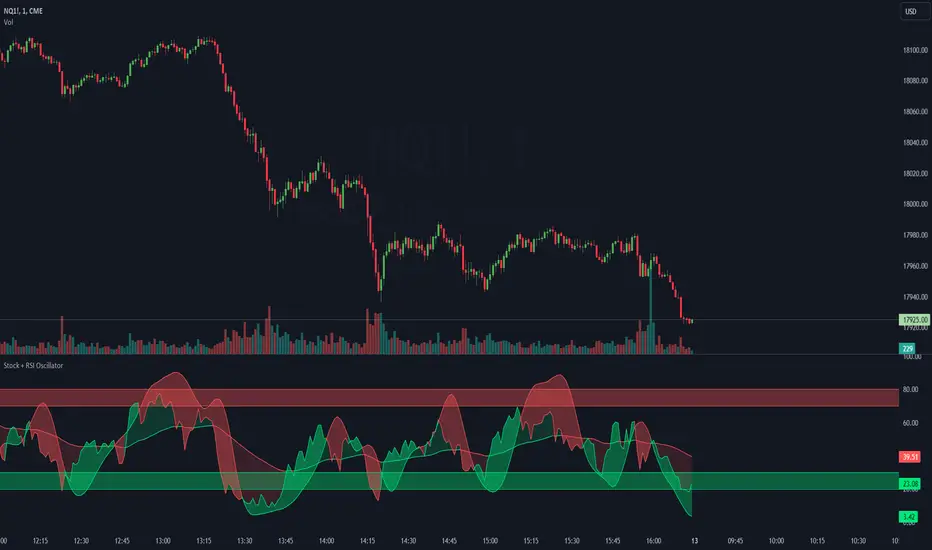
Stoch + RSI Oscillator @shrilssThis script combines two powerful indicators, the Stochastic Oscillator and the Relative Strength Index (RSI), to offer traders a comprehensive view of market dynamics.
The Stochastic Oscillator, known for its effectiveness in identifying overbought and oversold conditions, is enhanced here with a smoothing mechanism to provide clearer signals. The script calculates the %K and %D lines of the Stochastic Oscillator, then applies a smoothing factor to %K, resulting in a smoother representation of price momentum.
Simultaneously, the RSI component offers insights into the strength of price movements. By comparing the average gains and losses over a specified period, it provides a measure of bullish and bearish sentiment within the market.
This script's innovation lies in its integration of these two indicators. The Stochastic Oscillator's smoothed %K line and the RSI are compared to dynamic thresholds, enabling traders to identify potential trend reversals and confirmations more effectively. When the RSI crosses above or below the Stochastic %D line, it can signal potential shifts in market momentum.
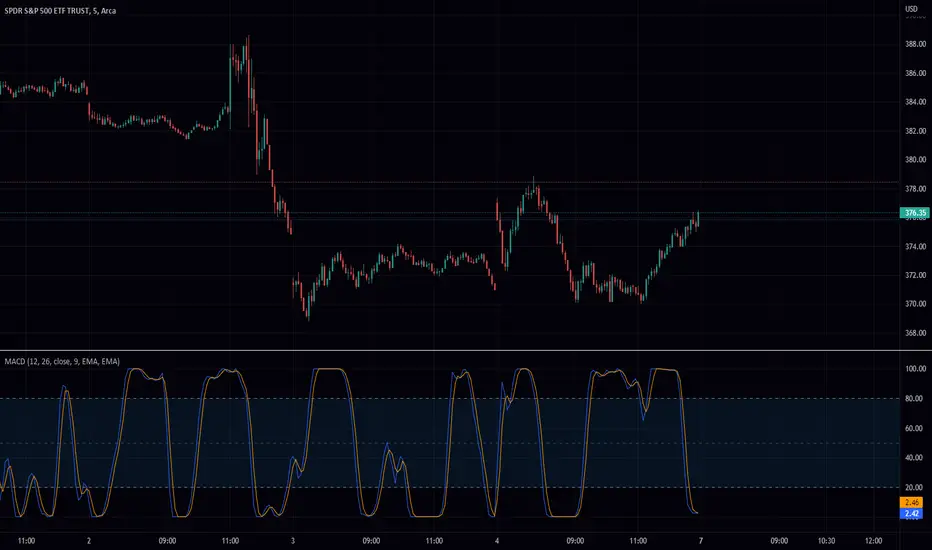
Stochastic Moving Average Convergence Divergence (SMACD)This is my attempt at making a Stochastic MACD indicator. To get this to work I have introduced a DC offset to the MACD histogram output. I figured that if theirs a Stochastic RSI their might as well be a Stochastic everything else! lmao enjoy. Honestly, from what I can tell it's even faster than Stochastic Smooth RSI.
The Stochastic Oscillator (STOCH) is a range bound momentum oscillator. The Stochastic indicator is designed to display the location of the close compared to the high/low range over a user defined number of periods. Typically, the Stochastic Oscillator is used for three things; Identifying overbought and oversold levels, spotting divergences and also identifying bull and bear set ups or signals
MACD is an extremely popular indicator used in technical analysis. MACD can be used to identify aspects of a security's overall trend. Most notably these aspects are momentum, as well as trend direction and duration. What makes MACD so informative is that it is actually the combination of two different types of indicators. First, MACD employs two Moving Averages of varying lengths (which are lagging indicators) to identify trend direction and duration. Then, MACD takes the difference in values between those two Moving Averages (MACD Line) and an EMA of those Moving Averages (Signal Line) and plots that difference between the two lines as a histogram which oscillates above and below a center Zero Line. The histogram is used as a good indication of a security's momentum
Stochastic RSI HeatmapStochastic RSI presented as a heatmap starting from the oversold (20) / overbought (80) levels respectively. The more oversold / overbought the price, the more intense the color (blue / fuchsia).

Stochastic Spread AnalyzerA comparative version of the previously published Stochastic Structure Analyzer. It incorporates the 3-TF stochastics against both price and OBV values of the spread.

Stochastic with Bollinger & EMAIn this script
I combined the various of the oscillator
Stochastic (STOCH) with BB (Bollinger Bands).
Each cut of K and D creates a mark (+) Red / green - accordingly.
As the Stochastic (K) crosses the BB base, a green / red point is formed accordingly.
As a sign it is possible to continue up / down.
I added EMA8 to K (style circles)
When the oscillator is above the EMA - it is possible that this is a clear sign of an increase.
Band 50 was also added to facilitate the calculations.
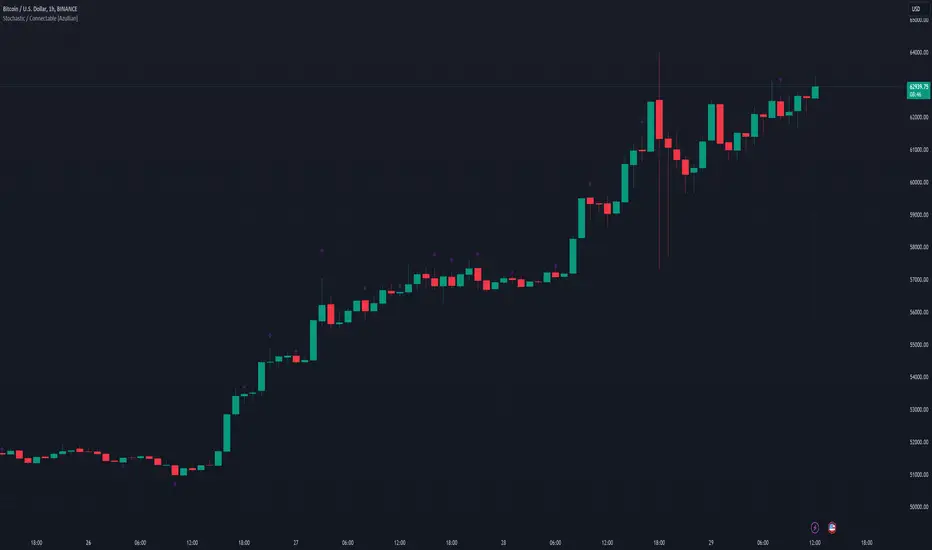
Stochastic / Connectable [Azullian]Advance your market analysis with the Stochastic Oscillator. Identify potential price reversals with precision, aiding in the creation of flexible and accurate strategies.
This connectable Stochastic indicator is part of an indicator system designed to help test, visualize and build strategy configurations without coding. Like all connectable indicators , it interacts through the TradingView input source, which serves as a signal connector to link indicators to each other. All connectable indicators send signal weight to the next node in the system until it reaches either a connectable signal monitor, signal filter and/or strategy.
█ UNIFORM SETTINGS AND A WAY OF WORK
Although connectable indicators may have specific weight scoring conditions, they all aim to follow a standardized general approach to weight scoring settings, as outlined below.
■ Connectable indicators - Settings
• 🗲 Energy: Energy applies an ATR multiplier to the plotted shapes on the chart. A higher value plots shapes farther away from the candle, enhancing visibility.
• ☼ Brightness: Brightness determines the opacity of the shape plotted on the chart, aiding visibility. Indicator weight also influences opacity.
• → Input: Use the input setting to specify a data source for the indicator. Here you can connect the indicator to other indicators.
• ⌥ Flow: Determine where you want to receive signals from:
○ Both: Weights from this indicator and the connected indicator will apply
○ Indicator only: Only weights from this indicator will apply
○ Input only: Only weights from the connected indicator will apply
• ⥅ Weight multiplier: Multiply all weights in the entire indicator by a given factor, useful for quickly testing different indicators in a granular setup.
• ⥇ Threshold: Set a threshold to indicate the minimum amount of weight it should receive to pass it through to the next indicator.
• ⥱ Limiter: Set a hard limit to the maximum amount of weight that can be fed through the indicator.
■ Connectable indicators - Weight scoring settings
▢ Weight scoring conditions
• SM – Signal mode: Enable specific conditions for weight scoring
○ All: All signals will be scored.
○ Entries only: Only entries will score.
○ Exits only: Only exits will score.
○ Entries & exits: Both entries and exits will score.
○ Zone: Continuous scoring for each candle within the zone.
• SP – Signal period: Defines a range of candles within which a signal can score.
• SC - Signal count: Specifies the number of bars to retrospectively examine and score.
○ Single: Score for a single occurrence
○ All occurrences: Score for all occurrences
○ Single + Threshold: Score for single occurrences within the signal period (SP)
○ Every + Threshold: Score for all occurrences within the signal period (SP)
▢ Weight scoring direction
• ES: Enter Short weight
• XL: Exit long weight
• EL: Enter Long weight
• XS: Exit Short weight
▢ Weight scoring values
• Weights can hold either positive or negative scores. Positive weights enhance a particular trading direction, while negative weights diminish it.
█ STOCHASTIC - INDICATOR SETTINGS
■ Main settings
• Enable/Disable Indicator: Toggle the entire indicator on or off.
• S - Source: Choose an alternative data source for the Stochastic calculation.
• T - Timeframe: Select an alternative timeframe for the Stochastic calculation.
• KL - %K Length: Define the number of bars or periods used in the calculation of the %K value.
• OB - Overbought Level: Determine the Stochastic value at which overbought conditions are met.
• OS - Oversold Level: Specify the Stochastic value at which oversold conditions are met.
• %K - %K Smoothing: DDefine the number of bars or periods used to smooth the %K value.
• %D - %D Smoothing: Define the number of bars or periods used to calculate and smooth the %D
■ Scoring functionality
• The Stochastic scores long entries when the %K line crosses above the %D line within the OS (oversold) area.
• The Stochastic scores long exits when the %K line crosses below the %D line after being in the OS (oversold) area.
• The Stochastic scores long zones for the duration the %K is above the %D line within the OS (oversold) area.
• The Stochastic scores short entries when the %K line crosses below the %D line within the OB (overbought) area.
• The Stochastic scores short exits when the %K line crosses above the %D line after being in the OB (overbought) area.
• The Stochastic scores short zones for the duration the %K is below the %D line within the OB (overbought) area.
█ PLOTTING
• Standard: Symbols (EL, XS, ES, XL) appear relative to candles based on set conditions. Their opacity and position vary with weight.
• Conditional Settings: A larger icon appears if global conditions are met. For instance, with a Threshold(⥇) of 12, Signal Period (SP) of 3, and Scoring Condition (SC) set to "EVERY", a Stochastic signaling over two times in 3 candles (scoring 6 each) triggers a larger icon.
█ USAGE OF CONNECTABLE INDICATORS
■ Connectable chaining mechanism
Connectable indicators can be connected directly to the signal monitor, signal filter or strategy , or they can be daisy chained to each other while the last indicator in the chain connects to the signal monitor, signal filter or strategy. When using a signal filter you can chain the filter to the strategy input to make your chain complete.
• Direct chaining: Connect an indicator directly to the signal monitor, signal filter or strategy through the provided inputs (→).
• Daisy chaining: Connect indicators using the indicator input (→). The first in a daisy chain should have a flow (⌥) set to 'Indicator only'. Subsequent indicators use 'Both' to pass the previous weight. The final indicator connects to the signal monitor, signal filter, or strategy.
■ Set up this indicator with a signal filter and strategy
The indicator provides visual cues based on signal conditions. However, its weight system is best utilized when paired with a connectable signal filter, signal monitor, or strategy .
Let's connect the Stochastic to a connectable signal filter and a strategy :
1. Load all relevant indicators
• Load Stochastic / Connectable
• Load Signal filter / Connectable
• Load Strategy / Connectable
2. Signal Filter: Connect the Stochastic to the Signal Filter
• Open the signal filter settings
• Choose one of the three input dropdowns (1→, 2→, 3→) and choose : Stochastic / Connectable: Signal Connector
• Toggle the enable box before the connected input to enable the incoming signal
3. Signal Filter: Update the filter signals settings if needed
• The default settings of the filter enable EL (Enter Long), XL (Exit Long), ES (Enter Short) and XS (Exit Short).
4. Signal Filter: Update the weight threshold settings if needed
• All connectable indicators load by default with a score of 6 for each direction (EL, XL, ES, XS)
• By default, weight threshold (TH) is set at 5. This allows each occurrence to score, as the default score in each connectable indicator is 1 point above the threshold. Adjust to your liking.
5. Strategy: Connect the strategy to the signal filter in the strategy settings
• Select a strategy input → and select the Signal filter: Signal connector
6. Strategy: Enable filter compatible directions
• Set the signal mode of the strategy to a compatible direction with the signal filter.
Now that everything is connected, you'll notice green spikes in the signal filter representing long signals, and red spikes indicating short signals. Trades will also appear on the chart, complemented by a performance overview. Your journey is just beginning: delve into different scoring mechanisms, merge diverse connectable indicators, and craft unique chains. Instantly test your results and discover the potential of your configurations. Dive deep and enjoy the process!
█ BENEFITS
• Adaptable Modular Design: Arrange indicators in diverse structures via direct or daisy chaining, allowing tailored configurations to align with your analysis approach.
• Streamlined Backtesting: Simplify the iterative process of testing and adjusting combinations, facilitating a smoother exploration of potential setups.
• Intuitive Interface: Navigate TradingView with added ease. Integrate desired indicators, adjust settings, and establish alerts without delving into complex code.
• Signal Weight Precision: Leverage granular weight allocation among signals, offering a deeper layer of customization in strategy formulation.
• Advanced Signal Filtering: Define entry and exit conditions with more clarity, granting an added layer of strategy precision.
• Clear Visual Feedback: Distinct visual signals and cues enhance the readability of charts, promoting informed decision-making.
• Standardized Defaults: Indicators are equipped with universally recognized preset settings, ensuring consistency in initial setups across different types like momentum or volatility.
• Reliability: Our indicators are meticulously developed to prevent repainting. We strictly adhere to TradingView's coding conventions, ensuring our code is both performant and clean.
█ COMPATIBLE INDICATORS
Each indicator that incorporates our open-source 'azLibConnector' library and adheres to our conventions can be effortlessly integrated and used as detailed above.
For clarity and recognition within the TradingView platform, we append the suffix ' / Connectable' to every compatible indicator.
█ COMMON MISTAKES, CLARIFICATIONS AND TIPS
• Removing an indicator from a chain: Deleting a linked indicator and confirming the "remove study tree" alert will also remove all underlying indicators in the object tree. Before removing one, disconnect the adjacent indicators and move it to the object stack's bottom.
• Point systems: The azLibConnector provides 500 points for each direction (EL: Enter long, XL: Exit long, ES: Enter short, XS: Exit short) Remember this cap when devising a point structure.
• Flow misconfiguration: In daisy chains the first indicator should always have a flow (⌥) setting of 'indicator only' while other indicator should have a flow (⌥) setting of 'both'.
• Hide attributes: As connectable indicators send through quite some information you'll notice all the arguments are taking up some screenwidth and cause some visual clutter. You can disable arguments in Chart Settings / Status line.
• Layout and abbreviations: To maintain a consistent structure, we use abbreviations for each input. While this may initially seem complex, you'll quickly become familiar with them. Each abbreviation is also explained in the inline tooltips.
• Inputs: Connecting a connectable indicator directly to the strategy delivers the raw signal without a weight threshold, meaning every signal will trigger a trade.
█ A NOTE OF GRATITUDE
Through years of exploring TradingView and Pine Script, we've drawn immense inspiration from the community's knowledge and innovation. Thank you for being a constant source of motivation and insight.
█ RISK DISCLAIMER
Azullian's content, tools, scripts, articles, and educational offerings are presented purely for educational and informational uses. Please be aware that past performance should not be considered a predictor of future results.