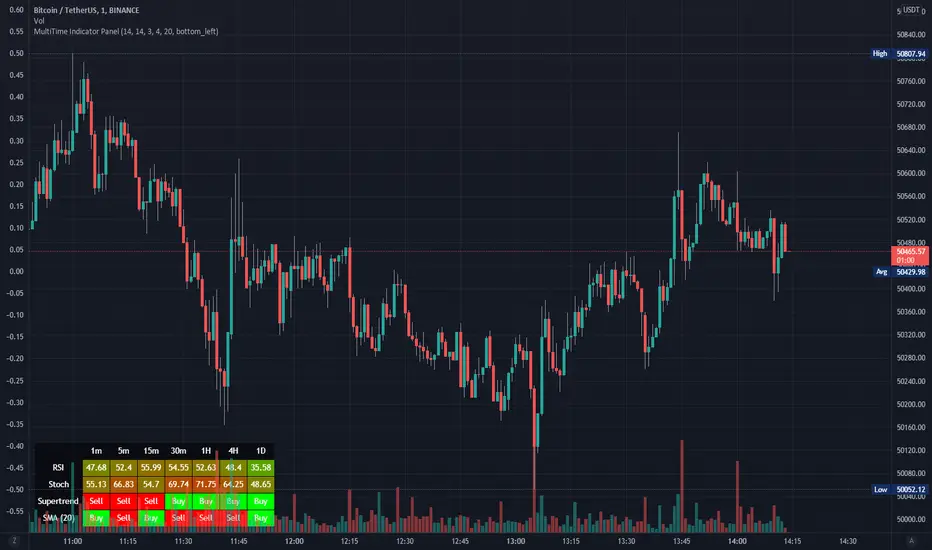
Multi TF Oscillators Screener [TradingFinder] RSI / ATR / Stoch🔵 Introduction
The oscillator screener is designed to simplify multi-timeframe analysis by allowing traders and analysts to monitor one or multiple symbols across their preferred timeframes—all at the same time. Users can track a single symbol through various timeframes simultaneously or follow multiple symbols in selected intervals. This flexibility makes the tool highly effective for analyzing diverse markets concurrently.
At the core of this screener lie two essential oscillators: RSI (Relative Strength Index) and the Stochastic Oscillator. The RSI measures the speed and magnitude of recent price movements and helps identify overbought or oversold conditions.
It's one of the most reliable indicators for spotting potential reversals. The Stochastic Oscillator, on the other hand, compares the current price to recent highs and lows to detect momentum strength and potential trend shifts. It’s especially effective in identifying divergences and short-term reversal signals.
In addition to these two primary indicators, the screener also displays helpful supplementary data such as the dominant candlestick type (Bullish, Bearish, or Doji), market volatility indicators like ATR and TR, and the four key OHLC prices (Open, High, Low, Close) for each symbol and timeframe. This combination of data gives users a comprehensive technical view and allows for quick, side-by-side comparison of symbols and timeframes.
🔵 How to Use
This tool is built for users who want to view the behavior of a single symbol across several timeframes simultaneously. Instead of jumping between charts, users can quickly grasp the state of a symbol like gold or Bitcoin across the 15-minute, 1-hour, and daily timeframes at a glance. This is particularly useful for traders who rely on multi-timeframe confirmation to strengthen their analysis and decision-making.
The tool also supports simultaneous monitoring of multiple symbols. Users can select and track various assets based on the timeframes that matter most to them. For example, if you’re looking for entry opportunities, the screener allows you to compare setups across several markets side by side—making it easier to choose the most favorable trade. Whether you’re a scalper focused on low timeframes or a swing trader using higher ones, the tool adapts to your workflow.
The screener utilizes the widely-used RSI indicator, which ranges from 0 to 100 and highlights market exhaustion levels. Readings above 70 typically indicate potential pullbacks, while values below 30 may suggest bullish reversals. Viewing RSI across timeframes can reveal meaningful divergences or alignments that improve signal quality.
Another key indicator in the screener is the Stochastic Oscillator, which analyzes the closing price relative to its recent high-low range. When the %K and %D lines converge and cross within the overbought or oversold zones, it often signals a momentum reversal. This oscillator is especially responsive in lower timeframes, making it ideal for spotting quick entries or exits.
Beyond these oscillators, the table includes other valuable data such as candlestick type (bullish, bearish, or doji), volatility measures like ATR and TR, and complete OHLC pricing. This layered approach helps users understand both market momentum and structure at a glance.
Ultimately, this screener allows analysts and traders to gain a full market overview with just one look—empowering faster, more informed, and lower-risk decision-making. It not only saves time but also enhances the precision and clarity of technical analysis.
🔵 Settings
🟣 Display Settings
Table Size : Lets you adjust the table’s visual size with options such as: auto, tiny, small, normal, large, huge.
Table Position : Sets the screen location of the table. Choose from 9 possible positions, combining vertical (top, middle, bottom) and horizontal (left, center, right) alignments.
🟣 Symbol Settings
Each of the 10 symbol slots comes with a full set of customizable parameters :
Enable Symbol : A checkbox to activate or hide each symbol from the table.
Symbol : Define or select the asset (e.g., XAUUSD, BTCUSD, EURUSD, etc.).
Timeframe : Set your desired timeframe for each symbol (e.g., 15, 60, 240, 1D).
RSI Length : Defines the period used in RSI calculation (default is 14).
Stochastic Length : Sets the period for the Stochastic Oscillator.
ATR Length : Sets the length used to calculate the Average True Range, a key volatility metric.
🔵 Conclusion
By combining powerful oscillators like RSI and Stochastic with full customization over symbols and timeframes, this tool provides a fast, flexible solution for technical analysts. Users can instantly monitor one or several assets across multiple timeframes without opening separate charts.
Individual configuration for each symbol, along with the inclusion of key metrics like candlestick type, ATR/TR, and OHLC prices, makes the tool suitable for a wide range of trading styles—from scalping to swing and position trading.
In summary, this screener enables traders to gain a clear, high-level view of various markets in seconds and make quicker, smarter, and lower-risk decisions. It saves time, streamlines analysis, and boosts overall efficiency and confidence in trading strategies.
스크립트에서 "stoch"에 대해 찾기

JCipher Stochastic RSI Crossover AlertsCustom indicator to plot the stochastic RSI and print a highlighting bar to indicate when the fast signal curve crosses the slower one from underneath (crossover), to indicate a bullish trend change.
Merge Of RSI & Stochastic RSI [salar88]This Indicator Include Stochastic RSI And Multiple Time Frame RSI
I Wish Its gonna useful for tradingview users

DiNapoli MACD & Stoch [LazyBear] --- Updated: May 19 2015 ----
Applicable only If you are setting up alerts:
I noticed I have switched the plot names. Histo shd be the MACD and DMACD shd be the Signal.
Replace lines 16 & 17 with these to get the correct names. NOTE that no functionality is affected, just the names.
plot(r, style=columns, color=r>0?green:red, transp=80, title="Dinapoli MACD")
plot(s, color=teal, linewidth=2, title="Trigger")
--- Original Description ---
These two indicators are from one of my favorite books - DiNapoli's Levels. These are custom MACD and Stoch used by him. There are more indicators - Detrended Osc, DisplacedMA - that he uses, will publish them all later.
The settings of normal MACD/Stoch can be tuned to obtain these DiNapoli indicators, or if you are lazy (like me!) just use these :)
DiNapoli Preferred Stoch source: pastebin.com
More info:
www.amazon.com
List of my public indicators: bit.ly
List of my app-store indicators: blog.tradingview.com

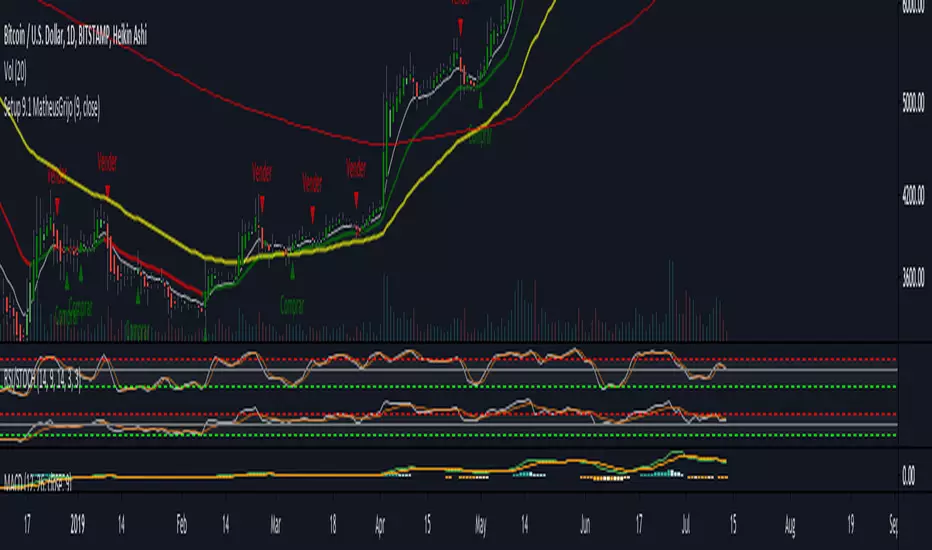
SMA+MACD+RSI+Stoch Entry📌 Tools Used:
• SMA 21, SMA 50, SMA 200
• MACD (12, 26, 9)
• Pivot Point Standard
• RSI (length 75)
• Stochastic (14, 3, 3)
Trading Timeframe:
• Usable on all timeframes
Chart Preparation:
• Analyze the overall market trend and the instrument being traded
• Set an appropriate timeframe according to the market
• Apply SMA 21, SMA 50, SMA 200
• Apply MACD and Pivot Point Standard
• Ensure a proper market trend by checking the position of SMA 21, SMA 50, and SMA 200 relative to each other
If there are too many crossings between SMA 21, SMA 50, and SMA 200, do not enter any trades until the market trend stabilizes
Conditions for Entering a Long Trade (Bullish Trigger):
• Candle closes above the pivot line
• Confirm an uptrend by checking that SMA 21 is above SMA 50, and SMA 50 is above SMA 200
• RSI is above the midpoint
• Presence of a suitable corrective step with normal slope, considering the strength of the previous step
• MACD histogram indicates bullish momentum
• Stochastic shows a bullish crossover from below
Conditions for Entering a Short Trade (Bearish Trigger):
• Candle closes below the pivot line
• Confirm a downtrend by checking that SMA 21 is below SMA 50, and SMA 50 is below SMA 200
• RSI is below the midpoint
• Presence of a suitable corrective step with normal slope, considering the strength of the previous step
• MACD histogram indicates bearish momentum
• Stochastic shows a bearish crossover from above

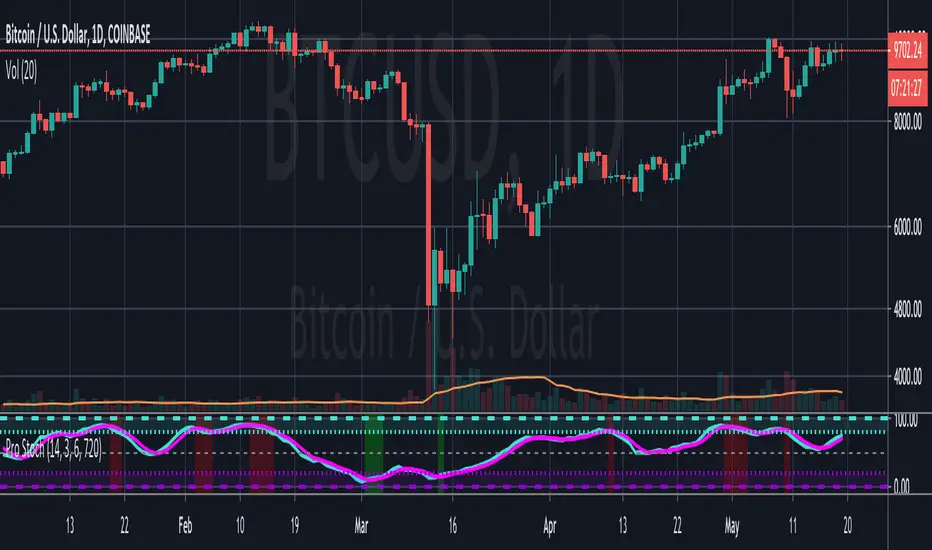
Pro StochasticsMy take on coding a Stochastic Indicator for professional use.
Contains many options and settings for you to tweak, and can be used on different timeframes.
I've also decided to make the code Open to all to use.
But it would be great if you credit me when you use my code. :)
Scott's MTF: RSI with ema and stochasticI made this for backtesting the 1 hour TF where I am more interested in 4 hour stochastic and RSI than the default 1 hour stoch and RSI.

Godmode StochasticGodmode Stochastic oscillator that can be used as alternative to Stoch RSI, since imho it better tracks price movements.

FM RSI Vs StochEasy to use RSI and Stoch
Setting Menu has an option to toggle the RSI and Stoch ON and OFF for your own preference.
Great for reducing clutter when comparing oscillators, while giving the ease of use to just click the toggle option instead of having to find and reset your indicator settings.
Colour schemes adjustable in Settings Menu for personal taste.
RSI AND SMOOTHED STOCH RSI TOGETHERi dont know pine script but here i used some free ones and merged them and modified some
especially smoothed stoch rsi is Good to decide when buy coz i modified it and when fast K value is over D value it changes color
visually better this way
also rsi is shown as area o histogram but if u dont like u can change to line
for stoch rsi i unclick xtrigger (d value) for better appearance

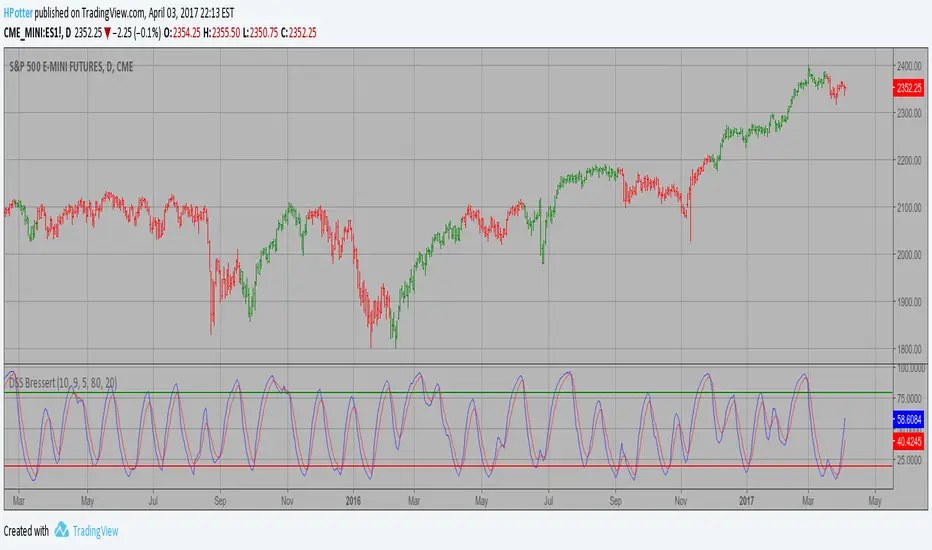
DSS Bressert (Double Smoothed Stochastic) Strategy Double Smoothed Stochastics (DSS) is designed by William Blaw.
It attempts to combine moving average methods with oscillator principles.
Candlestick Patterns With EMA and Stochastic6/11/15, Corrected barcolor errors.
Candlestick patterns identified and color coded according to position above or below 8EMA(TLine).
Special thanks to repo32, DavidR, and Chris Moody for coding ideas.
Bullish candlestick buy signals have a greater probability of success when Stochastics are oversold. Bearish ones have a
greater probability of success when overbought. Stack as many factors in your favor as possible. A candlestick signal by itself is of little value unless you apply additional information with it. An 8 EMA is coded also to help with buy/sell signals. Some of the videos by Steven Bigalow are on the Web to see how he uses it.
www.youtube.com
Regardless of systems and strategies used, make your second trade first: Know when you're going to exit. Risk management rules. Good luck and good trading.


RSI & Stoch MultiTimeThis indicator renders a table with 2 rows and 7 columns displaying the values of RSI and Stoch over different time periods. This works best on 1m charts due to a bug with the time periods I haven't yet solved.

My Script with stoch and bb
I created a script to buy / sell when stoch oversold, overbought and BB when the price is above the upper BB and falls below it.
I want to combine with rsi but I do not know how to do it
and I want to put SL to avoid the trap of market.
Do you have any way to help me optimize the scirpt?

3 in 1 (BB, Stoch ,rsi) with alert On the chart there are the BB with purple and green circles to give the entry signal once the price has come back in the bands.The background alert appair when BOTH RSI and STOCH are in overbuy or oversell. the defalt is 20/80 but can set it by yourself.

5 in 1 (rsi,aroon,stoch,macd,adx di)5 indicators in 1.
You can choose wich one you want to see (rsi ,aroon,macd,stoch or adx di)
Usefull to save space for other indicators