Richard Carey - Crypto Appropriate EWMACA crypto appropriate EWMAC with variable MA types and Fast/Slow Periods.
스크립트에서 "crypto"에 대해 찾기

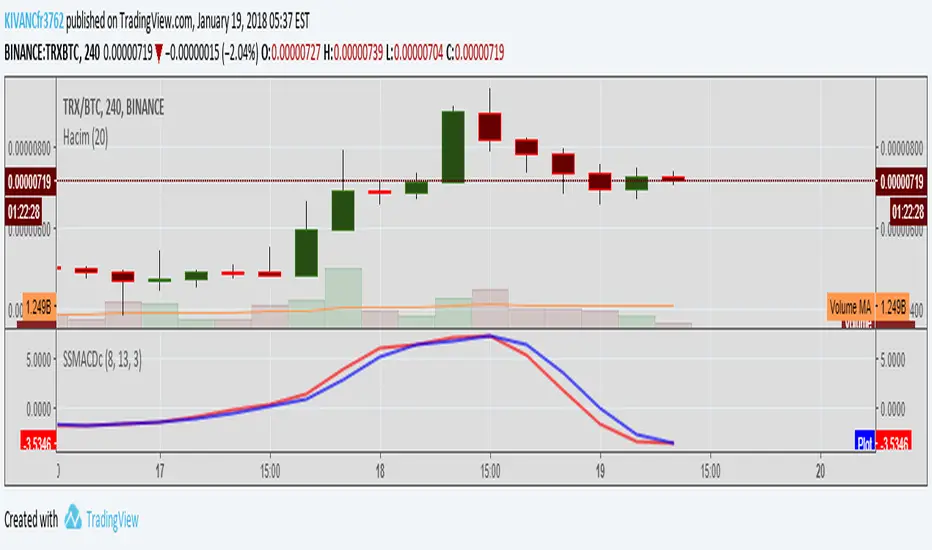
Super Smoothed MACD for CRYPTO by KIVANÇ fr3762THIS INDICATOR IS DESIGNED USING EHLERS' SUPER SMOOTHER FILTER
DESIGNED FOR CRYPTO TRADE
(another version available for stocks also: Super Smoothed MACD for STOCKS by KIVANÇ fr3762)
Instead of EXPONENTIAL MOVING AVERAGES in traditional MACD calculation, Super Smoothed prices are used.
The default values of BAND EDGE's (periods) of these Super Smoothed Prices are 13,8, and 5 (Fibonacci numbers) which pretty work well for daily trade
users can change these values 13,8,3 or 21,13,5 or 21,13,8 and so on to have optimum trade productivity

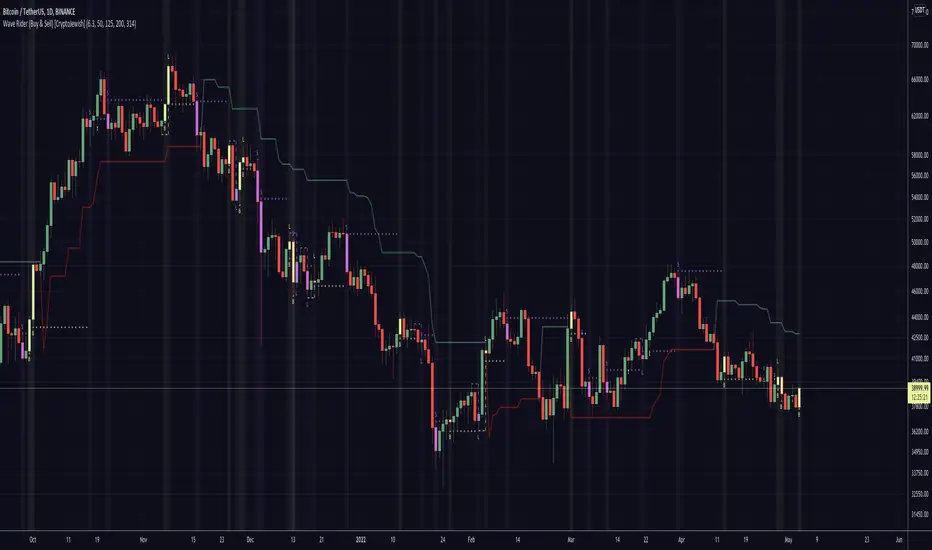
Buy + Sell [CryptoJewish]Beta
This indicator helps identify areas of buying and selling.
There are 4 levels of signals.
1. Weak
2. Medium
3. Strong
4. Extremely strong
Also there is a lagging indicator, which gives a signal of the 2nd level.
Levels greater than 1 are highlighted with a background and the color of the last bar is mixed with the color of the signal.
Almost everything can be turned on / off.
---
Additionally included:
- Ichimoku Cloud with settings for crypto (pure cloud, no extra lines)
- Bollinger Bands
- 4x SMA with a cross between them
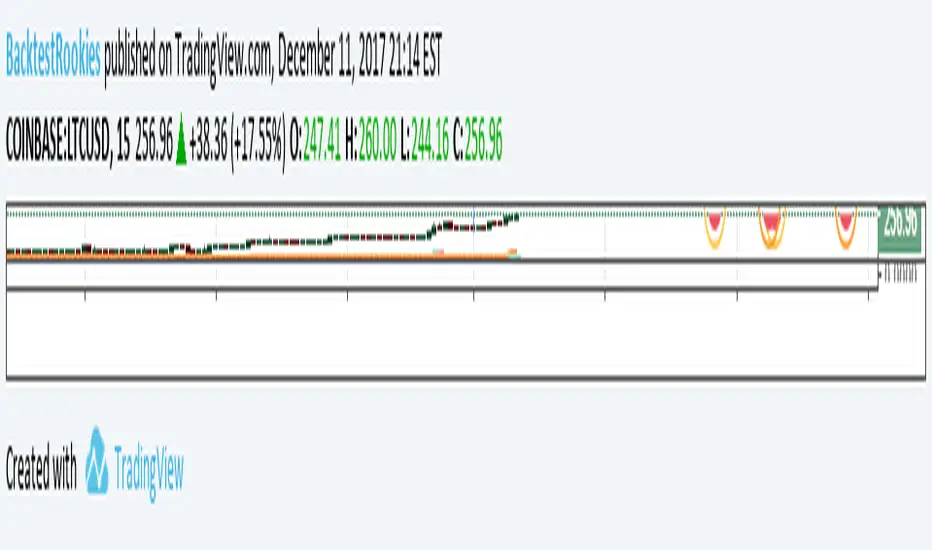
Default Strategy Inputs (Forex / Crypto)The code in this post contains a set of default strategy inputs I use in new projects / backtests in Tradingview.
Full code commentary is available on the Backtest-Rookies website. To comply with house rules, I cannot post the direct link here.
Features
Trade Direction: So that you can limit the strategy for long only, short only or trade in both directions. It is important to note that when you select “Long Only”, you will still see Short signals on the chart. However, they are only used to close a position rather than reverse it. This is the default behaviour for strategies. The same applies to “Short Only”.
Date Ranges: So that you can isolate backtesting to specific periods of interest such as bull or bear markets.
Sessions: So you can easily get an idea of the expected results during your own session. You may also notice that performance of the strategy varies depending on which session it is deployed in.
Some example stop losses: It is not an exhaustive list but it should be enough to provide some inspiration for different types of stops that you can experiment with.
Happy Scripting. I hope the community finds it useful.
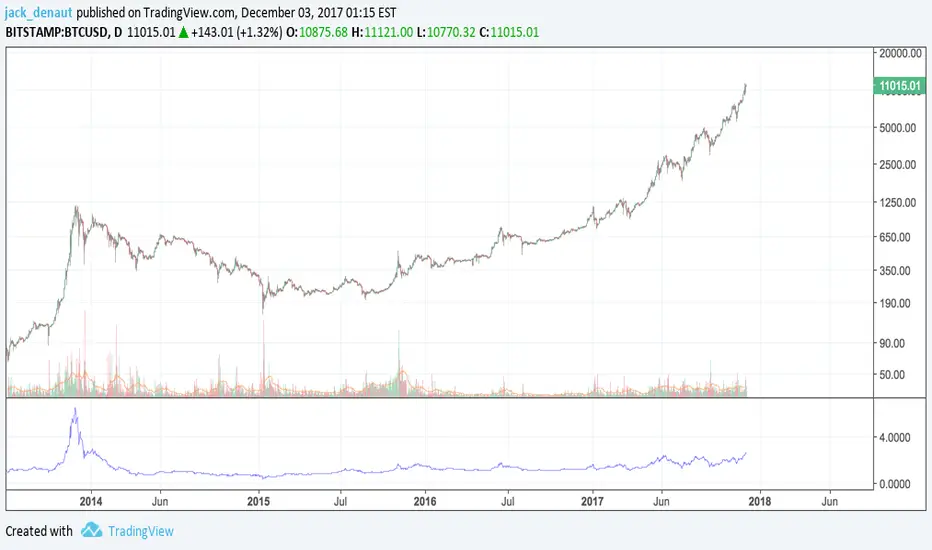
Bitcoin MultipleMultiple of Bitcoin over the 200 day average.
Inspired from: www.theinvestorspodcast.com
DepthHouse-MaxADXDepthHouse's MaxADX is 1 of 3 indicators that will be available for purchase via subscription come Jan 2018.
This indicator combines the use of directional information and smoothed moving averages to help traders indicate trend reversals and strengthening trends. As you can see in the chart above this indicator makes it very easy to spot trend reversals in trending markets.
Where this indicator falls short unfortunately, is its use in ranging markets.
This is a great indicator for all beginners and professionals who prefer to trade in volatile markets such as cryptocurrencies.
This indicator package will come with 3 indicators:
MaxADX
Premium oscillator to help spot forming trends and reversals.
MaxADX Signals
Taking MaxADX a step farther by creating an overlay that show possible trend strengthening and reversals via bar colors and shapes.
ATRBands
Like Bollinger Bands, this indicator is uses to help spot breakouts, and overbought/sold areas.
How to get:
To qualify for the trial period which ends January, 1st 2018, please go to the link in my bio and click subscribe!
You will then be sent directions for your account to be added to the whitelist.


Holy Grail indicator (possibly) Version 2This is a continuation of the previous (possible) Holy Grail script. This is designed for forex and crypto trading.
The when the price crosses over a line it is a buy/sell signal. When the price crosses the blue area it is a great opportunity to ride the momentum, although quite risky. It is good to follow this in periods of high volume where the smallest trends can be caught. When the price crosses the pink area it is a little less risky than the blue area, but also doesn't catch every wave. When the price crosses back into the blue area it is a good signal that the small trend may be reversing, which also applies to the pink area. Although the pink area provides a little more certainty
The large red line provides the most stable entry points. For everyone that keeps asking, the backtests of the red line are generally very good, it lets profits ride and has almost nonexistent drawdowns. I would be interested in automating it, but it will enter and exit a position way too many times in certain circumstances creating an issue with fees.
The thin purple line shows the general trend. It reacts too slowly to give entry and exit points, but it may be helpful to watch it's behavior. Feel free to message me with any questions, ideas, or interests in collaborations in automated trading.
Cheers

The best Holy Grail indicator (currently)These have been optimized for the cryptocurrency markets, but also seems to work really well in commodities, futures, and forex. A crossover with the closing is treated as a buy or sell signal. The 4 lines provided have different sensitivities and therefore can be treated in combination or separately. This seems to be highly effective in trending markets as a trend follower, and in a ranging market the signals can pretty reliably be reversed for profit. I made this code private because it is still a work in progress and I am interested in hearing people's thoughts and experiences with it for further developments. This is well on the way to becoming a holy grail!
All the best, happy trading
-mcbw_

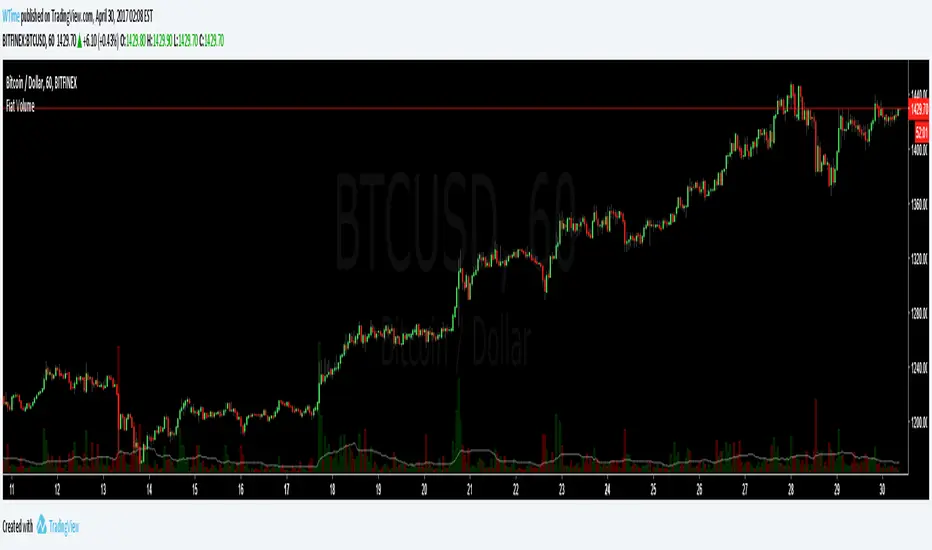
Fiat Denominated VolumeUseful for cryptocurrencies, where price swings often makes crypto denominated volume meaningless.
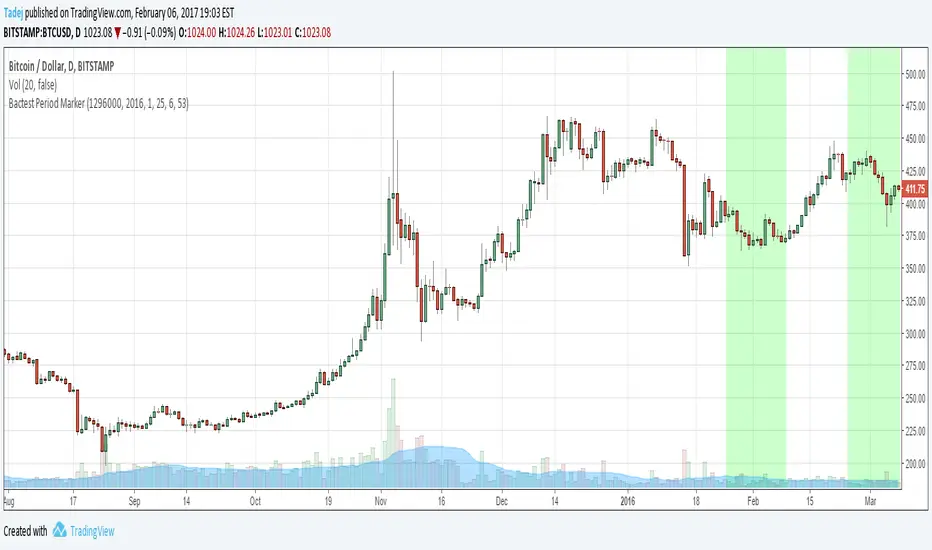
Bactest Period MarkerSimple script that will mark backtest periods (if you have to run backtests in multiple parts, like on CryptoTrader )
MACD Liquidity Tracker Strategy [Quant Trading]MACD Liquidity Tracker Strategy
Overview
The MACD Liquidity Tracker Strategy is an enhanced trading system that transforms the traditional MACD indicator into a comprehensive momentum-based strategy with advanced visual signals and risk management. This strategy builds upon the original MACD Liquidity Tracker System indicator by TheNeWSystemLqtyTrckr , converting it into a fully automated trading strategy with improved parameters and additional features.
What Makes This Strategy Original
This strategy significantly enhances the basic MACD approach by introducing:
Four distinct system types for different market conditions and trading styles
Advanced color-coded histogram visualization with four dynamic colors showing momentum strength and direction
Integrated trend filtering using 9 different moving average types
Comprehensive risk management with customizable stop-loss and take-profit levels
Multiple alert systems for entry signals, exits, and trend conditions
Flexible signal display options with customizable entry markers
How It Works
Core MACD Calculation
The strategy uses a fully customizable MACD configuration with traditional default parameters:
Fast MA : 12 periods (customizable, minimum 1, no maximum limit)
Slow MA : 26 periods (customizable, minimum 1, no maximum limit)
Signal Line : 9 periods (customizable, now properly implemented and used)
Cryptocurrency Optimization : The strategy's flexible parameter system allows for significant optimization across different crypto assets. Traditional MACD settings (12/26/9) often generate excessive noise and false signals in volatile crypto markets. By using slower, more smoothed parameters, traders can capture meaningful momentum shifts while filtering out market noise.
Example - DOGE Optimization (45/80/290 settings) :
• Performance : Optimized parameters yielding exceptional backtesting results with 29,800% PnL
• Why it works : DOGE's high volatility and social sentiment-driven price action benefits from heavily smoothed indicators
• Timeframes : Particularly effective on 30-minute and 4-hour charts for swing trading
• Logic : The very slow parameters filter out noise and capture only the most significant trend changes
Other Optimizable Cryptocurrencies : This parameter flexibility makes the strategy highly effective for major altcoins including SUI, SEI, LINK, Solana (SOL) , and many others. Each crypto asset can benefit from custom parameter tuning based on its unique volatility profile and trading characteristics.
Four Trading System Types
1. Normal System (Default)
Long signals : When MACD line is above the signal line
Short signals : When MACD line is below the signal line
Best for : Swing trading and capturing longer-term trends in stable markets
Logic : Traditional MACD crossover approach using the signal line
2. Fast System
Long signals : Bright Blue OR Dark Magenta (transparent) histogram colors
Short signals : Dark Blue (transparent) OR Bright Magenta histogram colors
Best for : Scalping and high-volatility markets (crypto, forex)
Logic : Leverages early momentum shifts based on histogram color changes
3. Safe System
Long signals : Only Bright Blue histogram color (strongest bullish momentum)
Short signals : All other colors (Dark Blue, Bright Magenta, Dark Magenta)
Best for : Risk-averse traders and choppy markets
Logic : Prioritizes only the strongest bullish signals while treating everything else as bearish
4. Crossover System
Long signals : MACD line crosses above signal line
Short signals : MACD line crosses below signal line
Best for : Precise timing entries with traditional MACD methodology
Logic : Pure crossover signals for more precise entry timing
Color-Coded Histogram Logic
The strategy uses four distinct colors to visualize momentum:
🔹 Bright Blue : MACD > 0 and rising (strong bullish momentum)
🔹 Dark Blue (Transparent) : MACD > 0 but falling (weakening bullish momentum)
🔹 Bright Magenta : MACD < 0 and falling (strong bearish momentum)
🔹 Dark Magenta (Transparent) : MACD < 0 but rising (weakening bearish momentum)
Trend Filter Integration
The strategy includes an advanced trend filter using 9 different moving average types:
SMA (Simple Moving Average)
EMA (Exponential Moving Average) - Default
WMA (Weighted Moving Average)
HMA (Hull Moving Average)
RMA (Running Moving Average)
LSMA (Least Squares Moving Average)
DEMA (Double Exponential Moving Average)
TEMA (Triple Exponential Moving Average)
VIDYA (Variable Index Dynamic Average)
Default Settings : 50-period EMA for trend identification
Visual Signal System
Entry Markers : Blue triangles (▲) below candles for long entries, Magenta triangles (▼) above candles for short entries
Candle Coloring : Price candles change color based on active signals (Blue = Long, Magenta = Short)
Signal Text : Optional "Long" or "Short" text inside entry triangles (toggleable)
Trend MA : Gray line plotted on main chart for trend reference
Parameter Optimization Examples
DOGE Trading Success (Optimized Parameters) :
Using 45/80/290 MACD settings with 50-period EMA trend filter has shown exceptional results on DOGE:
Performance : Backtesting results showing 29,800% PnL demonstrate the power of proper parameter optimization
Reasoning : DOGE's meme-driven volatility and social sentiment spikes create significant noise with traditional MACD settings
Solution : Very slow parameters (45/80/290) filter out social media-driven price spikes while capturing only major momentum shifts
Optimal Timeframes : 30-minute and 4-hour charts for swing trading opportunities
Result : Exceptionally clean signals with minimal false entries during DOGE's characteristic pump-and-dump cycles
Multi-Crypto Adaptability :
The same optimization principles apply to other major cryptocurrencies:
SUI : Benefits from smoothed parameters due to newer coin volatility patterns
SEI : Requires adjustment for its unique DeFi-related price movements
LINK : Oracle news events create price spikes that benefit from noise filtering
Solana (SOL) : Network congestion events and ecosystem developments need smoothed detection
General Rule : Higher volatility coins typically benefit from very slow MACD parameters (40-50 / 70-90 / 250-300 ranges)
Key Input Parameters
System Type : Choose between Fast, Normal, Safe, or Crossover (Default: Normal)
MACD Fast MA : 12 periods default (no maximum limit, consider 40-50 for crypto optimization)
MACD Slow MA : 26 periods default (no maximum limit, consider 70-90 for crypto optimization)
MACD Signal MA : 9 periods default (now properly utilized, consider 250-300 for crypto optimization)
Trend MA Type : EMA default (9 options available)
Trend MA Length : 50 periods default (no maximum limit)
Signal Display : Both, Long Only, Short Only, or None
Show Signal Text : True/False toggle for entry marker text
Trading Applications
Recommended Use Cases
Momentum Trading : Capitalize on strong directional moves using the color-coded system
Trend Following : Combine MACD signals with trend MA filter for higher probability trades
Scalping : Use "Fast" system type for quick entries in volatile markets
Swing Trading : Use "Normal" or "Safe" system types for longer-term positions
Cryptocurrency Trading : Optimize parameters for individual crypto assets (e.g., 45/80/290 for DOGE, custom settings for SUI, SEI, LINK, SOL)
Market Suitability
Volatile Markets : Forex, crypto, indices (recommend "Fast" system or smoothed parameters)
Stable Markets : Stocks, ETFs (recommend "Normal" or "Safe" system)
All Timeframes : Effective from 1-minute charts to daily charts
Crypto Optimization : Each major cryptocurrency (DOGE, SUI, SEI, LINK, SOL, etc.) can benefit from custom parameter tuning. Consider slower MACD parameters for noise reduction in volatile crypto markets
Alert System
The strategy provides comprehensive alerts for:
Entry Signals : Long and short entry triangle appearances
Exit Signals : Position exit notifications
Color Changes : Individual histogram color alerts
Trend Conditions : Price above/below trend MA alerts
Strategy Parameters
Default Settings
Initial Capital : $1,000
Position Size : 100% of equity
Commission : 0.1%
Slippage : 3 points
Date Range : January 1, 2018 to December 31, 2069
Risk Management (Optional)
Stop Loss : Disabled by default (customizable percentage-based)
Take Profit : Disabled by default (customizable percentage-based)
Short Trades : Disabled by default (can be enabled)
Important Notes and Limitations
Backtesting Considerations
Uses realistic commission (0.1%) and slippage (3 points)
Default position sizing uses 100% equity - adjust based on risk tolerance
Stop-loss and take-profit are disabled by default to show raw strategy performance
Strategy does not use lookahead bias or future data
Risk Warnings
Past performance does not guarantee future results
MACD-based strategies may produce false signals in ranging markets
Consider combining with additional confluences like support/resistance levels
Test thoroughly on demo accounts before live trading
Adjust position sizing based on your risk management requirements
Technical Limitations
Strategy does not work on non-standard chart types (Heikin Ashi, Renko, etc.)
Signals are based on close prices and may not reflect intraday price action
Multiple rapid signals in volatile conditions may result in overtrading
Credits and Attribution
This strategy is based on the original "MACD Liquidity Tracker System" indicator created by TheNeWSystemLqtyTrckr . This strategy version includes significant enhancements:
Complete strategy implementation with entry/exit logic
Addition of the "Crossover" system type
Proper implementation and utilization of the MACD signal line
Enhanced risk management features
Improved parameter flexibility with no artificial maximum limits
Additional alert systems for comprehensive trade management
The original indicator's core color logic and visual system have been preserved while expanding functionality for automated trading applications.

Regime Filter IndicatorRegime Filter – Crypto Market Trend Indicator
📊 Overview
The Regime Filter is a powerful market analysis indicator designed specifically for crypto trading. It helps traders identify whether the market is in a bullish or bearish phase by analyzing key assets in the cryptocurrency market, including Bitcoin (BTC), Bitcoin Dominance (BTC.D), and the Altcoin Market (TOTAL3). The indicator compares these assets against their respective Simple Moving Averages (SMA) to determine the overall market regime, allowing traders to make more informed decisions.
🔍 How It Works
The Regime Filter evaluates three main components to determine the market's sentiment:
1. BTC Dominance (BTC.D) vs. 40 SMA (Medium Timeframe)
The Bitcoin Dominance (BTC.D) is compared to its 40-period SMA on a mid-timeframe (e.g.,
1-hour). If BTC.D is below the 40 SMA, it indicates that altcoins are performing well relative
to Bitcoin, suggesting a bullish altcoin market. If BTC.D is above the 40 SMA, Bitcoin is
gaining dominance, indicating a potential bearish phase for altcoins.
2. TOTAL3 Market Cap vs. 100 SMA (Medium Timeframe)
The TOTAL3 index, which tracks the total market capitalization of all cryptocurrencies except
Bitcoin and Ethereum, is compared to its 100-period SMA. A bullish signal occurs when TOTAL3
is above the 100 SMA, indicating strength in altcoins, while a bearish signal occurs when
TOTAL3 is below the 100 SMA, signaling a potential weakness in the altcoin market.
3. BTC Price vs. 200 SMA (Higher Timeframe)
The current Bitcoin price is compared to its 200-period Simple Moving Average (SMA) on a
higher timeframe (e.g., 4-hour). A bullish signal is given when the BTC price is above the 200
SMA, and a bearish signal when it's below.
🟢 Bullish Market Conditions
The market is considered bullish when:
- BTC Dominance (BTC.D) is below the 40 SMA, suggesting altcoins are gaining momentum.
- TOTAL3 Market Cap is above the 100 SMA, signaling strength in the altcoin market.
- BTC price is above the 200 SMA, indicating an uptrend in Bitcoin.
In these conditions, the background turns green 🟢, and a "Bullish" label is displayed on the chart.
🔴 Bearish Market Conditions
The market is considered bearish when:
- BTC Dominance (BTC.D) is above the 40 SMA, indicating Bitcoin is outperforming altcoins.
- TOTAL3 Market Cap is below the 100 SMA, signaling weakness in altcoins.
- BTC price is below the 200 SMA, indicating a downtrend in Bitcoin.
In these conditions, the background turns red 🔴, and a "Bearish" label appears on the chart.
⚙ Customization Options
- The Regime Filter offers flexibility for traders:
- Enable or Disable Specific SMAs: Customize the indicator by enabling or disabling the 200 SMA for Bitcoin, the 40 SMA for BTC Dominance, and the 100 SMA for TOTAL3.
- Adjust Timeframes: Choose the timeframes for each of the moving averages to suit your preferred trading strategy.
- Real-Time Data Adjustments: The indicator updates in real-time to reflect current market conditions, ensuring timely analysis.
📈 Best Use Cases
- Trend Confirmation: The Regime Filter is ideal for confirming the market's overall trend,
helping traders to align their positions with the dominant market sentiment.
- Trade Entry/Exit Signals: Use the indicator to identify favorable entry or exit points based on
whether the market is in a bullish or bearish phase.
- Market Overview: Gain a quick understanding of the broader crypto market, with a focus on
Bitcoin and altcoins, to make more strategic decisions.
⚠️ Important Notes
Trend-Following Indicator: The Regime Filter is a trend-following tool, meaning it works best in strong trending markets. It may not perform well in choppy, sideways markets.
Risk Management: This indicator is designed to assist in identifying market trends, but it does not guarantee profits. Always apply sound risk management strategies and use additional indicators when making trading decisions.
Not a Profit Guarantee: While this indicator can help identify potential market trends, no trading tool or strategy guarantees profits. Please trade responsibly and ensure that your decisions are based on comprehensive analysis and risk tolerance.

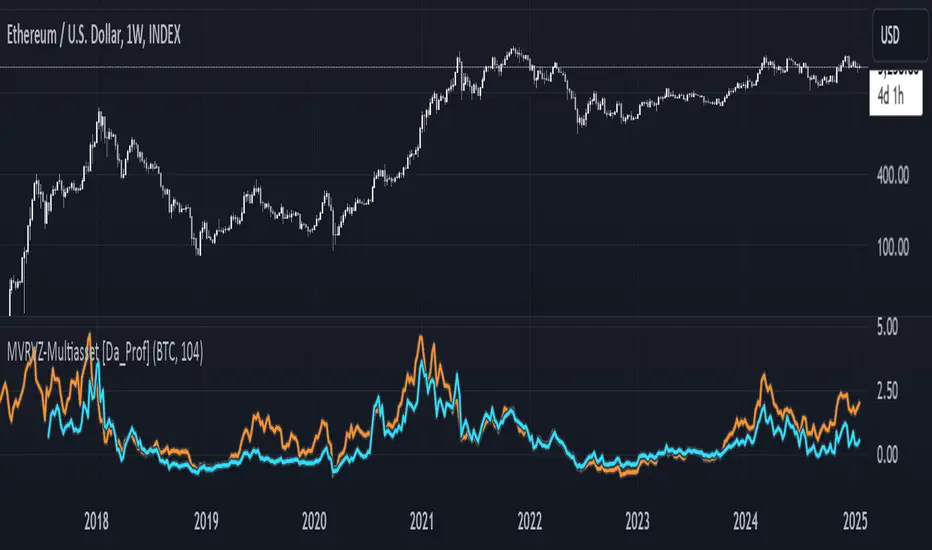
Multiasset MVRVZ - MVRVZ for Multiple Crypto Assets [Da_Prof]This indicator shows the Market Value-Realized Value Z-score (MVRVZ) for Multiple Assets. The MVRV-Z score measures the value of a crypto asset by comparing its market cap to the realized value and dividing by the standard deviation of the market cap (market cap – realized cap) / stdev(market cap) to get a z-score. When the market value is significantly higher than the realized value, the asset may be considered "overvalued". Conversely, market values below the realized value may indicate the asset is "undervalued". For some assets (e.g., BTC) historically high values have generally signaled price tops and historically low values have signaled bottoms.
The indicator displays two lines: 1) the MVRV-Z of the current chart symbol if the data is available through Coin Metrics (this is displayed in light blue), and 2) the MVRV-Z of the symbol selected from the dropdown (displayed in orange). The MVRV-Z of BTC is the default selected orange line. The example chart shows CRYPTOCAP:ETH 's MVRV-Z in blue and CRYPTOCAP:BTC 's MVRV-Z in orange.
The MVRV-Z in this indicator is calculated on the weekly and will display consistently on lower timeframes. Some MVRV-Z indicators calculate this value from collection of all data from the beginning of the chart on the timeframe of the chart. This creates inconsistency in the standard deviation calculation and ultimately the z-score calculation when moving between time frames. This indicator calculates MVRV-Z based on the set number of weeks prior from the source data directly (default is two years worth of weekly data). This allows consistent MVRV-Z values on weekly and lower timeframes.
NexTrade
Overview of NexTrade: The Future of Crypto Trading
Introduction
NexTrade is a cutting-edge algorithmic trading platform designed to optimize cryptocurrency trading strategies. Developed by myself, a software engineer with a passion for quantitative development. Over the past year, I have focused on learning and applying quantitative techniques to the crypto space, ultimately crafting a platform that leverages advanced market analysis, automation, and robust risk management to help investors maximize returns while minimizing risk. NexTrade is engineered to help you capitalize on market movements in a fast-paced and highly competitive space, that is Cryptocurrency.
Key Features and Advantages
Sophisticated Market Analysis: NexTrade uses a comprehensive market analysis framework that examines historical trends, price movements, and market conditions across multiple cryptocurrency exchanges. The algorithm identifies trading opportunities by chart analysis on higher timeframes in order to follow trends, allowing it to execute trades at optimal moments.
Multi-Exchange Integration: NexTrade connects to multiple leading cryptocurrency exchanges, such as Binance, Kraken, and Coinbase Pro, to ensure access to diverse liquidity pools. This multi-exchange connectivity allows the platform to execute trades at the most favorable prices, optimizing profitability and minimizing slippage across various platforms. However, we suggest using the exchange with lowest fees possible.
Risk Management: NexTrade’s risk management features such as Stop Losses, ATR Trailing SL, and ADX chop indicator allows us to ensure we are effectively managing our risk.
Backtesting and Optimization: Before going live, NexTrade’s trading strategies undergo rigorous backtesting using historical market data. This enables users to see how strategies would have performed under various conditions, providing transparency and confidence in the platform’s potential for generating consistent returns. Ongoing optimization ensures that strategies evolve in response to market changes.
Real-Time Performance Monitoring: Users have access to detailed, real-time performance reports, tracking key metrics such as trades executed, profits, losses, and overall portfolio performance. This transparency allows investors to make informed decisions and monitor their investments closely at any time.
Market Opportunity
The cryptocurrency market continues to experience rapid growth, with trillions of dollars in trading volume annually. However, it is also notoriously volatile, creating both risk and reward opportunities for traders. To successfully navigate this market, investors need sophisticated tools that can automate the trading process and optimize decisions based on accurate market analysis.
NexTrade was developed to address this need. With its combination of data-driven market analysis, automated execution, and risk management, NexTrade is positioned to help investors gain an edge in a market that is often unpredictable and challenging. The platform offers a reliable, scalable solution to crypto trading, designed for both beginners and seasoned professionals.
Why Invest in NexTrade?
Scalable and Flexible: Whether you’re trading small amounts or large volumes, NexTrade can scale to accommodate your needs. The platform supports multiple exchanges, giving users the flexibility to diversify and grow their investments. Users can start with as low as $100!
Risk-Adjusted Returns: By focusing on risk management, NexTrade aims to deliver returns that are balanced with the level of risk the investor is willing to accept. The algorithm continuously adjusts trading strategies to align with market conditions, maximizing the potential for profits while minimizing the likelihood of significant losses.
24/7 Trading: The cryptocurrency market operates around the clock, and NexTrade is designed to take advantage of this. Its automated nature means that it can execute trades at any time, without the need for human intervention.
Conclusion
NexTrade offers a sophisticated yet accessible solution for investors looking to capitalize on the growth of the cryptocurrency market. With its focus on data-driven analysis, automated trade execution, and advanced risk management, NexTrade empowers investors to achieve optimal returns while managing risk effectively. Whether you are new to crypto or an experienced trader, NexTrade provides the tools needed to stay competitive and succeed in a fast-moving market.
By investing in NexTrade, you are gaining access to a proven algorithmic trading platform that has the potential to enhance your crypto trading strategy and deliver consistent results. The future of cryptocurrency trading is automated, risk-managed, and optimized—and NexTrade is leading the way.
If users wish the enable the chop detector on the bot, which uses ADX, they can turn it on in the settings after the strategu is added to the chart. By default, it is set to false.

The Adaptive Pairwise Momentum System [QuantraSystems]The Adaptive Pairwise Momentum System
QuantraSystems guarantees that the information created and published within this document and on the Tradingview platform is fully compliant with applicable regulations, does not constitute investment advice, and is not exclusively intended for qualified investors.
Important Note!
The system equity curve presented here has been generated as part of the process of testing and verifying the methodology behind this script.
Crucially, it was developed after the system was conceptualized, designed, and created, which helps to mitigate the risk of overfitting to historical data. In other words, the system was built for robustness, not for simply optimizing past performance.
This ensures that the system is less likely to degrade in performance over time, compared to hyper-optimized systems that are tailored to past data. No tweaks or optimizations were made to this system post-backtest.
Even More Important Note!!
The nature of markets is that they change quickly and unpredictably. Past performance does not guarantee future results - this is a fundamental rule in trading and investing.
While this system is designed with broad, flexible conditions to adapt quickly to a range of market environments, it is essential to understand that no assumptions should be made about future returns based on historical data. Markets are inherently uncertain, and this system - like all trading systems - cannot predict future outcomes.
Introduction
The Adaptive Pairwise Momentum System is not just an indicator but a comprehensive asset rotation and trend-following system. In short, it aims to find the highest performing asset from the provided range.
The system dynamically optimizes capital allocation across up to four high-performing assets, ensuring that the portfolio adapts swiftly to changing market conditions. The system logic consists of sophisticated quantitative methods, rapid momentum analysis, and robust trend filtering. The overarching goal is to ensure that the portfolio is always invested in the highest-performing asset based on dynamic market conditions, while at the same time managing risk through broader market filters and internal mechanisms like volatility and beta analysis.
Legend
System Equity Curve:
The equity curve displayed in the chart is dynamically colored based on the asset allocation at any given time. This color-coded approach allows traders to immediately identify transitions between assets and the corresponding impact on portfolio performance.
Highlighting of Current Highest Performer:
The current bar in the chart is highlighted based on the confirmed highest performing asset. This is designed to give traders advanced notice of potential shifts in allocation even before a formal position change occurs. The highlighting enables traders to prepare in real time, making it easier to manage positions without lag, particularly in fast-moving markets.
Highlighted Symbols in the Asset Table:
In the table displayed on the right hand side of the screen, the current top-performing symbol is highlighted. This clear signal at a glance provides immediate insight into which asset is currently being favored by the system. This feature enhances clarity and helps traders make informed decisions quickly, without needing to analyze the underlying data manually.
Performance Overview in Tables:
The left table provides insight into both daily and overall system performance from inception, offering traders a detailed view of short-term fluctuations and long-term growth. The right-hand table breaks down essential metrics such as Sharpe ratio, Sortino ratio, Omega ratio, and maximum drawdown for each asset, as well as for the overall system and HODL strategy.
Asset-Specific Signals:
The signals column in the table indicates whether an asset is currently held or being considered for holding based on the system's dynamic rankings. This is a critical visual aid for asset reallocation decisions, signaling when it may be appropriate to either maintain or change the asset of the portfolio.
Core Features and Methodologies
Flexibility in Asset Selection
One of the major advantages of this system is its flexibility. Users can easily modify the number and type of assets included for comparison. You can quickly input different assets and backtest their performance, allowing you to verify how well this system might fit different tokens or market conditions. This flexibility empowers users to adapt the system to a wide range of market environments and tailor it to their unique preferences.
Whole System Risk Mitigation - Macro Trend Filter
One of the features of this script is its integration of a Macro-level Trend Filter for the entire portfolio. The purpose of this filter is to ensure no capital is allocated to any token in the rotation system unless Bitcoin itself is in a positive trend. The logic here is that Bitcoin, as the cryptocurrency market leader, often sets the tone for the entire cryptocurrency market. By using Bitcoins trend direction as a barometer for overall market conditions, we create a system where capital is not allocated during unfavorable or bearish market conditions - significantly reducing exposure to downside risk.
Users have the ability to toggle this filter on and off in the input menu, with five customizable options for the trend filter, including the option to use no filter. These options are:
Nova QSM - a trend aggregate combining the Rolling VWAP, Wave Pendulum Trend, KRO Overlay, and the Pulse Profiler provides the market trend signal confirmation.
Kilonova QSM - a versatile aggregate combining the Rolling VWAP, KRO Overlay, the KRO Base, RSI Volatility Bands, NNTRSI, Regression Smoothed RSI and the RoC Suite.
Quasar QSM - an enhanced version of the original RSI Pulsar. The Quasar QSM refines the trend following approach by utilizing an aggregated methodology.
Pairwise Momentum and Strength Ranking
The backbone of this system is its ability to identify the strongest-performing asset in the selected pool, ensuring that the portfolio is always exposed to the asset showing the highest relative momentum. The system continually ranks these assets against each other and determines the highest performer by measure of past and coincident outperformance. This process occurs rapidly, allowing for swift responses to shifts in market momentum, which ensures capital is always working in the most efficient manner. The speed and precision of this reallocation strategy make the script particularly well-suited for active, momentum-driven portfolios.
Beta-Adjusted Asset Selection as a Tiebreaker
In the circumstance where two (or more) assets exhibit the same relative momentum score, the system introduces another layer of analysis. In the event of a strength ‘tie’ the system will preference maintaining the current position - that is, if the previously strongest asset is now tied, the system will still allocate to the same asset. If this is not the case, the asset with the higher beta is selected. Beta is a measure of an asset’s volatility relative to Bitcoin (BTC).
This ensures that in bullish conditions, the system favors assets with a higher potential for outsized gains due to their inherent volatility. Beta is calculated based on the Average Daily Return of each asset compared to BTC. By doing this, the system ensures that it is dynamically adjusting to risk and reward, allocating to assets with higher risk in favorable conditions and lower risk in less favorable conditions.
Dynamic Asset Reallocation - Opposed to Multi-Asset Fixed Intervals
One of the standout features of this system is its ability to dynamically reallocate capital. Unlike traditional portfolio allocation strategies that may rebalance between a basket of assets monthly or quarterly, this system recalculates and reallocates capital on the next bar close (if required). As soon as a new asset exhibits superior performance relative to others, the system immediately adjusts, closing the previous position and reallocating funds to the top-ranked asset.
This approach is particularly powerful in volatile markets like cryptocurrencies, where trends can shift quickly. By reallocating swiftly, the system maximizes exposure to high-performing assets while minimizing time spent in underperforming ones. Moreover, this process is entirely automated, freeing the trader from manually tracking and measuring individual token strength.
Our research has demonstrated that, from a risk-adjusted return perspective, concentration into the top-performing asset consistently outperforms broad diversification across longer time horizons. By focusing capital on the highest-performing asset, the system captures outsized returns that are not achievable through traditional diversification. However, a more risk-averse investor, or one seeking to reduce drawdowns, may prefer to move the portfolio further left along the theoretical Capital Allocation Line by incorporating a blend of cash, treasury bonds, or other yield-generating assets or even include market neutral strategies alongside the rotation system. This hybrid approach would effectively lower the overall volatility of the portfolio while still maintaining exposure to the system’s outsized returns. In theory, such an investor can reduce risk without sacrificing too much potential upside, creating a more balanced risk-return profile.
Position Changes and Fees/Slippage
Another critical and often overlooked element of this system is its ability to account for fees and slippage. Given the increased speed and frequency of allocation logic compared to the buy-and-hold strategy, it is of vital importance that the system recognises that switching between assets may incur slippage, especially in highly volatile markets. To account for this, the system integrates realistic slippage and fee estimates directly into the equity curve, simulating expected execution costs under typical market conditions and gives users a more realistic view of expected performance.
Number of Position Changes
Understanding the number of position changes in a strategy is critical to assessing its feasibility in real world trading. Frequent position changes can lead to increased costs due to slippage and fees. Monitoring the number of position changes provides insight into the system’s behavior - helping to evaluate how active the strategy is and whether it aligns with the trader's desired time input for position management.
Equity Curve and Performance Calculations
To provide a benchmark, the script also generates a Buy-and-Hold (or "HODL") equity curve that represents an equal split across the four selected assets. This allows users to easily compare the performance of the dynamic rotation system with that of a more traditional investment strategy.
The script tracks key performance metrics for both the dynamic portfolio and the HODL strategy, including:
Sharpe Ratio
The Sharpe Ratio is a key metric that evaluates a portfolio’s risk-adjusted return by comparing its ‘excess’ return to its volatility. Traditionally, the Sharpe Ratio measures returns relative to a risk-free rate. However, in our system’s calculation, we omit the risk-free rate and instead measure returns above a benchmark of 0%. This adjustment provides a more universal comparison, especially in the context of highly volatile assets like cryptocurrencies, where a traditional risk-free benchmark, such as the usual 3-month T-bills, is often irrelevant or too distant from the realities of the crypto market.
By using 0% as the baseline, we focus purely on the strategy's ability to generate raw returns in the face of market risk, which makes it easier to compare performance across different strategies or asset classes. In an environment like cryptocurrency, where volatility can be extreme, the importance of relative return against a highly volatile backdrop outweighs comparisons to a risk-free rate that bears little resemblance to the risk profile of digital assets.
Sortino Ratio
The Sortino Ratio improves upon the Sharpe Ratio by specifically targeting downside risk and leaves the upside potential untouched. In contrast to the Sharpe Ratio (which penalizes both upside and downside volatility), the Sortino Ratio focuses only on negative return deviations. This makes it a more suitable metric for evaluating strategies like the Adaptive Pairwise Momentum Strategy - that aim to minimize drawdowns without restricting upside capture. By measuring returns relative to a 0% baseline, the Sortino ratio provides a clearer assessment of how well the system generates gains while avoiding substantial losses in highly volatile markets like crypto.
Omega Ratio
The Omega Ratio is calculated as the ratio of gains to losses across all return thresholds, providing a more complete view of how the system balances upside and downside risk even compared to the Sortino Ratio. While it achieves a similar outcome to the Sortino Ratio by emphasizing the system's ability to capture gains while limiting losses, it is technically a mathematically superior method. However, we include both the Omega and Sortino ratios in our metric table, as the Sortino Ratio remains more widely recognized and commonly understood by traders and investors of all levels.
Case Study
Notes
For the sake of brevity, the Important Notes section found in the header of this text will not be rewritten. Instead, it will be highlighted that now is the perfect time to reread these notes. Reading this case study in the context of what has been mentioned above is of key importance.
As a second note, it is worth mentioning that certain market periods are referred to as either “Bull” or “Bear” markets - terms I personally find to be vague and undefinable - and therefore unfavorable. They will be used nevertheless, due to their familiarity and ease of understanding in this context. Substitute phrases could be “Macro Uptrend” or “Macro Downtrend.”
Overview
This case study provides an in-depth performance analysis of the Adaptive Pairwise Momentum System , a long-only system that dynamically allocates to outperforming assets and moves into cash during unfavorable conditions.
This backtest includes realistic assumptions for slippage and fees, applying a 0.5% cost for every position change, which includes both asset reallocation and moving to a cash position. Additionally, the system was tested using the top four cryptocurrencies by market capitalization as of the test start date of 01/01/2022 in order to minimize selection bias.
The top tokens on this date (excluding Stablecoins) were:
Bitcoin
Ethereum
Solana
BNB
This decision was made in order to avoid cherry picking assets that might have exhibited exceptional historical performance - minimizing skew in the back test. Furthermore, although this backtest focuses on these specific assets, the system is built to be flexible and adaptable, capable of being applied to a wide range of assets beyond those initially tested.
Any potential lookahead bias or repainting in the calculations has been addressed by implementing the lookback modifier for all repainting sensitive data, including asset ratios, asset scoring, and beta values. This ensures that no future information is inadvertently used in the asset allocation process.
Additionally, a fixed lookback period of one bar is used for the trend filter during allocations - meaning that the trend filter from the prior bar must be positive for an allocation to occur on the current bar. It is also important to note that all the data displayed by the indicator is based on the last confirmed (closed) bar, ensuring that the entire system is repaint-proof.
The study spans the 2022 cryptocurrency bear market through the subsequent bull market of 2023 and 2024. The stress test highlights how the system reacted to one of the most challenging market downturns in crypto history - which includes events such as:
Luna and TerraUSD crash
Three Arrows Capital liquidation
Celsius bankruptcy
Voyager Digital bankruptcy
FTX collapse
Silicon Valley + Signature + Silvergate banking collapses
Subsequent USDC deppegging
And arguably more important, 2022 was characterized by a tightening of monetary policy after the unprecedented monetary easing in response to the Covid pandemic of 2020/2021. This shift undeniably puts downward pressure on asset prices, most probably to the extent that this had a causal role to many of the above events.
By incorporating these real-world challenges, the backtest provides a more accurate and robust performance evaluation that avoids overfitting or excessive optimization for one specific market condition.
The Bear Market of 2022: Stress Test and System Resilience
During the 2022 bear market, where the overall crypto market experienced deep and consistent corrections, the Adaptive Pairwise Momentum System demonstrated its ability to mitigate downside risk effectively.
Dynamic Allocation and Cash Exposure:
The system rotated in and out of cash, as indicated by the gray period on the system equity curve. This allocation to cash during downtrending periods, specifically in late 2022, acted as the systems ‘risk-off’ exposure - the purest form of such an exposure. This prevented the system from experiencing the magnitude of drawdown suffered by the ‘Buy-and-Hold (HODL) investors.
In contrast, a passive HODL strategy would have suffered a staggering 75.32% drawdown, as it remained fully allocated to chosen assets during the market's decline. The active Pairwise Momentum system’s smaller drawdown of 54.35% demonstrates its more effective capital preservation mechanisms.
The Bull Market of 2023 and 2024: Capturing Market Upside
Following the crypto bear market, the system effectively capitalized on the recovery and subsequent bull market of 2023 and 2024.
Maximizing Market Gains:
As trends began turning bullish in early 2023, the system caught the momentum and promptly allocated capital to only the quantified highest performing asset of the time - resulting in a parabolic rise in the system's equity curve. Notably, the curve transitions from gray to purple during this period, indicating that Solana (SOL) was the top-performing asset selected by the system.
This allocation to Solana is particularly striking because, at the time, it was an asset many in the market shunned due to its association with the FTX collapse just months prior. However, this highlights a key advantage of quantitative systems like the one presented here: decisions are driven purely from objective data - free from emotional or subjective biases. Unlike human traders, who are inclined (whether consciously or subconsciously) to avoid assets that are ‘out of favor,’ this system focuses purely on price performance, often uncovering opportunities that are overlooked by discretionary based investors. This ability to make data-driven decisions ensures that the strategy is always positioned to capture the best risk-adjusted returns, even in scenarios where judgment might fail.
Minimizing Volatility and Drawdown in Uptrends
While the system captured substantial returns during the bull market it also did so with lower volatility compared to HODL. The sharpe ratio of 4.05 (versus HODL’s 3.31) reflects the system's superior risk-adjusted performance. The allocation shifts, combined with tactical periods of cash holding during minor corrections, ensured a smoother equity curve growth compared to the buy-and-hold approach.
Final Summary
The percentage returns are mentioned last for a reason - it is important to emphasize that risk-adjusted performance is paramount. In this backtest, the Pairwise Momentum system consistently outperforms due to its ability to dynamically manage risk (as seen in the superior Sharpe, Sortino and Omega ratios). With a smaller drawdown of 54.35% compared to HODL’s 75.32%, the system demonstrates its resilience during market downturns, while also capturing the highest beta on the upside during bullish phases.
The system delivered 266.26% return since the backtest start date of January 1st 2022, compared to HODL’s 10.24%, resulting in a performance delta of 256.02%
While this backtest goes some of the way to verifying the system’s feasibility, it’s important to note that past performance is not indicative of future results - especially in volatile and evolving markets like cryptocurrencies. Market behavior can shift, and in particular, if the market experiences prolonged sideways action, trend following systems such as the Adaptive Pairwise Momentum Strategy WILL face significant challenges.

Hilly's Advanced Crypto Scalping Strategy - 5 Min ChartTo determine the "best" input parameters for the Advanced Crypto Scalping Strategy on a 5-minute chart, we need to consider the goals of optimizing for profitability, minimizing false signals, and adapting to the volatile nature of cryptocurrencies. The default parameters in the script are a starting point, but the optimal values depend on the specific cryptocurrency pair, market conditions, and your risk tolerance. Below, I'll provide recommended input values based on common practices in crypto scalping, along with reasoning for each parameter. I’ll also suggest how to fine-tune them using TradingView’s backtesting and optimization tools.
Recommended Input Parameters
These values are tailored for a 5-minute chart for liquid cryptocurrencies like BTC/USD or ETH/USD on exchanges like Binance or Coinbase. They aim to balance signal frequency and accuracy for day trading.
Fast EMA Length (emaFastLen): 9
Reasoning: A 9-period EMA is commonly used in scalping to capture short-term price movements while remaining sensitive to recent price action. It reacts faster than the default 10, aligning with the 5-minute timeframe.
Slow EMA Length (emaSlowLen): 21
Reasoning: A 21-period EMA provides a good balance for identifying the broader trend on a 5-minute chart. It’s slightly longer than the default 20 to reduce noise while confirming the trend direction.
RSI Length (rsiLen): 14
Reasoning: The default 14-period RSI is a standard choice for momentum analysis. It works well for detecting overbought/oversold conditions without being too sensitive on short timeframes.
RSI Overbought (rsiOverbought): 75
Reasoning: Raising the overbought threshold to 75 (from 70) reduces false sell signals in strong bullish trends, which are common in crypto markets.
RSI Oversold (rsiOversold): 25
Reasoning: Lowering the oversold threshold to 25 (from 30) filters out weaker buy signals, ensuring entries occur during stronger reversals.
MACD Fast Length (macdFast): 12
Reasoning: The default 12-period fast EMA for MACD is effective for capturing short-term momentum shifts in crypto, aligning with scalping goals.
MACD Slow Length (macdSlow): 26
Reasoning: The default 26-period slow EMA is a standard setting that works well for confirming momentum trends without lagging too much.
MACD Signal Smoothing (macdSignal): 9
Reasoning: The default 9-period signal line is widely used and provides a good balance for smoothing MACD crossovers on a 5-minute chart.
Bollinger Bands Length (bbLen): 20
Reasoning: The default 20-period Bollinger Bands are effective for identifying volatility breakouts, which are key for scalping in crypto markets.
Bollinger Bands Multiplier (bbMult): 2.0
Reasoning: A 2.0 multiplier is standard and captures most price action within the bands. Increasing it to 2.5 could reduce signals but improve accuracy in highly volatile markets.
Stop Loss % (slPerc): 0.8%
Reasoning: A tighter stop loss of 0.8% (from 1.0%) suits the high volatility of crypto, helping to limit losses on false breakouts while keeping risk manageable.
Take Profit % (tpPerc): 1.5%
Reasoning: A 1.5% take-profit target (from 2.0%) aligns with scalping’s goal of capturing small, frequent gains. Crypto markets often see quick reversals, so a smaller target increases the likelihood of hitting profits.
Use Candlestick Patterns (useCandlePatterns): True
Reasoning: Enabling candlestick patterns (e.g., engulfing, hammer) adds confirmation to signals, reducing false entries in choppy markets.
Use Volume Filter (useVolumeFilter): True
Reasoning: The volume filter ensures signals occur during high-volume breakouts, which are more likely to sustain in crypto markets.
Signal Arrow Size (signalSize): 2.0
Reasoning: Increasing the arrow size to 2.0 (from 1.5) makes buy/sell signals more visible on the chart, especially on smaller screens or volatile price action.
Background Highlight Transparency (bgTransparency): 85
Reasoning: A slightly higher transparency (85 from 80) keeps the background highlights subtle but visible, avoiding chart clutter.
How to Apply These Parameters
Copy the Script: Use the Pine Script provided in the previous response.
Paste in TradingView: Open TradingView, go to the Pine Editor, paste the code, and click "Add to Chart."
Set Parameters: In the strategy settings, manually input the recommended values above or adjust them via the input fields.
Test on a 5-Minute Chart: Apply the strategy to a liquid crypto pair (e.g., BTC/USDT, ETH/USDT) on a 5-minute chart.
Fine-Tuning for Optimal Performance
To find the absolute best parameters for your specific trading pair and market conditions, use TradingView’s Strategy Tester and optimization features:
Backtesting:
Run the strategy on historical data for your chosen pair (e.g., BTC/USDT on Binance).
Check metrics like Net Profit, Profit Factor, Win Rate, and Max Drawdown in the Strategy Tester.
Focus on a sample period of at least 1–3 months to capture various market conditions (bull, bear, sideways).
Parameter Optimization:
In the Strategy Tester, click the settings gear next to the strategy name.
Enable optimization for key inputs like emaFastLen (test range: 7–12), emaSlowLen (15–25), slPerc (0.5–1.5), and tpPerc (1.0–3.0).
Run the optimization to find the combination with the highest net profit or best Sharpe ratio, but avoid over-optimization (curve-fitting) by testing on out-of-sample data.
Market-Specific Adjustments:
Volatile Pairs (e.g., DOGE/USDT): Use tighter stop losses (e.g., 0.5–0.7%) and smaller take-profit targets (e.g., 1.0–1.2%) to account for rapid price swings.
Stable Pairs (e.g., BTC/USDT): Slightly wider stop losses (e.g., 1.0–1.2%) and take-profit targets (e.g., 1.8–2.5%) may work better.
Trending Markets: Increase emaSlowLen (e.g., to 25–30) to follow stronger trends.
Choppy Markets: Tighten bbMult (e.g., to 1.8) and lower rsiOverbought/rsiOversold (e.g., to 70/30) to filter noise.
Forward Testing:
After backtesting, run the strategy in real-time on a demo account for 1–2 weeks to validate performance under current market conditions.
Important Notes
No Universal "Best" Numbers: Optimal parameters vary by crypto pair, exchange, and market conditions (e.g., bull vs. bear market). The suggested values are a starting point based on common scalping practices.
Risk Management: Never risk more than 1–2% of your account per trade. Adjust position sizing in TradingView’s strategy settings to align with your risk tolerance.
Market Volatility: Crypto markets are highly volatile. Test the strategy on your specific pair and adjust parameters if signals are too frequent or too rare.
Not Financial Advice: This is an educational tool. Backtest thoroughly and use a demo account before trading with real funds.
If you want me to generate a chart showing backtest performance for specific parameters or to tweak the script further (e.g., adding more indicators or adjusting signal logic), let me know!can you add clear buy ans sell signs above the candles in this codeTo add clear buy and sell signals above the candles in the provided Pine Script, I'll modify the existing code to include prominent text labels directly above (for sell signals) and below (for buy signals) the candles. These labels will be larger, color-coded, and positioned to avoid clutter, ensuring they are easily visible on the chart. The core strategy logic (EMA, RSI, MACD, Bollinger Bands, candlestick patterns, and volume filter) will remain unchanged, and I'll reuse the same artifact_id since this is an update to the previous script.AdvancedCryptoScalpingStrategy.pinex-pine

Swing Z – Crypto Trading Algorithm | Zillennial Technologies IncSwing Z by Zillennial Technologies Inc. is an advanced algorithmic framework built specifically for cryptocurrency markets. It integrates multiple layers of technical analysis into a single decision-support tool, generating buy and sell signals only when several independent confirmations align.
Core Concept
Swing Z fuses trend structure, momentum oscillators, volatility signals, and price action tools to capture high-probability trading opportunities in volatile crypto environments.
Trend Structure (EMA 9, 21, 50, 200)
Short-term EMAs (9 & 21) detect immediate momentum shifts.
Longer-term EMAs (50 & 200) define the broader trend and dynamic support/resistance.
Momentum & Confirmation Layer
RSI measures relative strength and market conditions.
MACD crossovers confirm momentum shifts and trend continuations.
Volatility & Market Pressure
TTM Squeeze highlights compression zones likely to precede breakouts.
Volume analysis confirms conviction behind directional moves.
VWAP (Volume Weighted Average Price) establishes intraday value zones and institutional benchmarks.
Price Action Filters
Fibonacci retracements are integrated to identify key reversal and continuation levels.
Signals are produced only when multiple conditions agree, reducing noise and improving reliability in fast-moving crypto markets.
Features
Tailored for cryptocurrency trading across major pairs (BTC, ETH, and altcoins).
Works effectively on swing and trend-based timeframes (1H–1D).
Combines trend, momentum, volatility, and price action into a single framework.
Generates clear Buy/Sell markers and integrates with TradingView alerts.
How to Use
Apply to a clean chart for the clearest visualization.
Use Swing Z as a swing trading tool, aligning entries with both trend structure and momentum confirmation.
Combine with your own stop-loss, take-profit, and position sizing rules.
Avoid application on non-standard chart types such as Renko, Heikin Ashi, or Point & Figure, which may distort results.
Disclaimer
Swing Z is designed as a decision-support tool, not financial advice.
All backtesting should use realistic risk, commission, and slippage assumptions.
Past results do not guarantee future performance.
Signals do not repaint but may adjust as new data develops in real-time.
Why Swing Z is original & useful:
Swing Z unifies EMA trend structure, RSI, MACD, TTM Squeeze, VWAP, Fibonacci retracements, and volume analysis into a single algorithmic framework. This multi-confirmation approach improves accuracy by requiring consensus across trend, momentum, volatility, and price action — a design made specifically for the challenges and volatility of cryptocurrency markets.

Time-Decaying Percentile Oscillator [BackQuant]Time-Decaying Percentile Oscillator
1. Big-picture idea
Traditional percentile or stochastic oscillators treat every bar in the look-back window as equally important. That is fine when markets are slow, but if volatility regime changes quickly yesterday’s print should matter more than last month’s. The Time-Decaying Percentile Oscillator attempts to fix that blind spot by assigning an adjustable weight to every past price before it is ranked. The result is a percentile score that “breathes” with market tempo much faster to flag new extremes yet still smooth enough to ignore random noise.
2. What the script actually does
Build a weight curve
• You pick a look-back length (default 28 bars).
• You decide whether weights fall Linearly , Exponentially , by Power-law or Logarithmically .
• A decay factor (lower = faster fade) shapes how quickly the oldest price loses influence.
• The array is normalised so all weights still sum to 1.
Rank prices by weighted mass
• Every close in the window is paired with its weight.
• The pairs are sorted from low to high.
• The cumulative weight is walked until it equals your chosen percentile level (default 50 = median).
• That price becomes the Time-Decayed Percentile .
Find dispersion with robust statistics
• Instead of a fragile standard deviation the script measures weighted Median-Absolute-Deviation about the new percentile.
• You multiply that deviation by the Deviation Multiplier slider (default 1.0) to get a non-parametric volatility band.
Build an adaptive channel
• Upper band = percentile + (multiplier × deviation)
• Lower band = percentile – (multiplier × deviation)
Normalise into a 0-100 oscillator
• The current close is mapped inside that band:
0 = lower band, 50 = centre, 100 = upper band.
• If the channel squeezes, tiny moves still travel the full scale; if volatility explodes, it automatically widens.
Optional smoothing
• A second-stage moving average (EMA, SMA, DEMA, TEMA, etc.) tames the jitter.
• Length 22 EMA by default—change it to tune reaction speed.
Threshold logic
• Upper Threshold 70 and Lower Threshold 30 separate standard overbought/oversold states.
• Extreme bands 85 and 15 paint background heat when aggressive fade or breakout trades might trigger.
Divergence engine
• Looks back twenty bars.
• Flags Bullish divergence when price makes a lower low but oscillator refuses to confirm (value < 40).
• Flags Bearish divergence when price prints a higher high but oscillator stalls (value > 60).
3. Component walk-through
• Source – Any price series. Close by default, switch to typical price or custom OHLC4 for futures spreads.
• Look-back Period – How many bars to rank. Short = faster, long = slower.
• Base Percentile Level – 50 shows relative position around the median; set to 25 / 75 for quartile tracking or 90 / 10 for extreme tails.
• Deviation Multiplier – Higher values widen the dynamic channel, lowering whipsaw but delaying signals.
• Decay Settings
– Type decides the curve shape. Exponential (default 1.16) mimics EMA logic.
– Factor < 1 shrinks influence faster; > 1 spreads influence flatter.
– Toggle Enable Time Decay off to compare with classic equal-weight stochastic.
• Smoothing Block – Choose one of seven MA flavours plus length.
• Thresholds – Overbought / Oversold / Extreme levels. Push them out when working on very mean-reverting assets like FX; pull them in for trend monsters like crypto.
• Display toggles – Show or hide threshold lines, extreme filler zones, bar colouring, divergence labels.
• Colours – Bullish green, bearish red, neutral grey. Every gradient step is automatically blended to generate a heat map across the 0-100 range.
4. How to read the chart
• Oscillator creeping above 70 = market auctioning near the top of its adaptive range.
• Fast poke above 85 with no follow-through = exhaustion fade candidate.
• Slow grind that lives above 70 for many bars = valid bullish trend, not a fade.
• Cross back through 50 shows balance has shifted; treat it like a micro trend change.
• Divergence arrows add extra confidence when you already see two-bar reversal candles at range extremes.
• Background shading (semi-transparent red / green) warns of extreme states and throttles your position size.
5. Practical trading playbook
Mean-reversion scalps
1. Wait for oscillator to reach your desired OB/ OS levels
2. Check the slope of the smoothing MA—if it is flattening the squeeze is mature.
3. Look for a one- or two-bar reversal pattern.
4. Enter against the move; first target = midline 50, second target = opposite threshold.
5. Stop loss just beyond the extreme band.
Trend continuation pullbacks
1. Identify a clean directional trend on the price chart.
2. During the trend, TDP will oscillate between midline and extreme of that side.
3. Buy dips when oscillator hits OS levels, and the same for OB levels & shorting
4. Exit when oscillator re-tags the same-side extreme or prints divergence.
Volatility regime filter
• Use the Enable Time Decay switch as a regime test.
• If equal-weight oscillator and decayed oscillator diverge widely, market is entering a new volatility regime—tighten stops and trade smaller.
Divergence confirmation for other indicators
• Pair TDP divergence arrows with MACD histogram or RSI to filter false positives.
• The weighted nature means TDP often spots divergence a bar or two earlier than standard RSI.
Swing breakout strategy
1. During consolidation, band width compresses and oscillator oscillates around 50.
2. Watch for sudden expansion where oscillator blasts through extreme bands and stays pinned.
3. Enter with momentum in breakout direction; trail stop behind upper or lower band as it re-expands.
6. Customising decay mathematics
Linear – Each older bar loses the same fixed amount of influence. Intuitive and stable; good for slow swing charts.
Exponential – Influence halves every “decay factor” steps. Mirrors EMA thinking and is fastest to react.
Power-law – Mid-history bars keep more authority than exponential but oldest data still fades. Handy for commodities where seasonality matters.
Logarithmic – The gentlest curve; weight drops sharply at first then levels off. Mimics how traders remember dramatic moves for weeks but forget ordinary noise quickly.
Turn decay off to verify the tool’s added value; most users never switch back.
7. Alert catalogue
• TD Overbought / TD Oversold – Cross of regular thresholds.
• TD Extreme OB / OS – Breach of danger zones.
• TD Bullish / Bearish Divergence – High-probability reversal watch.
• TD Midline Cross – Momentum shift that often precedes a window where trend-following systems perform.
8. Visual hygiene tips
• If you already plot price on a dark background pick Bullish Color and Bearish Color default; change to pastel tones for light themes.
• Hide threshold lines after you memorise the zones to declutter scalping layouts.
• Overlay mode set to false so the oscillator lives in its own panel; keep height about 30 % of screen for best resolution.
9. Final notes
Time-Decaying Percentile Oscillator marries robust statistical ranking, adaptive dispersion and decay-aware weighting into a simple oscillator. It respects both recent order-flow shocks and historical context, offers granular control over responsiveness and ships with divergence and alert plumbing out of the box. Bolt it onto your price action framework, trend-following system or volatility mean-reversion playbook and see how much sooner it recognises genuine extremes compared to legacy oscillators.
Backtest thoroughly, experiment with decay curves on each asset class and remember: in trading, timing beats timidity but patience beats impulse. May this tool help you find that edge.

Pro Trading White Crow### English Description (For TradingView Publication)
**Timeframes:** All (Optimal: M15-H4)
**Markets:** Forex, Cryptocurrencies, Stocks
**Unique Value Proposition:**
The White Crow system combines institutional trading concepts with retail-friendly signals. Its patented triple-filtering methodology detects:
1. Smart Money accumulation zones (Order Blocks)
2. Market structure shifts (Pivot Points)
3. Momentum clusters (CCI/RSI convergence)
**Key Features:**
✅ **4 Professional Signals:**
- `Buy`: Standard long entry
- `Buy X`: Strong accumulation signal
- `Close`: Standard exit signal
- `CloseV`: Urgent liquidation signal
✅ **Institutional Tools:**
- Order Block detection
- Adaptive pivot points
- Cluster momentum analysis
✅ **Advanced Filters:**
- RSI divergence filter
- Time-based signal suppression
- Volatility-adjusted thresholds
**Optimal Settings:**
| Market | Period | Sigma | Order Block Multiplier |
|--------------|------------|--------|------------------------|
| Forex | 5 | 0.036 | 1.5 |
| Crypto | 3 | 0.050 | 2.0 |
| Stocks | 8 | 0.025 | 1.2 |
**Usage Guide:**
1. **Identify Bias:**
- Bullish: Consecutive higher pivots
- Bearish: Consecutive lower pivots
2. **Entry Rules:**
```pine
Enter Long when:
+ +
```
3. **Exit Rules:**
```pine
Exit when:
OR
```
4. **Risk Management:**
- Stop Loss: Recent pivot low
- Position Size: 1-2% account risk
**Risk Disclosure:**
⚠️ Trading involves significant capital risk. This indicator:
- May produce false signals during news events
- Requires confirmation on higher timeframes
- Should be tested in demo accounts first
- Is not financial advice (educational purpose only)
**Why "White Crow"?**
In market psychology, a white crow represents an exceptional opportunity that contradicts normal market behavior - exactly what this system detects through its unique convergence of institutional flow analysis and technical signals.
---
### Описание на русском (Для публикации на TradingView)
**Таймфреймы:** Все (оптимально: M15-H4)
**Рынки:** Форекс, Крипта, Акции
Институциональные концепции с понятными сигналами. Методика тройной фильтрации обнаруживает:
1. Зоны накопления "умных денег" (Блоки ордеров)
2. Смены рыночной структуры (Пивотные точки)
3. Кластеры импульса (конвергенция CCI/RSI)
**Ключевые особенности:**
✅ **4 Профессиональных сигнала:**
- `Buy`: Стандартный вход в лонг
- `Buy X`: Сигнал сильного накопления
- `Close`: Стандартный сигнал выхода
- `CloseV`: Срочный сигнал ликвидации
✅ **Институциональные инструменты:**
- Обнаружение блоков ордеров
- Адаптивные пивотные точки
- Анализ кластеров импульса
✅ **Продвинутые фильтры:**
- Фильтр дивергенции RSI
- Временное подавление сигналов
- Пороги с учётом волатильности
**Оптимальные настройки:**
| Рынок | Период | Сигма | Множитель блоков ордеров |
|--------------|------------|----------|--------------------------|
| Форекс | 5 | 0.036 | 1.5 |
| Крипта | 3 | 0.050 | 2.0 |
| Акции | 8 | 0.025 | 1.2 |
**Инструкция по применению:**
1. **Определение тренда:**
- Бычий: Последовательные более высокие пивоты
- Медвежий: Последовательные более низкие пивоты
2. **Правила входа:**
```pine
Вход в лонг при:
+ +
```
3. **Правила выхода:**
```pine
Выход при:
ИЛИ
```
4. **Управление рисками:**
- Стоп-лосс: Последний пивотный минимум
- Размер позиции: 1-2% риска на сделку
**Предупреждение о рисках:**
⚠️ Торговля связана со значительным риском потери капитала. Индикатор:
- Может давать ложные сигналы во время новостей
- Требует подтверждения на старших таймфреймах
- Необходимо тестировать на демо-счетах
- Не является финансовой рекомендацией (только обучение)
**Почему "White Crow"?**
В рыночной психологии белая ворона символизирует исключительную возможность, противоречащую нормальному поведению рынка - именно это обнаруживает система через уникальное сочетание анализа институционального потока и технических сигналов.

Market sentiment and cryptocurrency narratives📈 IDRA + PFLA: Crypto Market Sentiment & Narrative Flow
Uncover hidden opportunities and navigate the dynamic crypto landscape with IDRA + PFLA (Intraday Dynamic Risk Assessment + Public Flow & Liquidity Analysis). This powerful, two-in-one indicator suite is meticulously designed to provide you with a comprehensive understanding of market sentiment and identify active cryptocurrency narratives across different timeframes.
IDRA: Intraday Dynamic Risk Assessment (Daily & 4-Hour)
The IDRA component offers a unique perspective on overall market sentiment, helping you gauge risk appetite within the altcoin space.
Daily Sentiment Plot: Visualize the daily macro sentiment with a dedicated plot that fluctuates between zones of "High Risk (Euphoria)," "Low Risk (Opportunity)," "Very Low Risk (Panic/Opportunity)," and "Absolute Bottom (Max Despair)." Transparent zone fills make it easy to interpret the prevailing market mood.
Bitcoin/Altcoin Season Bar (4-Hour): At the bottom right of your chart, a dynamic bar visually represents the "Bitcoin Season" to "Altcoin Season" spectrum. This intuitive bar, updated every 4 hours, provides real-time insights into which side of the market is currently attracting more capital and attention. A white indicator line moves across the gradient, showing the current IDRA reading on a normalized 0-100 scale.
Customizable Normalization: Adjust the normalization period to fine-tune IDRA's sensitivity to historical market behavior.
Actionable Alerts: Set up alerts for IDRA's key levels (High, Low, Very Low, Absolute Bottom) to be notified of significant shifts in market sentiment, allowing you to react promptly to potential opportunities or threats.
PFLA: Public Flow & Liquidity Analysis (Daily)
The PFLA component provides a detailed breakdown of capital flows and dominance within key crypto narratives. It acts as a daily snapshot, showing you where the money is moving across different crypto sectors.
Ecosystem Performance: Track the daily performance of major ecosystems like Ethereum, Solana, and BNB Chain, observing their dominance and 24-hour capital flow changes.
Trending Categories: Stay ahead of the curve by monitoring the capital movements and dominance of hot narratives such as DePIN, AI, RWA, and MEME coins.
Layer 1 Insights: Gain a clear understanding of the broader Layer 1 landscape.
Consensus Mechanism Analysis : Compare the performance of Proof-of-Work (PoW) and Proof-of-Stake (PoS) coins.
Stablecoin Dominance: Keep an eye on the overall Stablecoin Dominance within the total crypto market, a crucial indicator of risk aversion or appetite.
Daily Snapshot : Each category displays its current dominance, today's capitalization (in billions), and the daily percentage change, all clearly color-coded (green for positive, red for negative).
Ideal for 4-Hour and Daily Timeframes
This indicator is specifically optimized for use on 4-hour and daily charts, providing both intraday and longer-term perspectives on market sentiment and narrative shifts. The IDRA bar updates every 4 hours for more immediate insights, while the PFLA table provides a daily comprehensive overview.
💡 How to Use It
Bias Confirmation: Use the IDRA plot to confirm your general bias on whether the altcoin market is in a phase of euphoria, fear, or panic.
Opportunity Identification: The "Opportunity" and "Extreme Panic" zones of the IDRA plot can signal opportune moments for accumulation.
Risk Management: The "High Risk/Euphoria" zone of the IDRA plot alerts you to be more cautious or consider profit-taking.
Capital Flow Analysis: The PFLA table instantly shows you which ecosystems and narratives are attracting or losing capital today, helping you identify the strongest trends or areas under pressure.
Bitcoin vs. Altcoin Season: The IDRA Bitcoin/Altcoin Season Bar visually indicates the current market phase.
When the white indicator line is closer to "Bitcoin Season" (left side of the bar), it suggests Bitcoin is outperforming altcoins, and capital is flowing into BTC or larger-cap assets for stability. This might be a time to prioritize Bitcoin trades or be cautious with altcoins.
When the white indicator line is closer to "Altcoin Season" (right side of the bar), it indicates altcoins are outperforming Bitcoin, and capital is rotating into the broader altcoin market, often in search of higher returns. This could signal a more favorable environment for altcoin trading.
Use this bar to quickly assess the broader market's risk appetite: generally, Bitcoin Season implies more risk-off sentiment, while Altcoin Season suggests more risk-on.
Customizable Alerts: Configure alerts on IDRA to receive notifications when the index enters or exits its key zones.
The "IDRA & PFLA Integrated" is an indispensable tool for any cryptocurrency investor or trader seeking a deep understanding of capital flow and altcoin market sentiment.
IDRA + PFLA empowers you with the data you need to make more informed trading and investment decisions in the fast-paced world of cryptocurrencies. Gain a distinct edge by understanding where the smart money is flowing and which narratives are gaining traction.
Please note: This indicator is private and requires an invitation to access.
