EMAs Crypto InvestidorExponential Moving Averages - EMAs Crypto Investor
Indicator developed to facilitate the use of 5 EMAs in a single indicator.
EMAs: 17, 34, 72, 100 and 200 Periods
Developed by Diego do Youtube Channel Crypto Investor
스크립트에서 "crypto"에 대해 찾기

CTC BTFD V3In cryptocurrency trading, It is normal that the price will retrace more than 70% in bear market. The bear market, the coin will be accumulated for the next bull market to come. To benefit in this situation, we need to buy low. The price must be low enough before we can enter the market.
This CTC BTFD Grid system is designed to proof the concept. It works exceptionally well on nearly all crypto. The ruls is simple. buy the fucking dip. Wait for 50% retracement or more before enter the market.

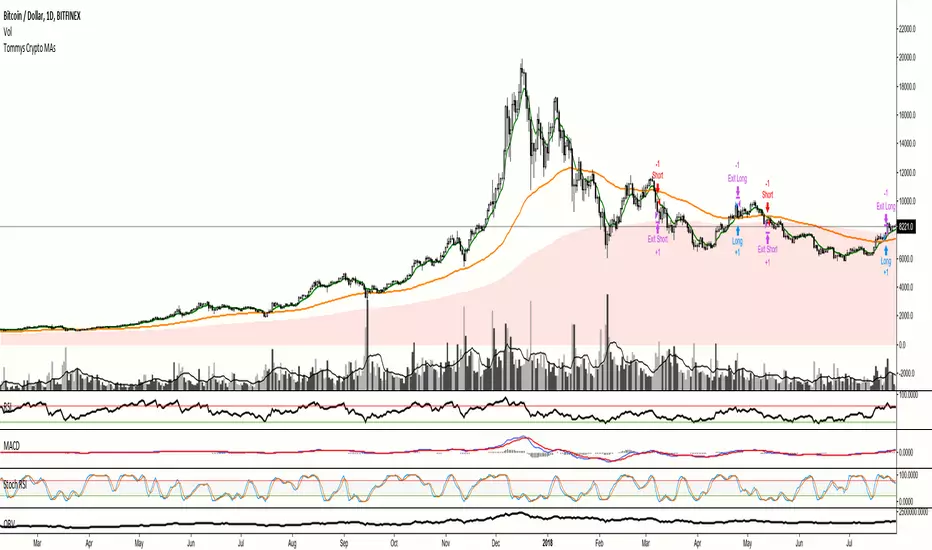
Tommys MA Strategy for CryptoA simple MA-based crossover strategy for crypto. The same as my script for stocks except with different default values. Please note that you have to play around with settings for each asset you wish to use this on to find optimal settings. And optimal settings for a bear market can differ greatly from optimal settings for a bull market, so keep that in mind.
Bitfinex(bfx) Shorts, Longs, Combined Numbers (all crypto pairs)Pretty much Self-explanatory :)
The columns (green and red) are difference in long and short positions during that period. Positive number suggests more number of long positions and vice-versa.
Works for all allowed crypto-pairs.
A similar indicator was published by another user, but sadly he closed the source code
Happy Trading!
Ichimoku Cloud ++I've had several members ask for it, so here it is!
This is the chart setup I use when day trading / swing trading.
It's essentially a crypto adjusted Ichimoku Cloud, along with the 200 EMA and a second "Nagarekomu Cloud"
By default I have the Tenkan-Sen and Kinjun-Sen hidden, but the option is there to turn them on if you prefer.
Basic Options Panel Includes :
Show Tenkan-Sen?
Show Kinjun-Sen?
Show Chikou Span?
Show Kumo?
Show Nagarekomu?
Show 200 EMA?
With this setup I'm looking for Kumo breakouts where the Chikou has a clear path.
The 200 EMA and Nagerekomu are there as extra confirmation as well as support/resistance zones.
0
Also, don't forget to check out some of our other recent script releases:

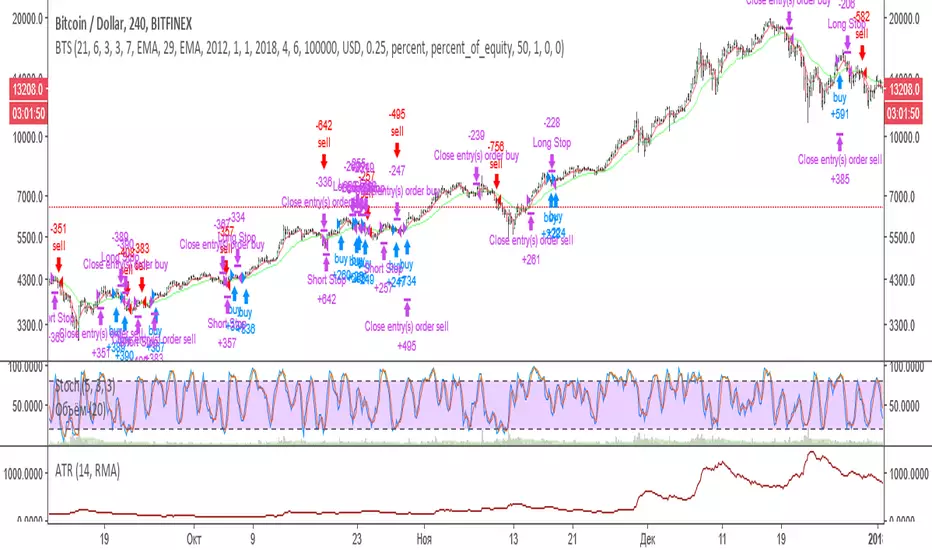
Base Trading StrategyEnglish description:
Following script is the realisation of strategy that discribed in one of educational video on YouTube .
First of all strategy choose trend direction using moving averages and then searching for entry using stochastic and waiting for a price rollback.
Conditions for long entry:
1. Fast MA is under slow MA.
2. Stochastic is increasing.
3. Price fluctuation touch fast MA or is lower then fast MA.
For short entry it uses conditions in reversive way.
Exit conditions:
1.Stop is equal 1 ATR.
2. Fast and slow MAs crossed in the opposite direction.
We set comission in script equal to 0.25% and amount of bet is equal to 50% of deposit by default.
Authors of video recomends to use next settings: 12 EMA, 34 EMA and Stochastic 5,3,3. But judging by backtesting for different pairs absolutely different parameters can match better then this. It's possible to find profitable parameters for stock, forex and crypto markets as well. Anyway this strategy is weak on flat movement and quite well on trend movement.
Описание на русском:
Данный скрипт является реализацией стратегии описанной в этом видео .
Стратегия исопльзует определения тренда по скользящим средним, а затем определяет точки входа, используя стохастик и откат цены.
Условия входа в лонг:
1.Быстра МА должна быть выше медленной МА.
2. Стохастик должен возрастать.
3. Цена должна коснуться или уйти ниже быстрой МА.
Для входа в шорт условия должны быть выполняться в обратную сторону.
Условия выхода:
1. Стоп составляет 1 ATR.
2. Быстрая и медленная скользящие должны персечся в обратном направлении.
Отличие от стратегии видео только в том, что отсутствует тейк-профит. Выход из сделки происходит только по стопу, либо по обратному пересечению скользящих средних. В скрипт по умолчанию вставлена комиссия 0.25% и по умолчанию торг идёт на 50% капитала.
Авторы видео предлагают использовать: 12 EMA , 34 EMA и Stochastic 5,3,3. Но судя по бэктесту по очевидным причинам для разных инструментов подходят абсолютно различные параметры.
Возможно подобрать профитные варианты как для фондового рынка, валютного рынка, так и рынка криптовалют. В любом случае стратегия очень слабо себя ведёт на флете и достаточно не плохо на движении.
В своём канале на YouTube мы выложили разбор данной стратегии на бэктестинге.
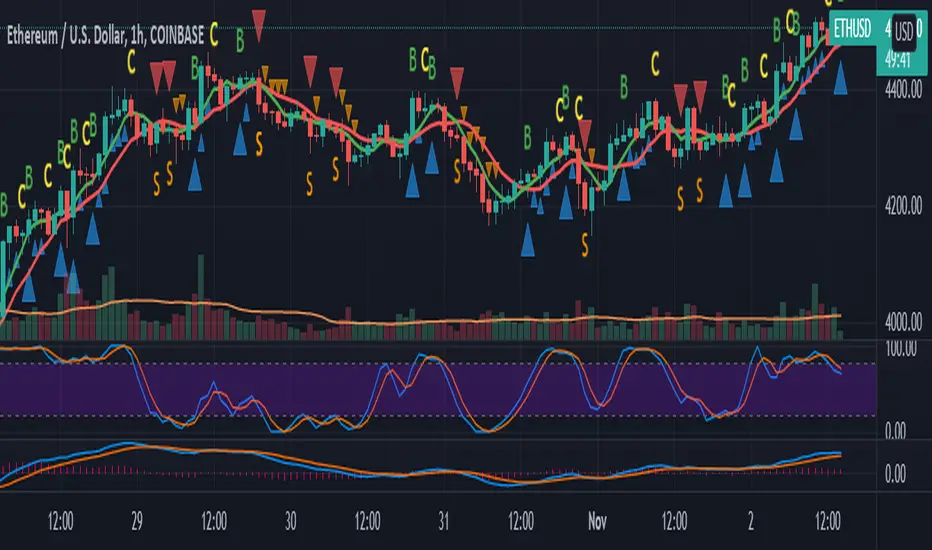
Moving Average with Indicators for Buy, Sell, and CloseoutBuy (B), Change Trend/Closeout (C), and Sell (S) ideas based on moving averages. Created for Cryptocurrencies.
This script is an updated version of and
Initial settings are for 5 and 10 day averages.
Please do your own research and testing.
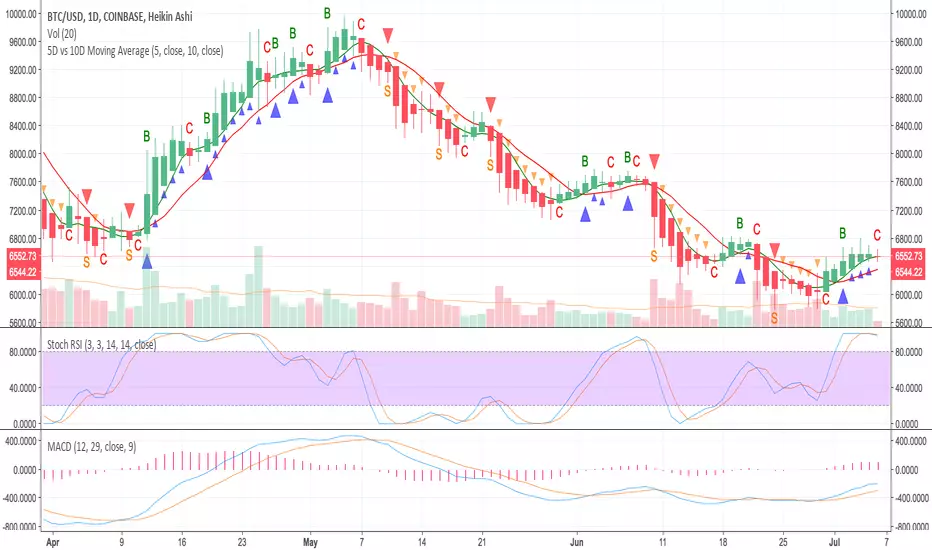
5D vs 10D Moving AverageBuy (B), Change Trend (C), and Sell (S) ideas based on moving averages. Created for Cryptocurrencies.
Do your own research and testing.

5D vs 10D Moving Average with markersBuy (B), Close position (C), and Sell (S) ideas with arrow indicators. Made with Cryptocurrencies in mind.
TT3 indicatorHow does this indicator works and what it is?
It consist of 3 T3 moving averages. T3 moving average was developed by by Tim Tillson and is considered superior to traditional moving averages as it is smoother, more responsive and thus performs better in ranging market conditions as well.
This indicator works on any stock, index, future or cryptocurrency.
The ways how you can use it:
When the price is above the green band, trade with longs
When the price is below the red band, trade with shorts
When the price crosses down Signal T3 while above the green band, close the long position and reopen it only if price breaks up above the Signal T3 and is above green band.
When the price crosses up Signal T3 while below the red band, close short position. If price drops down below Signal T3, open short position again.
The bands are working as supports and resistances. When price is above the green band and drops, there is a high chance it will bounce back as soon as it hits the Long Band T3. (It will act as support)
When price is below the red band and rises, there is a high chance it will bounce back as soon as it hits the Short Band T3 (it will act as resistance)
Any ideas, feedback and comments will be really helpful.
Consider to tip me if this indicator is any use for you and think that I should make more of them to help the community of traders.
ETH: 0xac290B4A721f5ef75b0971F1102e01E1942A4578
BTC: 39p3rKuJYKGqph1Qs35yEfNWoPvpUJBBcy

SignalToSignal.com Volume Trend AdvisorThe Signal to Signal Volume Trend Advisor is a proprietary volume and priced-based trend predictor. Leveraging over 20 years of volume-price trading and systems development, we utilize proprietary Volume Spread Analysis ( VSA ) concepts and internal market dynamics to alert you visually and in real time of an imminent trend change.
The indicator was developed to keep autonomous trading systems on track while a trader is away from their charts. While it is meant to be used in conjunction with other trading systems and methods as a filter or as confluence, VTA also stands strongly on its own.
The trend analysis algorithm indicates trend changes visually and in realtime based on static, non-lagging market information. This means that the Volume Trend Advisor does not and cannot repaint, ensuring any signal received is valid and actionable.
Large moves are captured and even trades that result in a small loss when taken to the next signal generally move some significant amount in the direction of the signal, meaning that given proper trade management, even a failed trend can still be profitable.
Because the indicator works using volume and price data, the Volume Trend Advisor works well on any chart. We personally use the indicator to successfully trade Stocks, Forex, Commodities, and Crypto Charts such as Bitcoin ( BTC ).
To gain access to the Volume Trend Advisor, please visit our website - signaltosignal.com
If you have any questions, please contact us through the Contact link on our website - signaltosignal.com

Tools of the Taint V2Tools of the Taint provides you with most of what you need trading cryptocurrency in terms of chart overlays.
INCLUDED:
--Bitmex XBT Price
--Bitfinex Spot Sentiment (Longs v. Shorts
--SMA, EMA, VWMA, TEMA, and HMA averaging options with 50, 100, 200 preset
--Faster moving average ribbon with multiple average choices
--VWAP and VWAP moving averages
--Ichimoku Cloud with Cryptocurrency presets
--Bollinger Bands with multiple average choices
TIPS:
-- For Bitmex price, turn on "indicator values" right right-clicking the scale, check "priceline" in settings, and decrease transparency in settings. This will show
the price on the scale.
--For Bitfinex spot, due to pinescript's limitations, there is no way to properly scale Longs v. Shorts. To remedy this, I have added a scaling option. Using this
divides the price by the given value. Adjust this number until this indicator no longer causes scaling issues on your chart. For bitcoin, 3 or 4 is a good value.
Keep in mind, by scaling you will be dividing the actual number of longs or shorts by the scaling value. This does nothing to visual compassion between the
two but it does alter the actual number value. Example: Actual number of longs or shorts = (current long or short value) x (scaling value)
--For Bitmex prices or Bitfinex spot, to change from XBT or Bitcoin, simply change the ending of the text area to the pair of your choosing. Check how
Trading View has it listed. Example: Change text to BITFINEX:EOSUSDLONGS for EOS.
--When choosing a moving average type, use only lower case letters.
--To turn off the ribbon fill for the 4th and 5th ma, go to settings and uncheck that box.
I will be making additions to this at a later date. If you have requests, leave them in the comment section.

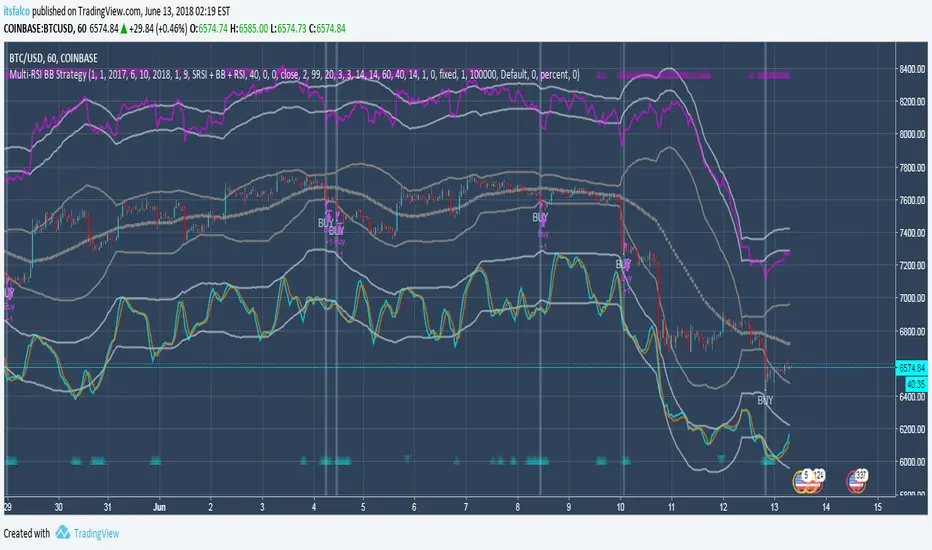
Multi-RSI BB Accompanying Backtesting StrategyVersion 1.0
Purpose
This backtesting strategy indicator is a accompanying tool for use with my popular trading and alert indicator: Multi RSI BB Fast Trader Autoview Alerts Indicator
Reference Indicator Link:
Features
This strategy has been programmed to act exactly how the accompanying indicator would be used with an automated strategy such as Autoview or through manual trading
Has identical coloured signals with correct icons for reference with the indicators standard alert conditions (BUY/SELL)
The ability to toggle on or off all the logic and UI presets you could previously use to enhance the standard indicator
No short / longs for the most accurate representation of buys and sells, The strategy will keep buying on every optimal signal (+1 order quantity each time) and then sell all assets on a met sell condition (-all quantity), matching exactly how the reference indicator is used to buy/sell on eg. Binance and also give the most accurate statistics.
Fully customisable in the settings regarding trading strategy to match exactly how you have the reference indicator set up with alerts or how you are trading manually with it.
Ability to choose a timeframe, want to ignore the crypto boom at the latter stages of 2017? Sure you can, change the time frames in the settings to see a more recent representation of your trades.
Access
This indicator is free for existing owners of my Multi RSI BB Indicator linked above as an accompanying tool to improve their strategy and net more profit. If you would like access to any of my indicators or would like to know more please find me on my community discord channel where you can find indicator details/documentation and general help:
Discord Link: discord.gg
Thank you for the immense support everyone, happy trading!
- Falco
PARSEC Bitcoin strategy for testing: SMA + ADX + Fisher transfStrategy using SMA, ADX and modified Fisher transform (I've made linear transformation on original Ehler's Fisher transform) and implemented into Bitcoin trading perspective.
Current strategy is optimized for Bitcoin.
General objectives is to add, remove indicators:
- to further improve the strategy for Bitcoin
- adjust the strategy to be feasible for wider range of cryptocurrencies (preferably for the top 2-5 or top 2-10 ones), without significantly decreasing the current profit factor and profit rates
Experienced technical analysts feel free to PM me if you want to test the strategy (at this stage up to 5 people's participation would be appreciated).
For those ones who significantly contribute, I will give life-long access to both the improved strategy and alerts.

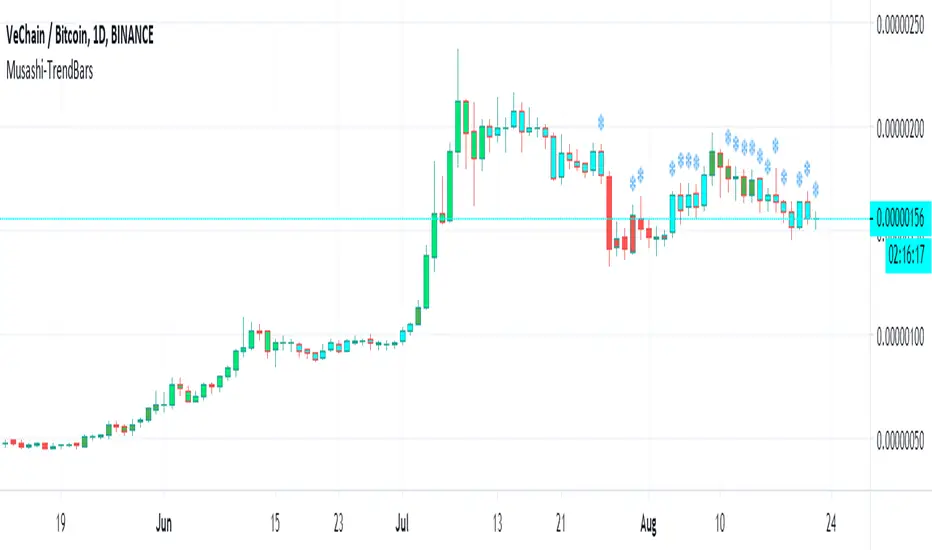
Musashi-TrendBarsThis is a script that has a unique approach to trending. This offers a multi-phase concept of trending, which is shown by a multitude of colors. This non-repainting indicator will predict the phases of trend change and progression. This script is under research at this point, and is considered an alpha version.
LEGAL STUFF:
Risk Disclosure
Futures , forex, stock, crypto and derivative trading contains substantial risk and is not for every investor. An investor could potentially lose all or more than the initial investment. Risk capital is money that can be lost without jeopardizing ones’ financial security or life style. Only risk capital should be used for trading and only those with sufficient risk capital should consider trading. Past performance is not necessarily indicative of future results
Hypothetical Performance Disclosure
Hypothetical performance results have many inherent limitations, some of which are described below. no representation is being made that any account will or is likely to achieve profits or losses similar to those shown; in fact, there are frequently sharp differences between hypothetical performance results and the actual results subsequently achieved by any particular trading program. One of the limitations of hypothetical performance results is that they are generally prepared with the benefit of hindsight. In addition, hypothetical trading does not involve financial risk, and no hypothetical trading record can completely account for the impact of financial risk of actual trading. for example, the ability to withstand losses or to adhere to a particular trading program in spite of trading losses are material points which can also adversely affect actual trading results. There are numerous other factors related to the markets in general or to the implementation of any specific trading program which cannot be fully accounted for in the preparation of hypothetical performance results and all which can adversely affect trading results
QFT Crypto Bottom Feeder v2I use this indicator for testing with alerts and Autoview for buy signals. There are no sell signals, so that is entirely up to you. The goal is to catch the bottoms of small swings buy layering in. You can adjust the base sensitivity as well as how far down it's looking to buy. The buy plots are absolute locations - so where they lie, is where the buy signal alert will fire. Autoview will attempt to place a trade at the time of the alert. The goal here is to buy under the base and sell on the way up or at the support level.
How you use this is entirely up to you. I just play around with these alert signals for testing profitability. If you use this for buying alerts, you're using them at your own risk.
The average base crack % is going to be the lowest layer shown, and the other layers will go up from there. There are 5 layers.
Example: Average Base Crack is 5%
Layer1 = 1% , Layer2 = 2%, Layer3 = 3%, layer 4 = 4%, layer 5 = 5%
Example2: Average Base Crack is 10%
Layer1 = 2%, layer2 = 4%, layer3 = 6%, layer4 = 8%, layer5 = 10%

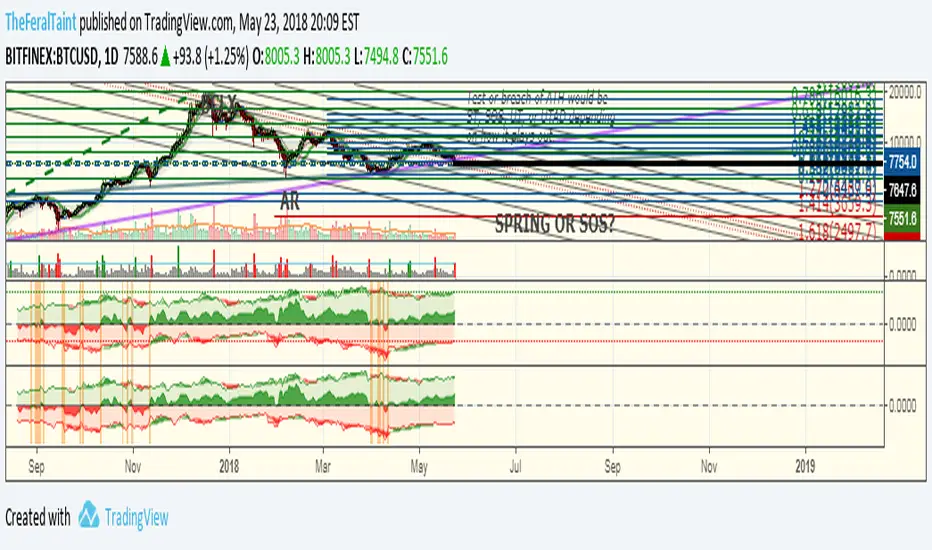
Taint's Crypto Longs v. Shorts
Taint's Longs v. Shorts
This indicator displays the relationship of longs to shorts across futures markets. The default settings are set to Bitfinex BTCUSD Longs and Shorts. You can change these to the markets of your choosing. It's best to leave the averaging to the default settings. Also, if you turn the price lines on for the first two plots, you can see the current number longs or shorts in relation to historical levels.
Middle Signals:
Longs are greater than Shorts = center area green and above zero
Shorts are greater than Longs = center area is red and below zero
These flips are highlighted with orange bars as well
Outer Signals:
The ribbon at the top of the longs and shorts area is used to judge sentiment.
Green Longs and Green Shorts = strong bullish sentiment
Red Longs and Red Shorts = strong bearish sentiment
Green Longs and Red shorts = bullish sentiment could weakening
Red Longs and Green shorts = bearish sentiment could be weakening
You can change the averaging from the defaults (7, 30) if you wish.
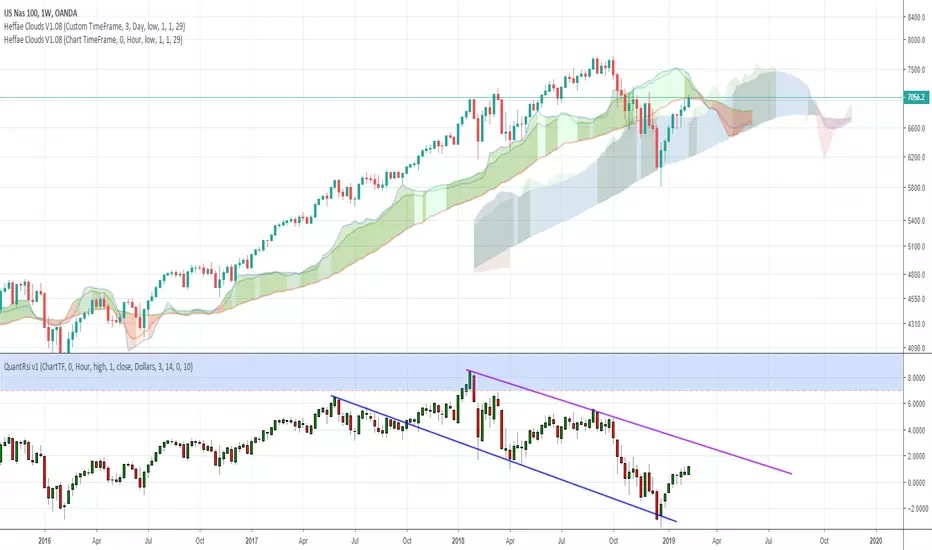
Heffae Clouds v1.00Heffae Clouds v1.0 - Ichimoku Modernized
Heffae Clouds Alpha release Version 1.0
Heffae Clouds functions as adaptive support and resistance. It has real-time paths and offset clouds, similar to ichimoku.
Paths are calculated by the complex discovery of prior behaviour for any crypto or forex asset.
Uses 5 single layer networks to calculate the optimal path fitting for any asset or timeframe.
The cloud color provides granular detail on path validity.
Please see the pastebin link for access information and links:
pastebin.com
Video introduction and trading strategy:
Some Beta-tester comments:
"It's like now having a microscope if you get what I mean. Which says great things about what you have done here. Love it man"
"I just find myself makes so many good decisions with your system it's hard to believe"
"this is without a doubt an improvement of Ichimoku (Which is my favorite tool by far). So much more info with your cloud system.."
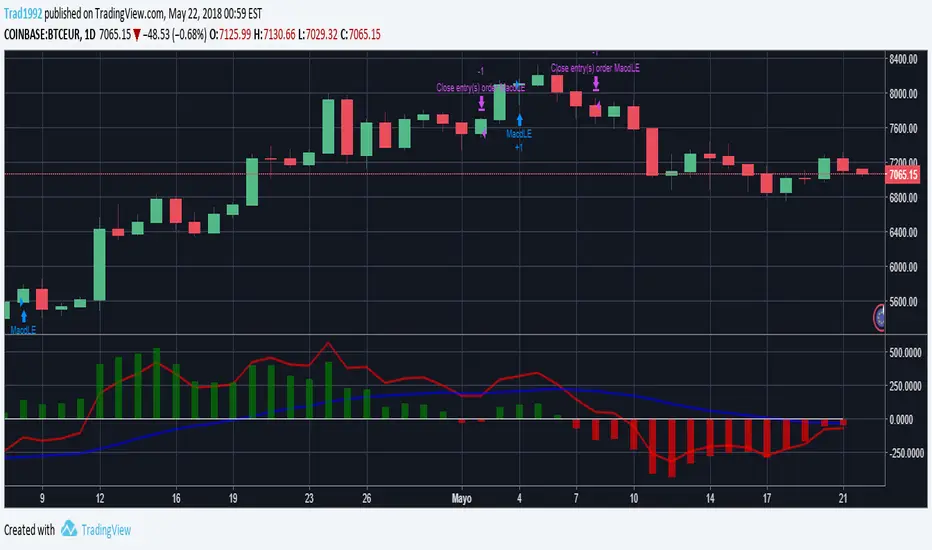
MACD Strategy custom for cryptosIt is a MACD with strategy simulation implemented to "tune" the MACD parameters for cryptos, it only use long and close strategy, not short
Nefitty Cryptowave: Visual Control Lite 90DBest used under the influence of Com Truise
The wave will careen off the top and bottom of the channel. Use it to anticipate possible upcoming support and resistance lines. The midline is usually purple, and turns red when it is higher than the channel ceiling, 45 days back. Intended for daily timeframe only.
This indicator requires additional research:
Are there any leading indicators before the wave smashes into an edge?
How do we read it when it begins tightly hugging one extreme?
Can we use the midway line to predict changes?
That's it for now.
Godspeed, soldier.
- nefitty
Find me on r/cryptocurrency Discord

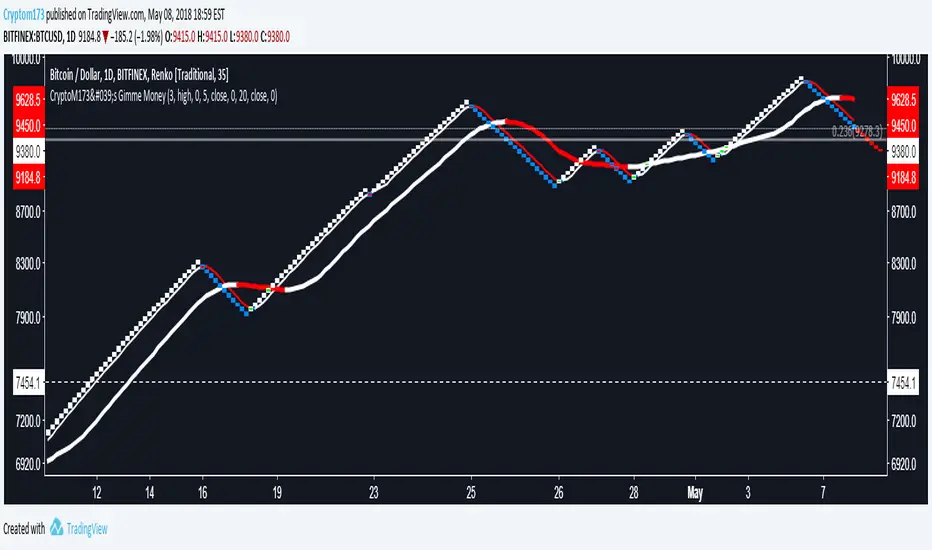
CryptoM173's Gimme MoneyLatest version. Nobody gave me feedback and managing requests to add people became a PITA. Enjoy.
I like money, you like money, this set up has the potential to make a LOT of it. That being said, I do NOTmake any warranties of this making you money, nor do I guarantee you will NOT lose money. In the end, you're the one configuring it and interpreting the results. Providing that you DO set it up correctly and it makes you obscene amounts of money, donations are always welcome (addresses below).
Before you start, it's probably you read EVERYTHING below.
You'll have to do some tweaking of the MA's to find a strat that best suits your needs. It is an indicator you're welcome to use to assist in your trading decisions. I made this script for renko charts and trading bitcoin -1.64% because the standard strat wasn't working out. if you find you're getting a lot of consecutive colored bars or crosses on Renko, you may need to switch from ATR 14 to something like Traditional 50. You will need to adjust the "box value" for traditional renko to fit the asset you're working with, on the time frame you're trading on. Smaller values (i.e. on bitcoin -1.64% I use a box value of 50 on 4hr and 1D with absurd success) but you need to make sure they're not too small, otherwise small moves may appear larger than they are, resulting in a bunch of break-even trades. If you're going to be trading cryptocurrency, it's easiest to switch back to ATR14 to get an idea of the Average Trading range to have a reference point to start from trading btc -1.64% (i.e .000034 rather than 50).
It's a great tool if you're looking to carry both swap and futs positions and keep an eye on the short term swap opportunities while monitoring the status of your futs position and help decide whether or not to close a long at a correction or not and while this strategy has been most effective for me with Renko bars, it's been very useful for monitoring futs positions on traditional charts.
For access, feel free to DM -0.34% me on twitter, @CryptoM173
If you're the generous type, feel free to donate Bitcoin to: 3BMEXWz6Es7iLdi9zAyMWWHHZPNbMKPqrV
EAG Trend FinderHi all,
this strategy is made for trend following and the volatility of cryptocurrencies.
Mainly for the 4H BTC chart even though it does work for alt coins but I haven't tested it on those yet.
This is a hands-on strategy, it doesn't give buy and sell signals without you doing some charting of yourself, try to define trends and use this strategy to find confirmation.
ignore the backtesting data since I made this for the past year and specific scenarios but couldn't figure out how to limit backtesting data so I ignored panel for this strategy.
Hands-on strategy!
Go long ( green boxes ) during up trends and short during down trends(blue boxes), sideways movement is the Achilles heel of this strategy and for that reason, it is important to try and filter the sideways movements as much as you can.
As always,
Happy Hunting!
Still a work in progress!

QFT Crypto Bottom FeederQFT Crypto Bottom Feeder
This indicator is intended to be used with alerts and Autoview for buy signals. I do not have sell signals enabled at the moment. The goal is to catch the bottoms of markets swings. I use this for 1,3 and 5 min charts for small %s. You can adjust the base sensitivity as well as how far down it's looking to buy. Defaults are 3 candles for bases/resistance, .20% below base for buys. The buy plots are absolute locations - so where they lie, is where the buy signal will execute.