OBV for ProfitTrailer by BotIndicatorsThis is a highly adjustable indicator for the ProfitTrailer Crypto Currency Trading Bot.
It showcases a special version of OBV how it is calculated by ProfitTrailer. Due to the limitations in how ProfitTrailer works this does not reflect the values of a classical OBV.
Important note: Due to differences in price update you won't be able to compare the live values calculated by the Bot and the ones on Tradingview. They will likely differ a lot due to different update cycles. We are trying to improve this in the future but we don't know if it cand be handled any better.
Note: This is a first public release, future modifications may follow and are then shown here as updates. Always read this page to the end.
스크립트에서 "crypto"에 대해 찾기

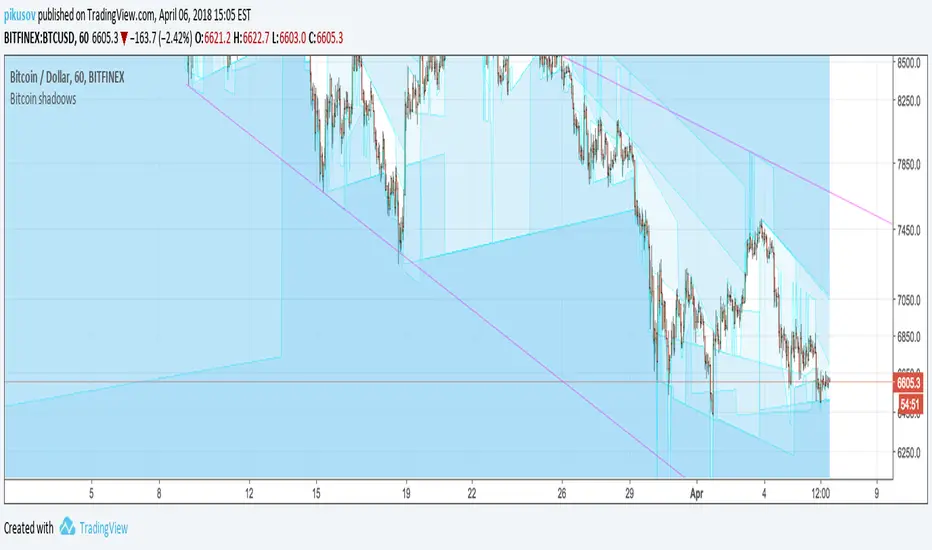
CryptoShadows V1The first Diagonal Support and Resistance indicator. Best for bitcoin and cryptocurrencies

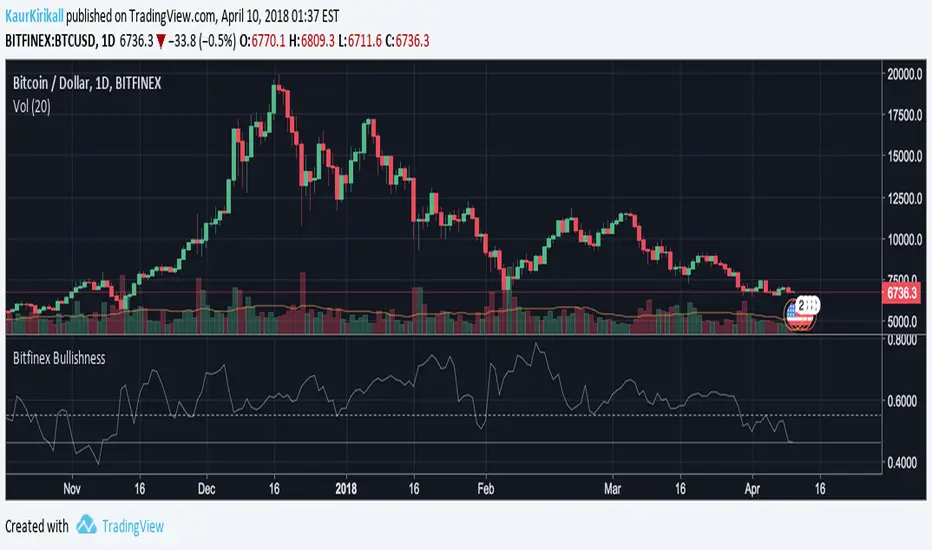
Bitfinex Bitcoin BullishnessBased on contrary opinion in futures, I've adjusted this to Bitcoin, more thoroughly Bitfinex margin longs & shorts. Those unfamiliar with the concept, contrary opinion illustrates the psychological sentiment in the market by determining the degree of bullishness or bearishness among participants in the market.
The principle holds that when the majority of people agree on anything, they are generally wrong, so following the principle you would analyse and look to take the other side of the trades.
Consider this, once the market is extremely bullish, all bulls have already entered the market to an extent that one can't commit any more funds to the position. Even though Bitfinex margin positions are not like future trading, that every short must have someone taking the long side, one should understand that the majority of people do not make money on the market, so whenever this indicator goes too low or too high, one should look for a trend reversal.
This indicator is in the range of 0 to 1 and the neutral position for a "healthy" market is 0.55ish. Some adjustments should probably be made according to the cryptocurrency markets and I might add this in the future updates, but as of now it's a good indicator for forecasts and to get a bigger picture on a timeframe of 1 DAY or longer charts.
The base of the indicator is simple, amount of longs divided by the sum of shorts and longs.
Also you can see, how only now, 10th of April, we are hitting new lows in the bearishness of the market.
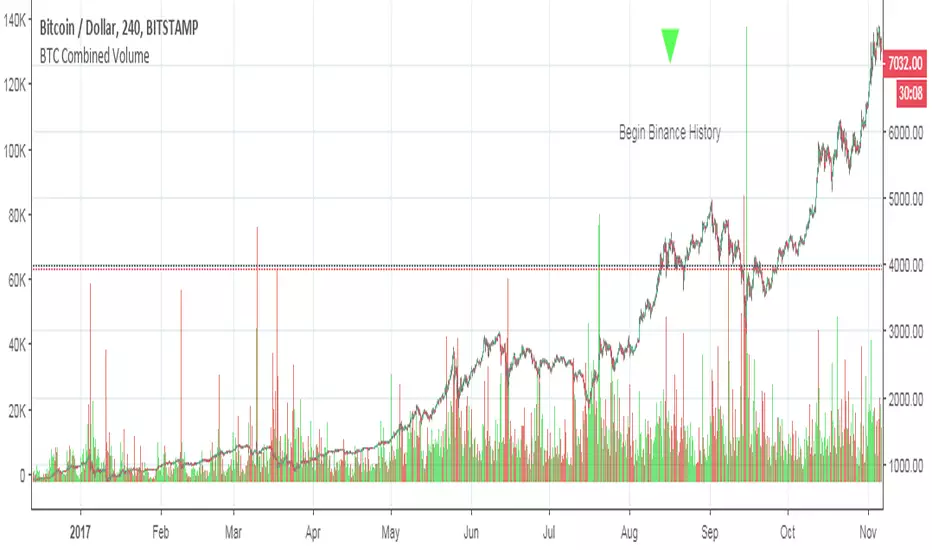
BTCUSD Combined VolumeThis script sums the volume for BTCUSD across several popular exchanges. I share it not so much as an indicator as a tool to use in other indicators (i.e. those that rely on volume, which often do not work very well for crypto due to the low volumes). Similar sums could easily be created for other currency, and with a little thought I could probably add the ability to parameterize the currency (e.g. type "BTCUSD" or "ETHBTC" or "LTCUSD" or whatever as an input).
I got the idea from seeing someone asking in chat whether it is possible to combine volumes across multiple exchanges, so kudos to oh92 and paaax for the neat idea.
Please feel free to incorporate this in your own indicators as you like...and of course if you're feeling generous, tips are appreciated. Thank you!
BTC
3KmFchJ18QvMzAJKDcFQXvyK9p1EHWQdhP
BCH
qqtrw64ptuwprk5vtj3z8qwkvh3v0jawxq7khqng7x
ETH
0x9b51361A278910Ba3945C7519C9f0FA8a77df18d
LTC
MDeWWsP7XCG2zQuZ2dYALZXQ52u2qkc8fh

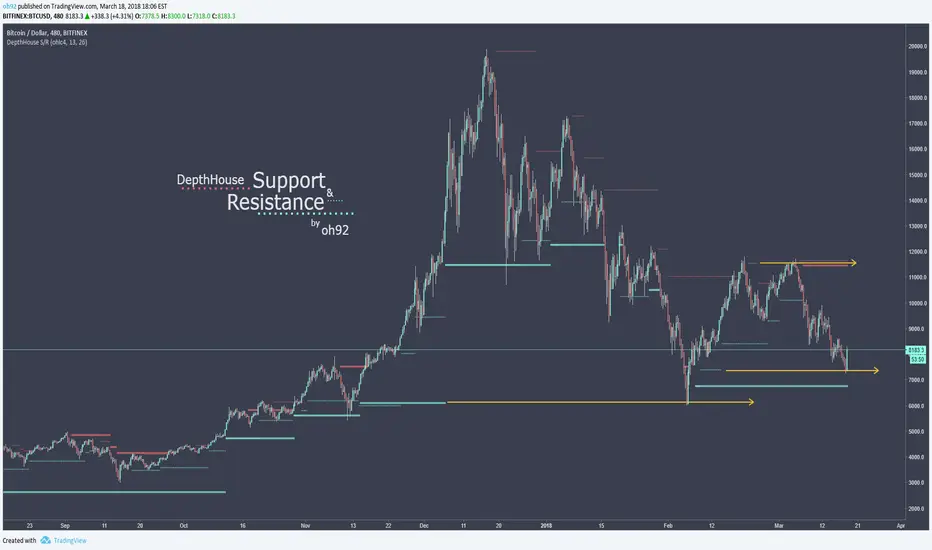
DepthHouse - Support and Resistance IndicatorDepth House Support & Resistance Indicator is a custom trading tool designed to help traders locate possible support and resistance levels on stocks, cryptocurrencies, and all forex pairs.
A fantastic tool on all time frames.
Here is a video which I give a brief overview and show it in action:
youtu.be
How it works:
Based on the default settings, the ticker dots represent strong support and resistance while the smaller lines tend to represent weaker support/resistance.
As shown on the chart above, even after a line stops plotting, it still serves as possible support and/or resistance.
Changing the settings completely alters the support lines, so adjust and find what works best for you!
How to get:
As you can see this is an invite only script. In the coming months this indicator, along with many others will become pay to use only. (website on my profile page)
However all my indicators will be FREE until May 1, 2018 . So please try them out!
To take advantage of this FREE trial:
1. Subscribe to my YouTube channel. I have many more videos to come! Maybe even leave a comment of what you would like to see next!
2. Comment on this indicator post! Maybe even give me a follow :D
I hope you all enjoy!!
Indicator website: depthhouse.com
SMACROSS for ProfitTrailer by BotIndicatorsThis is a highly adjustable indicator for the ProfitTrailer Crypto Currency Trading Bot.
You can use it to visualize the SMACROSS buy strategy. Here is how it works:
Set the candle size by setting your TV candle time accordingly
Set the candles used for Slow and Fast SMA Lines in the settings of this Indicator
Set the cross candles according to your needs.
Also set the buy value you would like to use on your bot to visualize the buy zones. You can set it either positive or negative.
The indicator will then show the Fast SMA, Slow SMA as well as the areas where the actual price exceeds the buy value you have set and would generate a buy signal for Profit Trailer. Please keep in mind that Profit Trailer may still use trailing buy and trailing profit to optimize your buy/sell situation, this can obviously not be shown through this indicator.
Note: This is a first public release, future modifications may follow and are then shown on this site as updates. Always read this page to the end.

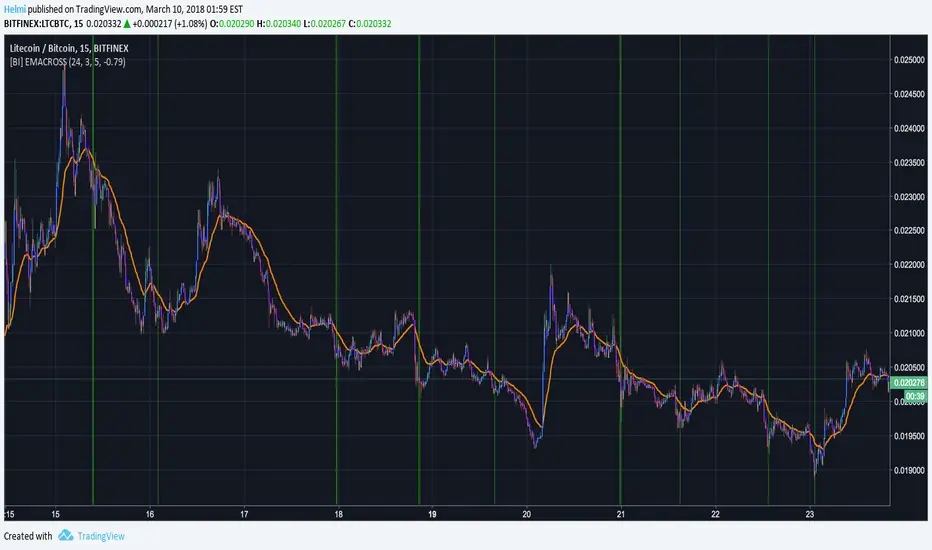
EMACROSS for ProfitTrailer by BotIndicatorsThis is a highly adjustable indicator for the ProfitTrailer Crypto Currency Trading Bot.
You can use it to visualize the EMACROSS buy strategy. Here is how it works:
Set the candle size by setting your TV candle time accordingly
Set the candles used for Slow and Fast EMA Lines in the settings of this Indicator
Set the cross candles according to your needs.
Also set the buy value you would like to use on your bot to visualize the buy zones. You can set it either positive or negative.
The indicator will then show the Fast EMA, Slow EMA as well as the areas where the actual price exceeds the buy value you have set and would generate a buy signal for Profit Trailer. Please keep in mind that Profit Trailer may still use trailing buy and trailing profit to optimize your buy/sell situation, this can obviously not be shown through this indicator.
Note: This is a first public release, future modifications may follow and are then shown on this site as updates. Always read this page to the end.
WY Tame the Crypto MarketStrategy utilizes a combination of EMAs, RSIs, EMA of RSIs with adjustable ranges for a wide range of crypto trading flexibility.

WY Tame the Crypto MarketStrategy utilizes a combination of EMAs, RSIs, EMA of RSIs with adjustable ranges for a wide range of crypto trading flexibility.

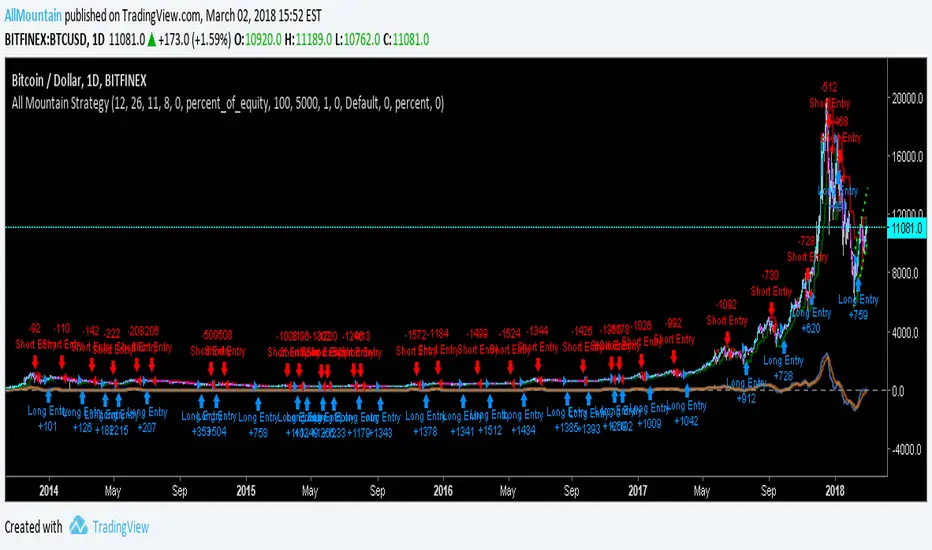
All Mountain StrategyBest use in cryptocurrency.
Use on daily chart for best results.
This strategy does not repaint. It works with trend trackers.
The strategy closes one operation on the inverse signal and initiates another trade.
Good Luck!
Bitcoin donations:: 19fGUD9WXNHxtPE4v2ugbNjqp5dT9VVE3N
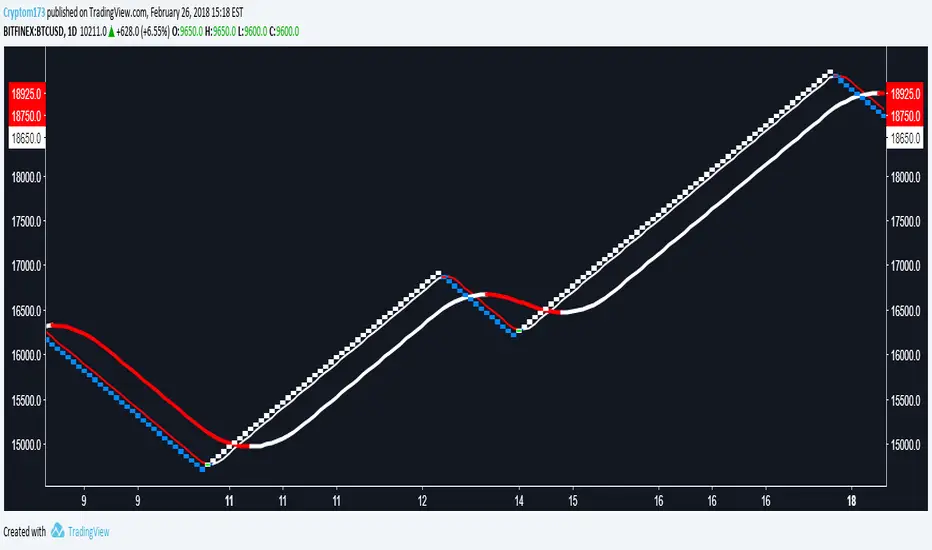
CryptoM173's Gimme Money v1.1I like money, you like money, this set up has the potential to make a LOT of it. That being said, I do NOT make any warranties of this making you money, nor do I guarantee you will NOT lose money. In the end, you're the one configuring it and interpreting the results. Providing that you DO set it up correctly and it makes you obscene amounts of money, donations are always welcome (addresses below).
Before you start, it's probably you read EVERYTHING below.
You'll have to do some tweaking of the MA's to find a strat that best suits your needs. It is an indicator you're welcome to use to assist in your trading decisions. I made this script for renko charts and trading bitcoin because the standard strat wasn't working out. if you find you're getting a lot of consecutive colored bars or crosses on Renko, you may need to switch from ATR 14 to something like Traditional 50. You will need to adjust the "box value" for traditional renko to fit the asset you're working with, on the time frame you're trading on. Smaller values (i.e. on bitcoin I use a box value of 50 on 4hr and 1D with absurd success) but you need to make sure they're not too small, otherwise small moves may appear larger than they are, resulting in a bunch of break-even trades. If you're going to be trading cryptocurrency, it's easiest to switch back to ATR14 to get an idea of the Average Trading range to have a reference point to start from trading btc (i.e .000034 rather than 50).
It's a great tool if you're looking to carry both swap and futs positions and keep an eye on the short term swap opportunities while monitoring the status of your futs position and help decide whether or not to close a long at a correction or not and while this strategy has been most effective for me with Renko bars, it's been very useful for monitoring futs positions on traditional charts.
For access, feel free to DM me on twitter, @CryptoM173
If you're the generous type, feel free to donate Bitcoin to: 3BMEXWz6Es7iLdi9zAyMWWHHZPNbMKPqrV

Stochastic + Stochastic RSIJust a basic indicator I rigged up to help reduce screen real estate that ended up providing more insight than expected; overlays both the stochastic and stochastic RSI. While I initially made this to save space, I've begun to pick up on some interesting patterns in cryptocurrencies based on the divergence of stochastic from the stochastic RSI, and the comparison of their swing lows.
Left all settings modifiable, since this is simply a combination indicator I've left the source code open unlike other proprietary indicators I use.
Happy trading!
Austin Doyle
CTO
Crypto Playhouse

PD STRAT v1PD STRAT is built for volatil markets like cryptocurrency. This will not repaint!
First group of people that ask for an invite, will have it for free :)

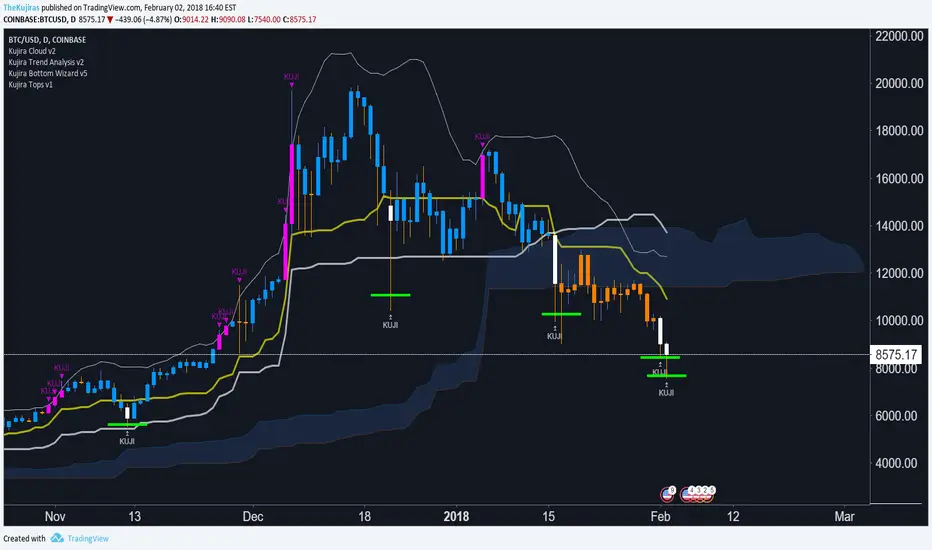
Kujira Ultimate v5 (Crypto)A complete Multi-Tool with Kuji Cloud and overbought/oversold power loss indicators. Power icons generally lead to price coming back to conversion line (yellow thick line).

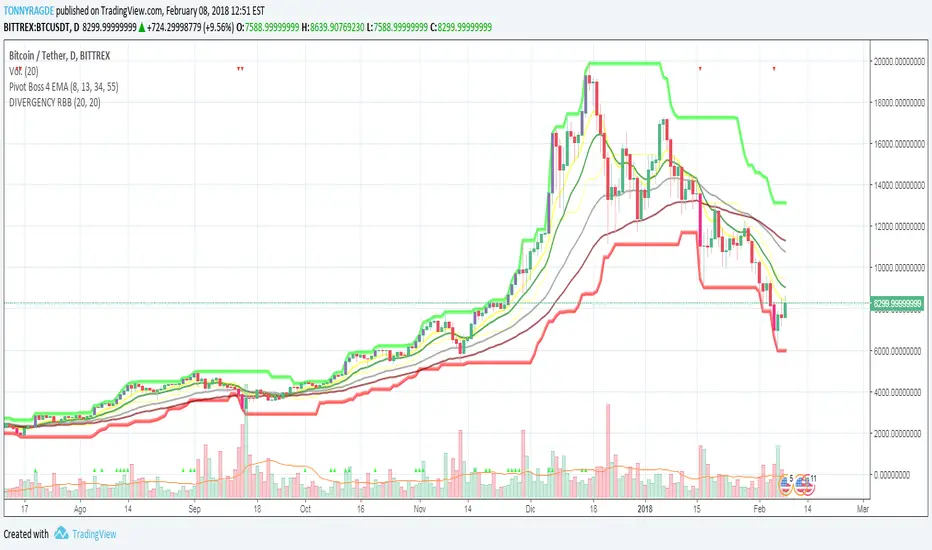
DIVERGENCY RBBIT IS AN INDICATOR THAT GIVES US SELAÑES OF DIVERGENCES AND IS VERY USEFUL IN CRYPTO MARKETS COINS
Quadruple Moving Averages For Day TradingQuadruple Moving Averages For Day Trading Crypto
Inputs of 8,13,21,55
Based on chart used by Philakone.

Kujira Bottom Wizard v7.1Bottom finder for Cryptocurrencies - updated to include higher volatility in S* coins as well as top 100 marketcaps.


Kujira Tops v1For use with trend lines! Sell when the bar turns color and if the bar breaks a trend line down. If no trend lines are broken, then do not sell. This works well with cryptocurrency and high volatility stocks.