EPS AIThis indicator can be accessed by ANYONE by searching in the public indicator library located at the top of your chart!
Enjoy!
Introduction
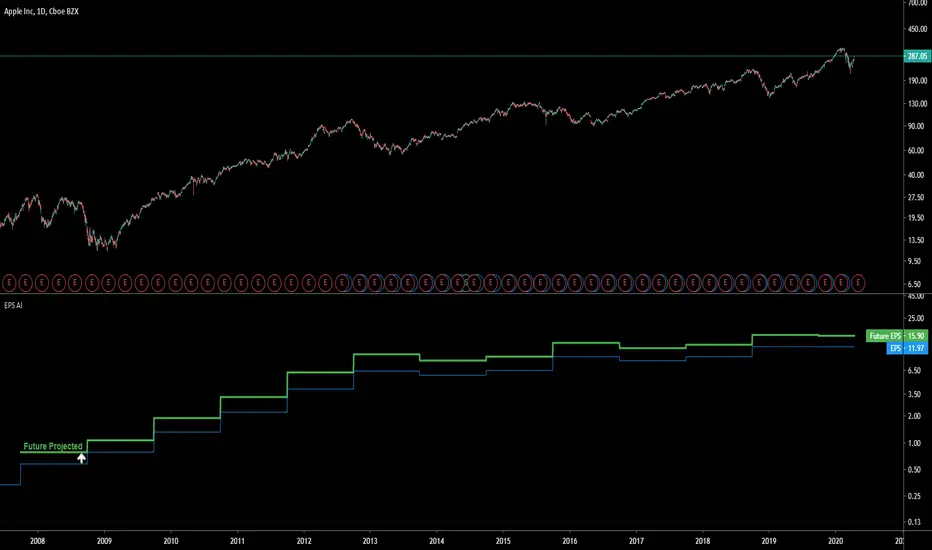
This indicator uses machine learning to predict the next Earnings Per Share (EPS) figure.
The algorithm learns from previous figures in order to more accurately predict the next.
As time continues, this indicator will become more accurate as it learns from an increased amount of data from earnings results.
When the Future Projected EPS is positive, the line will appear green . When the Future Projected EPS is negative, the line will appear as red and sit below the EPS.
Settings Panel
The settings panel contains two tick-boxes.
Quarterly Earnings : When selected, the EPS and future projected EPS will utilise quarterly results. Yearly results are used by default.
Diluted EPS : When selected, the Diluted EPS and future projected Diluted EPS will be utilised. Basic EPS is used by default.
Indicator Utility
The EPS AI can be utilised on every securities instrument and time-frame.
This indicator has been built in Pinescript V4 and will operate in real-time.
This indicator can be accessed by ANYONE by searching in the public indicator library located at the top of your chart!
Enjoy!
Machinelearning
ANN BTC MTF Golden Cross Period MACDHi, this is the MACD version of the ANN BTC Multi Timeframe Script.
The MACD Periods were approximated to the Golden Cross values.
MACD Lengths :
Signal Length = 25
Fast Length = 50
Slow Length = 200
Regards.

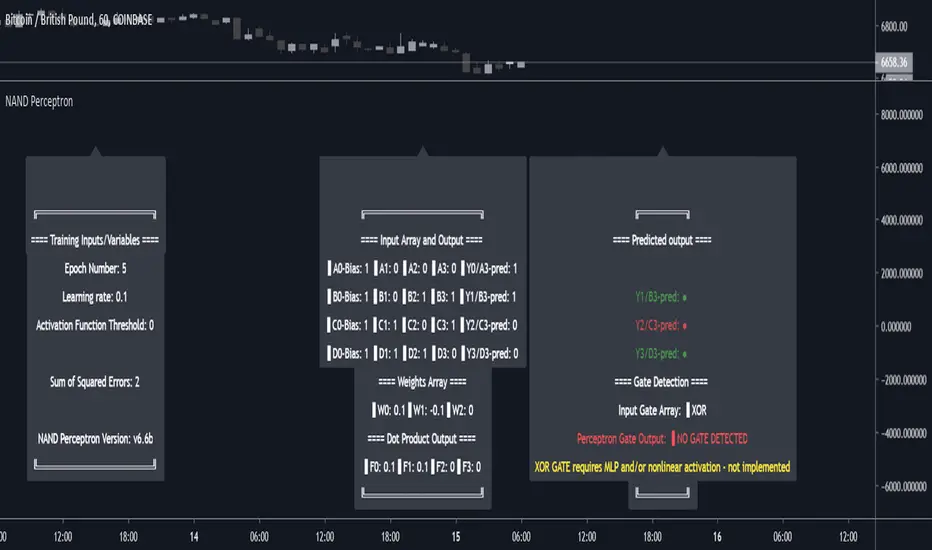
NAND PerceptronExperimental NAND Perceptron based upon Python template that aims to predict NAND Gate Outputs. A Perceptron is one of the foundational building blocks of nearly all advanced Neural Network layers and models for Algo trading and Machine Learning.
The goal behind this script was threefold:
To prove and demonstrate that an ACTUAL working neural net can be implemented in Pine, even if incomplete.
To pave the way for other traders and coders to iterate on this script and push the boundaries of Tradingview strategies and indicators.
To see if a self-contained neural network component for parameter optimization within Pinescript was hypothetically possible.
NOTE: This is a highly experimental proof of concept - this is NOT a ready-made template to include or integrate into existing strategies and indicators, yet (emphasis YET - neural networks have a lot of potential utility and potential when utilized and implemented properly).
Hardcoded NAND Gate outputs with Bias column (X0):
// NAND Gate + X0 Bias and Y-true
// X0 // X1 // X2 // Y
// 1 // 0 // 0 // 1
// 1 // 0 // 1 // 1
// 1 // 1 // 0 // 1
// 1 // 1 // 1 // 0
Column X0 is bias feature/input
Column X1 and X2 are the NAND Gate
Column Y is the y-true values for the NAND gate
yhat is the prediction at that timestep
F0,F1,F2,F3 are the Dot products of the Weights (W0,W1,W2) and the input features (X0,X1,X2)
Learning rate and activation function threshold are enabled by default as input parameters
Uncomment sections for more training iterations/epochs:
Loop optimizations would be amazing to have for a selectable length for training iterations/epochs but I'm not sure if it's possible in Pine with how this script is structured.
Error metrics and loss have not been implemented due to difficulty with script length and iterations vs epochs - I haven't been able to configure the input parameters to successfully predict the right values for all four y-true values for the NAND gate (only been able to get 3/4; If you're able to get all four predictions to be correct, let me know, please).
// //---- REFERENCE for final output
// A3 := 1, y0 true
// B3 := 1, y1 true
// C3 := 1, y2 true
// D3 := 0, y3 true
PLEASE READ: Source article/template and main code reference:
towardsdatascience.com
towardsdatascience.com
towardsdatascience.com
CBOE PCR Factor Dependent Variable Odd Generator This script is the my Dependent Variable Odd Generator script :
with the Put / Call Ratio ( PCR ) appended, only for CBOE and the instruments connected to it.
For CBOE this script is more accurate and faster than Dependent Variable Odd Generator. And the stagnant market odds are better and more realistic.
Do not use for timeframe periods less than 1 day.
Because PCR data may give repaint error.
My advice is to use the 1-week bars to gain insight into your analysis.
This code is open source under the MIT license. If you have any improvements or corrections to suggest, please send me a pull request via the github repository github.com
I hope it will help your work.Best regards!

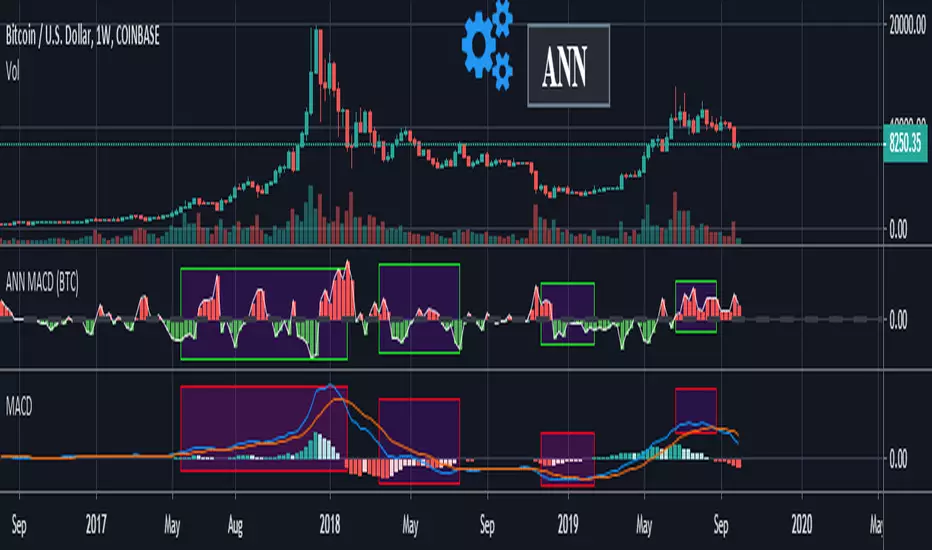
ANN MACD (BTC)
Logic is correct.
But I prefer to say experimental because the sample set is narrow. (300 columns)
Let's start:
6 inputs : Volume Change , Bollinger Low Band chg. , Bollinger Mid Band chg., Bollinger Up Band chg. , RSI change , MACD histogram change.
1 output : Future bar change (Historical)
Training timeframe : 15 mins (Analysis TF > 4 hours (My opinion))
Learning cycles : 337
Training error: 0.009999
Input columns: 6
Output columns: 1
Excluded columns: 0
Grid
Training example rows: 301
Validating example rows: 0
Querying example rows: 0
Excluded example rows: 0
Duplicated example rows: 0
Network
Input nodes connected: 6
Hidden layer 1 nodes: 8
Hidden layer 2 nodes: 0
Hidden layer 3 nodes: 0
Output nodes: 1
Learning rate : 0.6 Momentum : 0.8
More info :
EDIT : This code is open source under the MIT License. If you have any improvements or corrections to suggest, please send me a pull request via the github repository github.com
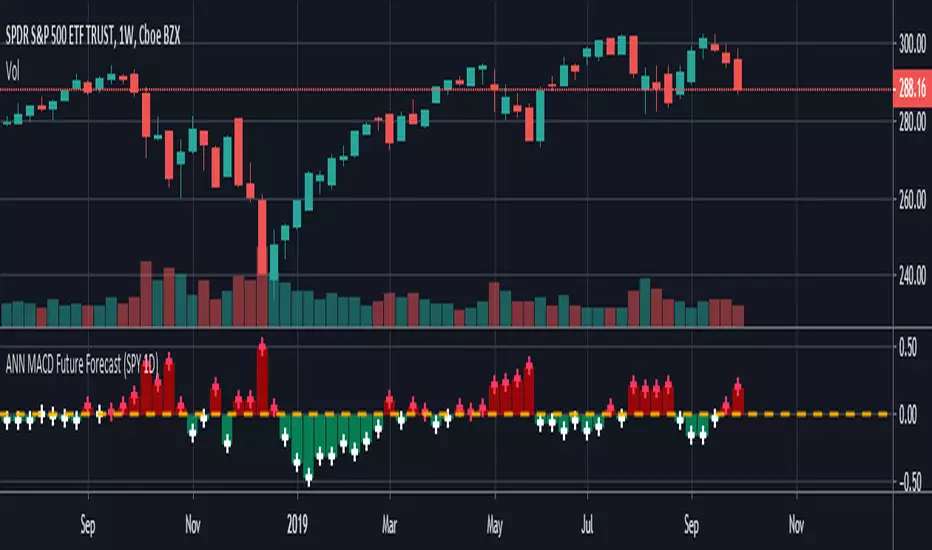
ANN MACD Future Forecast (SPY 1D) NOTE : Deep learning was conducted in a narrow sample set for testing purposes. So this script is Experimental .
This system is based on the following article and is inspired by an external program:
hackernoon.com
None of the artificial neural networks in Tradingview work and are not based on completely correct logic. Unlike others in this system:
IMPORTANT NOTE: If the tangent activation function is used, the input data must also have tangent values (compared to the previous values of 1 bar).
Inputs were prepared according to this judgment.
1. The tangent function which is the activation function is written correctly. (The tangent function in the article: ActivationFunctionTanh (v) => (1 - exp (-2 * v)) / (1 + exp (-2 * v)))
2. Missing bias parts in the formulas were added.
3. The output function is taken from the next day (historical), so that the next bar can be predicted, which is the truth.
4.The forecast value of the next bar is subtracted from the current bar change and the market direction is determined.
5.When the future forecast and the current close are added together, the resulting data is called seed.
The seed carries data both from the present and from yesterday and from the future.
6.And this seed was subjected to the MACD method.
Thus, due to exponential averages, more importance will be given to recent developments and
The acceleration situations will show us the direction.
However, a short position should be taken for crossover and a long position for crossunder .
Because the predicted values work in reverse.Even though we use the same period (9,12,26) it is much faster!
7. There is no future code that can cause Repaint.
However, the color after closing should be checked.
The system is completely correct.
However, a very narrow sample was selected.
100 data: Tangent diffs ; volume change, bollinger bands values changes (Upband , Midband , Lowband) and LazyBear's Squeeze Momentum Indicator (SQZMOM_LB) change and the next bar data (historical) price change were put into the deep learning test.
IMPORTANT NOTE : The larger the sample set and the more effective dependent variables, the higher the hit rate of the deep learning test!
EDIT : This code is open source under the MIT License. If you have any improvements or corrections to suggest, please send me a pull request via the github repository github.com
Stay tuned. Best regards!
Dependent Variable Odd Generator For Machine Learning TechniquesCAUTION : Not suitable for strategy, open to development.
If can we separate the stagnant market from other markets, can we be so much more accurate?
This project was written to research it. It is just the tiny part of the begining.
And this is a very necessary but very small side function in the main function. Lets start :
Hi users, I had this idea in my mind for a long time but I had a hard time finding the parameters that would make the market stagnant. This idea is my first original command system. Although it is very difficult to make sense of the stagnant market, I think that this command system can achieve realistic proportions. With 's money flow index, I opened the track to determine the level. On the other hand, the prices were also using a money flow index, and it forced me to make the limitations between the levels in a logical way. But the good thing is that since the bollinger bandwidth uses a larger period, we are able to print normal values at extreme buy and sell values.
In terms of price, we can define excessive purchase and sale values as the period is smaller. I have repeatedly looked at the limit values that determine the bull, bear, and bollinger bandwidth (mfi), and I think this is the right one. Then I have included these values in the probability set.
The bull and bear market did not form the intersection of the cluster, and because there are connected events, the stagnant market, which is the intersection, will be added to the other markets with the same venn diagram logic and the sum of the probability set will be 1. is equal to. I hope that we can renew the number generators in the very important parameters of machine learning such as Markov Process with generators dependent on dependent variables, which bring us closer to reality. This function is open to development and can be made of various ideas on machine learning. Best wishes.
This code is open source under the MIT license. If you have any improvements or corrections to suggest, please send me a pull request via the github repository github.com

Correlate 21 coinsHey!
I remade some dude's script to add more coins.
Its a pearson correlation indicator, which would give us an idea of the main trend and behaviour of the pairs you choose.

Megalodon
Why Megalodon?
We believe that enlightening others is an incredible way to make this world a better place. That's why we created the tools you need to stop worrying about your investments and focus on what really matters in your life.
What is Megalodon?
Megalodon uses Artificial Intelligence that combines 574 back-tested indicators and 2674 back-tested setups, simultaneously.
Megalodon works with any kind of asset , market state and time frame .
What is the win rate?
Megalodon is extremely accurate and offers insane profits as long as the fundamental analysis is done right .
Backtesting results can be found on our social media or down below .
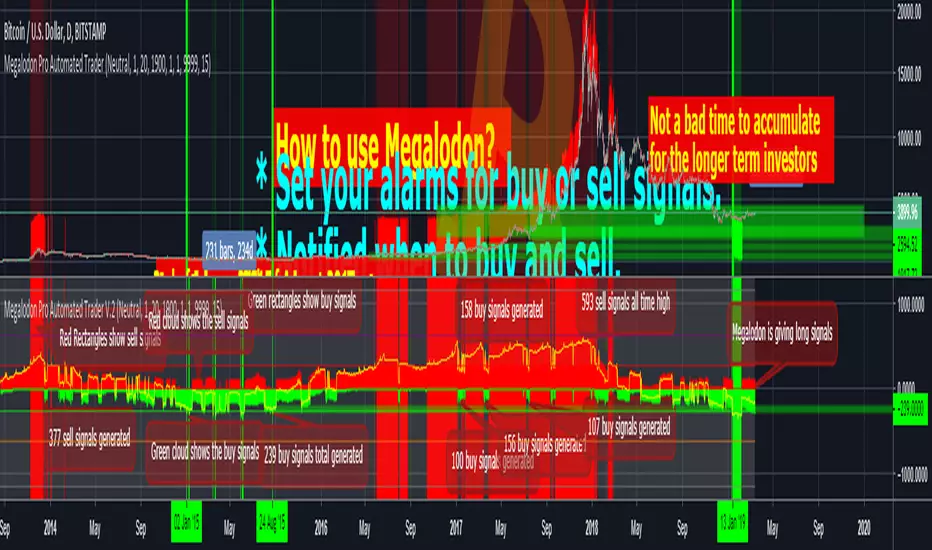
How to use Megalodon Pro Automated Trader?
Simply, orange rectangles are buy signals and purple rectangles are sell signals .
Green clouds show buy signals and red clouds show sell signals.
Yellow line shows the difference between buy and sell counts.
How to set alarms on Megalodon Pro Automated Trader?
Click on Alert, select Megalodon Pro Automated Trader and click on Buy-Signal or Sell-Signal. More details can be found on our social media.
You may also watch our Megalodon Investing Tutorials on Youtube for more information.
How to purchase?
Megalodon is totally FREE .
You may upgrade to Megalodon Pro for the most important features , including automizing your trading on any asset profitably, setting up alarms to get notified , joining to our VIP telegram channel to get daily updates and our VIP telegram group to interact with the community. Simply go to our website on our TradingView page for learning more and joining us for free.
Some of the backtesting results are:
BTC/USD for longer time frame trading in the bear market for the last year.
APPLE for longer time frame trading in the bull market for the last 10 years.
EURO/USD for day trading in the neutral market for the last month.
BTC/USD for day trading in the bull market for the last 15 days.
APPLE for day trading in the neutral market for the last 2 days and 6 hours.
Megalodon Pro Automated Trader BackTester
Why Megalodon?
We believe that enlightening others is an incredible way to make this world a better place. That's why we created the tools you need to stop worrying about your investments and focus on what really matters in your life.
What is Megalodon?
Megalodon uses Artificial Intelligence that combines 574 back-tested indicators and 2674 back-tested setups, simultaneously.
Megalodon works with any kind of asset , market state and time frame .
What is the win rate?
Megalodon is extremely accurate and offers insane profits as long as the fundamental analysis is done right .
Backtesting results can be found on our social media or down below .
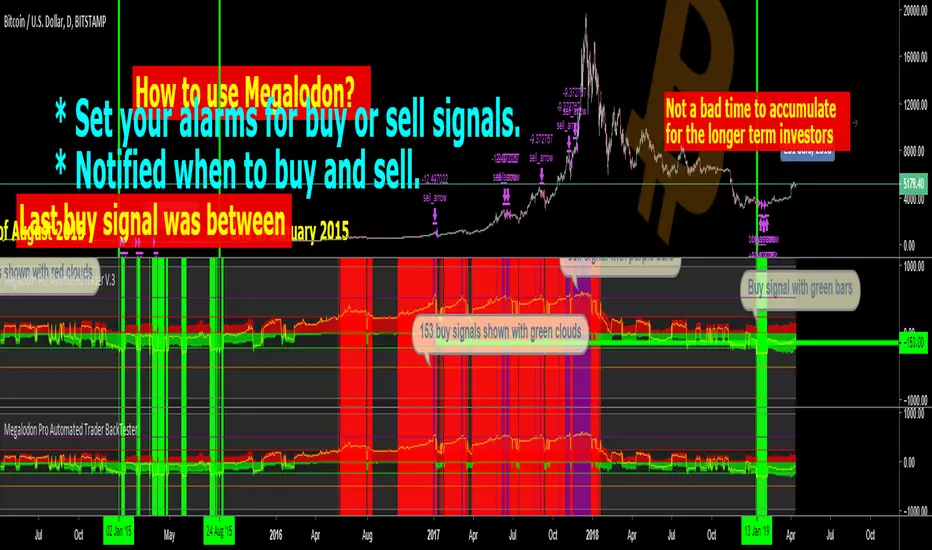
How to use Megalodon Pro Automated Trader?
Simply, orange rectangles are buy signals and purple rectangles are sell signals .
Green clouds show buy signals and red clouds show sell signals.
Yellow line shows the difference between buy and sell counts.
How to set alarms on Megalodon Pro Automated Trader?
Click on Alert, select Megalodon Pro Automated Trader and click on Buy-Signal or Sell-Signal. More details can be found on our social media.
You may also watch our Megalodon Investing Tutorials on Youtube for more information.
How to purchase?
Megalodon is totally FREE .
You may upgrade to Megalodon Pro for the most important features , including automizing your trading on any asset profitably, setting up alarms to get notified , joining to our VIP telegram channel to get daily updates and our VIP telegram group to interact with the community. Simply go to our website on our TradingView page for learning more and joining us for free.
Some of the backtesting results are:
BTC/USD for longer time frame trading in the bear market for the last year.
APPLE for longer time frame trading in the bull market for the last 10 years.
EURO/USD for day trading in the neutral market for the last month.
BTC/USD for day trading in the bull market for the last 15 days.
APPLE for day trading in the neutral market for the last 2 days and 6 hours.
Megalodon Pro Automated Trader
Why Megalodon?
We believe that enlightening others is an incredible way to make this world a better place. That's why we created the tools you need to stop worrying about your investments and focus on what really matters in your life.
What is Megalodon?
Megalodon uses Artificial Intelligence that combines 574 back-tested indicators and 2674 back-tested setups, simultaneously.
Megalodon works with any kind of asset , market state and time frame .
What is the win rate?
Megalodon is extremely accurate and offers insane profits as long as the fundamental analysis is done right .
Backtesting results can be found on our social media or down below .
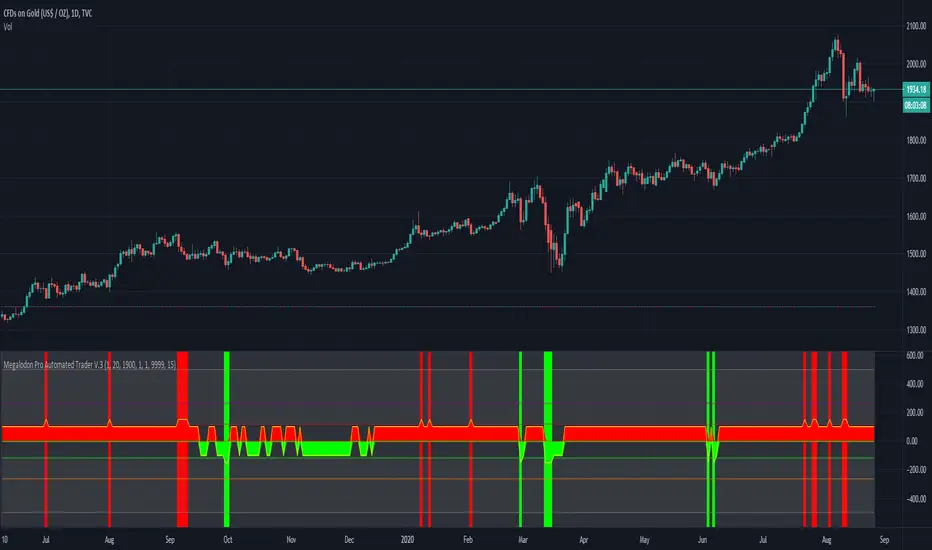
How to use Megalodon Pro Automated Trader?
Simply, orange rectangles are buy signals and purple rectangles are sell signals .
Green clouds show buy signals and red clouds show sell signals.
Yellow line shows the difference between buy and sell counts.
How to set alarms on Megalodon Pro Automated Trader?
Click on Alert, select Megalodon Pro Automated Trader and click on Buy-Signal or Sell-Signal. More details can be found on our social media.
You may also watch our Megalodon Investing Tutorials on Youtube for more information.
How to purchase?
Megalodon is totally FREE .
You may upgrade to Megalodon Pro for the most important features , including automizing your trading on any asset profitably, setting up alarms to get notified , joining to our VIP telegram channel to get daily updates and our VIP telegram group to interact with the community. Simply go to our website on our TradingView page for learning more and joining us for free.
Some of the backtesting results are:
BTC/USD for longer time frame trading in the bear market for the last year.
APPLE for longer time frame trading in the bull market for the last 10 years.
EURO/USD for day trading in the neutral market for the last month.
BTC/USD for day trading in the bull market for the last 15 days.
APPLE for day trading in the neutral market for the last 2 days and 6 hours.
Intelligent Supertrend (AI) - Buy or Sell SignalIntroduction
This indicator uses machine learning (Artificial Intelligence) to solve a real human problem.
The artificial intelligence that operates this Supertrend was created by an algorithm that tests every single combination of input values across the entire chart history of an instrument for maximum profitability in real-time.
The Supertrend is one of the most popular indicators on the planet, yet no one really knows what input values work best in combination with each other. A reason for this is because not one set of input values is always going to be the best on every instrument, time-frame, and at any given point in time.
The "Intelligent Supertrend" solves this problem by constantly adapting the input values to match the most profitable combination so that no matter what happens, this Supertrend will be the most profitable.
Indicator Utility
The Intelligent Supertrend does not change what has already been plotted and does not repaint in any way which means that it is fully functional for trading in real-time.
Ultimately, there are no limiting factors within the range of combinations that have been programmed. The Supertrend will operate normally but will change input values according to what is currently the most profitable strategy.
Input Values
While a normal Supertrend would include two user-defined input values, the Intelligent Supertrend automates the input values according to what is currently the most profitable combination.
Additional Tools
The Optimised Supertrend is a tool that can be used to visual what input values the Supertrend AI is currently using. Additional tools to back-test this indicator will be added to this product soon.
For more information on how this indicator works, view the documentation here:
www.kenzing.com
For more information on the Supertrend view these fun facts:
www.marketcalls.in

Intelligent Volume-weighted Moving Average (AI)Introduction
This indicator uses machine learning (Artificial Intelligence) to solve a real human problem.
The volume-weighted moving average (VWMA) is one of the most used indicators on the planet, yet no one really knows what pair of volume-weighted moving average lengths works best in combination with each other. A reason for this is because no two VWMA lengths are always going to be the best on every instrument, time-frame, and at any given point in time.
The "Intelligent Volume-weighted Moving Average" solves the moving average problem by adapting the period length to match the most profitable combination of volume-weighted moving averages in real time.
How does the Intelligent Volume-weighted Moving Average work?
The artificial intelligence that operates these moving average lengths was created by an algorithm that tests every single combination across the entire chart history of an instrument for maximum profitability in real-time.
No matter what happens, the combination of these volume-weighted moving averages will be the most profitable.
Can we learn from the Intelligent Volume-weighted Moving Average?
There are many lessons to be learned from the Intelligent VWMA. Most will come with time as it is still a new concept. Adopting the usefulness of this AI will change how we perceive moving averages to work.
Limitations
This indicator does not change what has already been plotted and does not repaint in any way shape or form which means it is excellent for trading in real-time!
Ultimately, there are no limiting factors within the range of combinations that has been programmed. The volume-weighted moving averages will operate normally, but may change lengths in unexpected ways - maybe it knows something we don't?
Thresholds
The range of VWMA lengths is between 5 to 40.
The black crosses can be turned off in the settings panel.
Test this indicator!
I am also publishing tools that can be used to back-test this indicator and understand what period length is currently being used.
There will be many more updates to come so stay tuned!
Updated documentation and access to this indicator can be found at www.kenzing.com

Intelligent Exponential Moving Average (AI)Introduction
This indicator uses machine learning (Artificial Intelligence) to solve a real human problem.
The Exponential Moving Average (EMA) is one of the most used indicators on the planet, yet no one really knows what pair of exponential moving average lengths works best in combination with each other.
A reason for this is because no two EMA lengths are always going to be the best on every instrument, time-frame, and at any given point in time.
The "Intelligent Exponential Moving Average" solves the moving average problem by adapting the period length to match the most profitable combination of exponential moving averages in real time.
How does the Intelligent Exponential Moving Average work?
The artificial intelligence that operates these moving average lengths was created by an algorithm that tests every single combination across the entire chart history of an instrument for maximum profitability in real-time.
No matter what happens, the combination of these exponential moving averages will be the most profitable.
Can we learn from the Intelligent Moving Average?
There are many lessons to be learned from the Intelligent EMA. Most will come with time as it is still a new concept. Adopting the usefulness of this AI will change how we perceive moving averages to work.
Limitations
Ultimately, there are no limiting factors within the range of combinations that has been programmed. The exponential moving averages will operate normally, but may change lengths in unexpected ways - maybe it knows something we don't?
Thresholds
The range of exponential moving average lengths is between 5 to 40.
Additional coverage resulted in TradingView server errors.
Future Updates!
Soon, I will be publishing tools to test the AI and visualise what moving average combination the AI is currently using.

Optimised Exponential Moving AverageAbout
This tool measures the profitability of every exponential moving average length combination for the entire history of the instrument that it is applied and only displays the most profitable combination in real-time meaning that this indicator is fully functional for trading.
The Optimised Exponential Moving Average can be tested using an Exponential Moving Average strategy and the Strategy Tester panel on any instrument or time-stamp. It will always display the lengths of the most profitable exponential moving average lengths at the current moment in time.
This can be used on its own, or paired with the Intelligent Exponential Moving Average (AI) for a better understanding of the indicators movements.
The Intelligent Exponential Moving Average (AI) uses this tool as a predictive method for machine learning.
