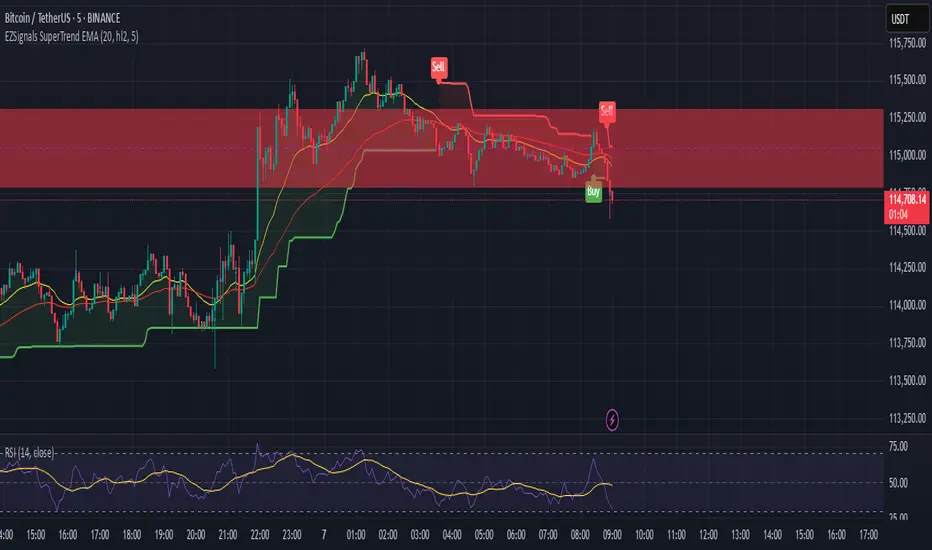
EZSignals SuperTrend EMAA technical indicator, even with high accuracy, must be rigorously backtested to assess its stability across various market conditions. Its effectiveness depends not only on the algorithm itself but also on how it is integrated into the overall trading system. Proper usage, combined with risk management and a solid understanding of market context, is essential to convert theoretical accuracy into practical trading advantage.
M-oscillator
Trend State ADX-DI v6This indicator combines the classic ADX (Average Directional Index) and DI+ / DI– (Directional Indicators) with a modern, easy-to-read visual approach. It highlights trend strength and direction directly on your chart background:
✅ Bullish Trend – DI+ crosses above DI– with ADX above threshold
✅ Bearish Trend – DI– crosses above DI+ with ADX above threshold
✅ Choppiness – ADX below threshold, indicating sideways or weak trend
✅ Transition – Optional highlight for periods near the threshold, signaling a potential trend change
Plots for ADX, DI+, and DI– help you track trend momentum, while customizable background colors make it easy to spot trading conditions at a glance. Alerts included for bullish and bearish trend signals.
Perfect for day traders and swing traders looking to identify strong directional moves and avoid choppy markets.
Created by ThomasO_777, updated for Pine Script v6 by ChatGPT.

free osciator haji_goldHaji Gold's free oscillator, which was updated after a long time, has several types of oscillators that we use for confirmation and signals.
Introduce this oscillator to your friends
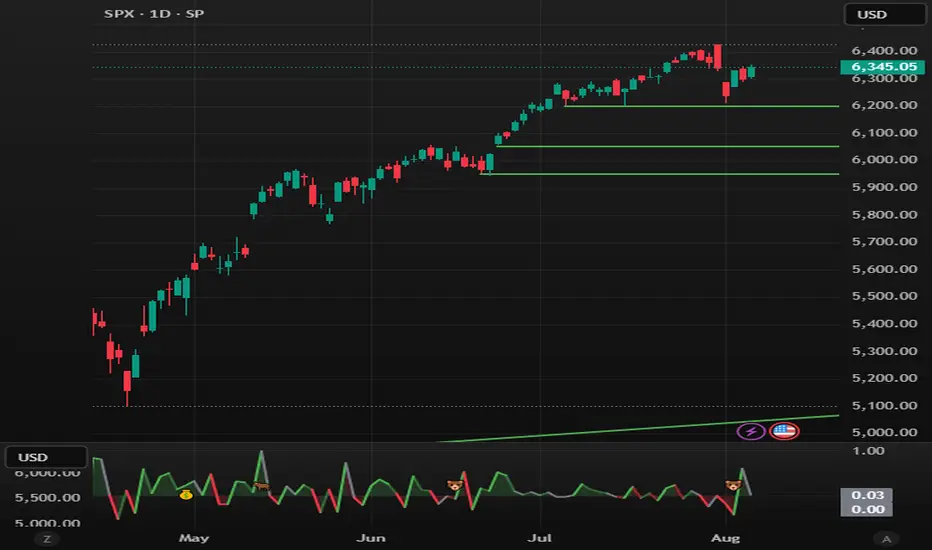
Mean Reversion & Momentum Hybrid | D_QUANT 📌 Mean Reversion & Momentum Hybrid | D_QUANT
📖 Description:
This indicator combines mean reversion logic, volatility filtering, and percentile-based momentum to deliver clear, context-aware buy/sell signals designed for trend-following and contrarian setups.
At its core, it merges:
A Bollinger Band % Positioning Model (BB%)
A 75th/25th Percentile Momentum System
A Volatility-Adjusted Trend Filter using RMA + ATR
All tied together with a dynamic gradient-style oscillator that visualizes signal strength and persistence over time — making it easy to track high-conviction setups.
Signals only trigger when all three core components align, filtering out noise and emphasizing high-probability turning points or trend continuations.
⚙️ Methodology Overview:
Bollinger Bands % (BB%):
Price is measured as a percentage between upper and lower Bollinger Bands (based on OHLC4). Entries are only considered when price exceeds custom BB% thresholds — emphasizing market extremes.
Volatility-Based Trend Filter (RMA + ATR):
A smoothed RMA baseline is paired with ATR to define trend bias. This ensures signals only occur when price deviates meaningfully beyond recent volatility.
Percentile Momentum Model (75th/25th Rank):
Price is compared against its rolling 75th and 25th percentile. If price breaks these statistical boundaries (adjusted by ATR), it triggers a directional momentum condition.
Signal Consensus Engine:
All three layers must agree — BB% condition, trend filter, and percentile momentum — before a buy or sell signal is plotted.
Gradient Oscillator Visualization:
Signals appear as a fading oscillator line with a gradient-filled area beneath it. The color intensity represents how “fresh” or “strong” the signal is, fading over time if not reconfirmed, offering both clarity and signal aging at a glance.
🔧 User Inputs:
🧠 Core Settings:
Source: Select the price input (default: close)
Bollinger Bands Length: Period for BB basis and deviation
Bollinger Bands Multiplier: Width of the bands
Minimum BB Width (% of Price): Prevents signals during low-volatility chop
📊 BB% Thresholds:
BB% Long Threshold (L): Minimum %B to consider a long
BB% Short Threshold (S): Maximum %B to consider a short
🔍 Trend Filter Parameters:
RMA Length: Period for the smoothed trend baseline
ATR Length: Lookback for ATR in trend deviation filter
⚡️ Momentum Parameters:
Momentum Length: Period for percentile momentum calculation
Mult_75 / Mult_25: ATR-adjusted thresholds for breakout above/below percentile levels
🎨 Visualization:
Bar Coloring: Highlights candles during active signals
Background Coloring: Optional background shading for signals
Show Oscillator Plot: Toggle the gradient-style oscillator
🧪 Use Case:
This indicator works well across all assets for trend identification. It is particularly effective when used on higher timeframes (e.g. 12H, 1D,2D) to capture mean reversion bounces or confirm breakouts backed by percentile momentum and volatility expansion.
⚠️ Notes:
This is not financial advice. Use in combination with proper risk management and confluence from other tools.

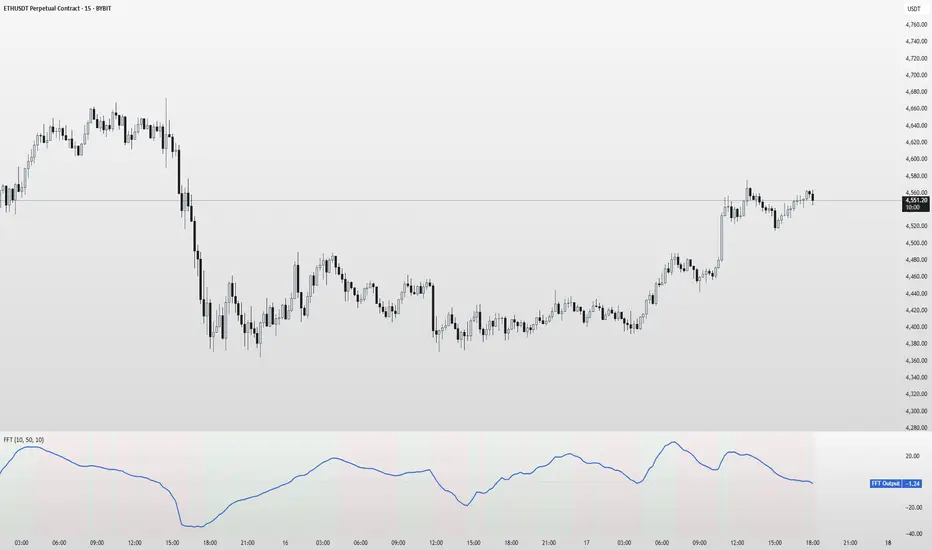
FFT Signal AnalyzerFFT Signal Analyzer
The FFT Signal Analyzer uses a simplified Fast Fourier Transform (FFT) approach to extract dominant cyclical components from price data. By detrending and applying adaptive smoothing, the indicator highlights frequency-driven signals that traditional indicators often miss.
This tool is ideal for traders who want to visualize cyclical market behavior, identify turning points, and confirm entries/exits with frequency-based momentum signals.
How it works:
Removes price trend via detrending (moving average subtraction)
Applies a bandpass filter (EMA) to isolate dominant frequency components
Normalizes the signal using a z-score for consistent visibility
Amplifies the signal for easy interpretation
Highlights slope changes with background coloring (green = rising, red = falling)
Use Cases:
Use zero-line crosses to detect cycle shifts or momentum pivots
Combine with trend filters (e.g., GRJMOM) for high-probability setups
Ideal for detecting underlying rhythm in sideways or oscillating markets
Best for:
Swing traders, scalpers, and cycle analysts looking for frequency-aware confirmation signals
Works on all timeframes and asset classes
Medico Action Zone self adjust TF version 2to create buy sell signal with adjusted EMA and timeframe

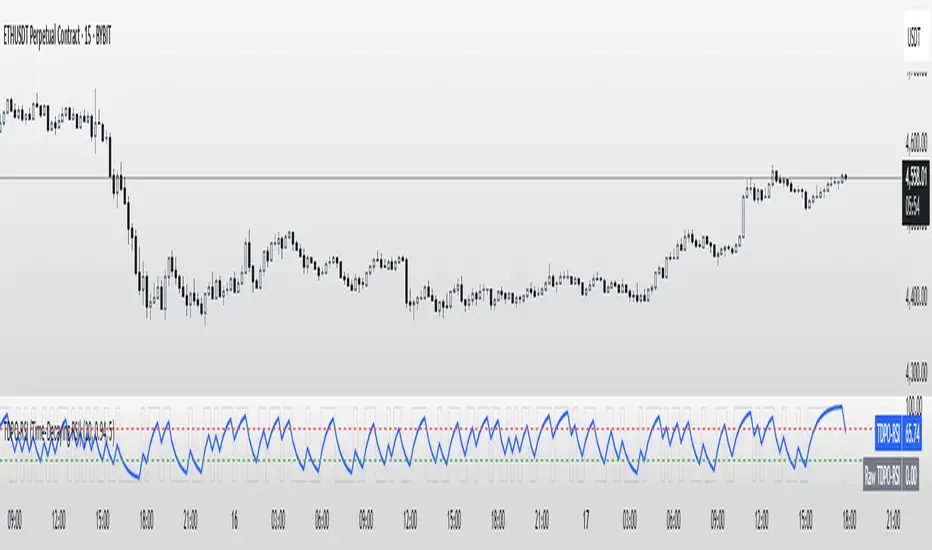
TDPO-RSI (Time-Decaying Percentile RSI)TDPO-RSI (Time-Decaying Percentile RSI)
TDPO-RSI is a modern, statistically-enhanced momentum indicator that improves on traditional RSI by using percentile-based analysis with exponential time decay. Instead of averaging gains and losses equally, this indicator ranks them by size and weights recent data more heavily—resulting in a more responsive and noise-resistant signal.
How it works:
Calculates percentile rank of gains and losses over a lookback window
Applies a decay factor (lambda) to give more weight to recent price action
Outputs a percentile-based RSI value between 0 and 100
Optional smoothing via EMA for clearer crossover signals
Key Uses:
Identify overbought/oversold zones (default: 70/30)
Use raw vs. smoothed RSI crossovers for entries
Detect momentum shifts earlier than traditional RSI
Suitable for scalping, trend continuation, and reversal setups
Inputs:
Lookback Length: Number of bars used for percentile calculation
Decay Factor (lambda): How quickly older data fades in influence (0.80–0.99)
Smoothing EMA: Smooths the final output to reduce noise
Tip: Combine with price structure and volume for best results. Higher timeframes can be used for trend context, while lower timeframes help with precise entries.
This tool is ideal for traders who want adaptive momentum analysis rooted in statistical behavior.
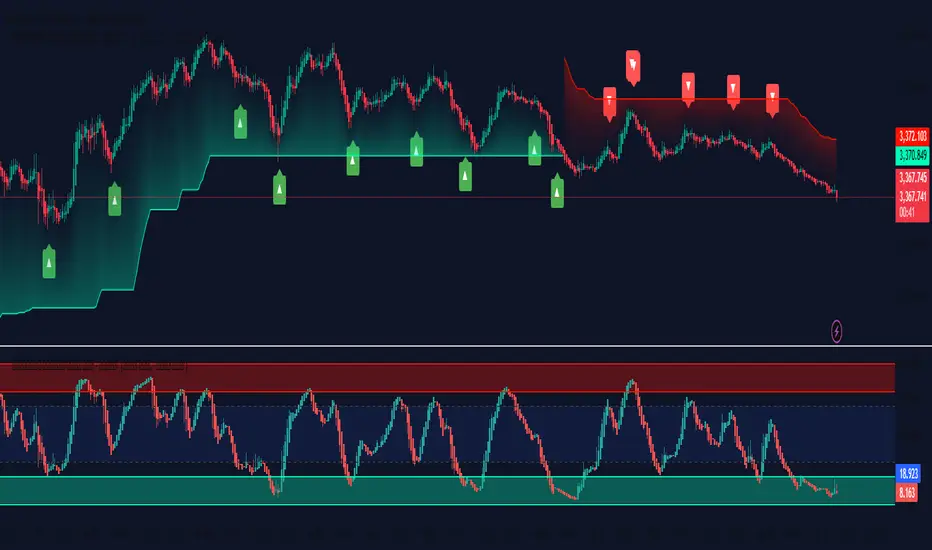
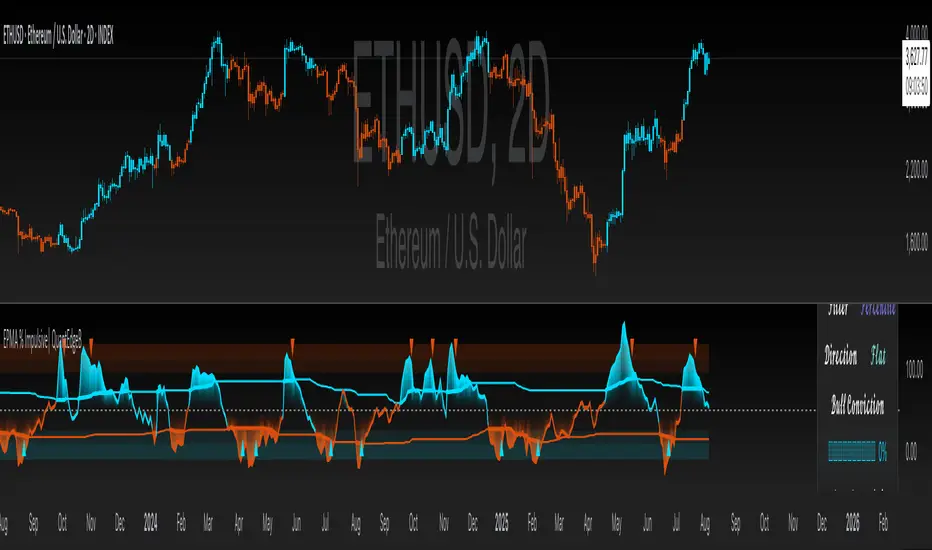
EPMA % Impulsive| QuantEdgeBEPMA % Impulsive | QuantEdgeB
🔍 What Is EPMA % Impulsive?
A volatility‐standardized impulse oscillator built on a forward-projected, low-lag moving average baseline. It transforms raw price into a 0–100% “impulse meter” by:
1. Trend Projection: Smoothing price with a double-EMA and fitting a short-term regression line that’s extended forward to anticipate direction.
2. Volatility Normalization: Wrapping that projected level in dynamic standard-deviation bands, then scaling price within those bands to a percentage scale.
3. Impulse Thresholds: Offering fixed, percentile-based, or rolling-volatility triggers to distinguish genuine bursts from noise.
💡 Why It’s Special
• Forward-Looking Base: By projecting the regression line forward, it reduces lag and “chases” trends intelligently.
• Noise-Aware Scaling: Volatility bands adapt in real time—quiet markets tighten bands, explosive markets widen them—ensuring the % reading always reflects true impulse, not random jitter.
• Flexible Thresholds: Static levels for simplicity, percentile ranks for regime-aware signals, or full standard-deviation bands for a purely data-driven approach.
• Dual Signal Styles: “Impulsive” mode for raw crossovers; “Smooth” mode for filtered breakouts that favor trend persistence.
⚙️ Key Components (High-Level)
1. DEMA Regression Engine
o Smooths price with double-EMA, fits a rolling regression, then projects it forward.
2. Volatility Bands
o Computes ±N × SD around the projected line to capture current turbulence.
3. % Scaling & Smoothing
o Maps price into a 0–100% range within those bands, then applies a final EMA to stabilize.
4. Impulse Triggers
o Crosses of the % line vs. your chosen thresholds generate long/short flags.
5. Visualization & Alerts
o Color-coded candles, threshold lines, zone fills, arrow markers, plus alert conditions on crossover/crossunder.
💼 Use Cases & Advantages
• Swing-Entry Precision
Pinpoint true momentum bursts for tighter entries and stops—avoiding false breakouts in choppy environments.
• Trend Confirmation
Validate whether a breakout is a sustained impulse (e.g., > 75th percentile) or just a spike that quickly fades.
• Regime Adaptability
Automatically tune sensitivity in low-volatility consolidations versus high-volatility expansions—no manual adjustments needed.
• Multi-Asset Versatility
Works seamlessly on stocks, futures, FX, crypto, and commodities—because it normalizes entirely to volatility, not price scale.
• Clarity & Confidence
A single, easy-to-interpret % reading plus visual cues make momentum obvious at a glance—empowering quick, data-driven decisions.
• Couple of charts examples.
BTC 1D
ETH 12H
SOL 8H
DOGE 4H
📌 Disclaimer:
Backtest results are based on past performance and do not guarantee future success. Always incorporate real-time validation and risk management in live trading.
🎨 Default Settings (Example)
• EPMA Lookback: 21 bars, forward-project 50 bars
• Volatility Band: ±2 × SD over 20 bars
• Threshold Type: Percentile 75/25 over 70 bars
• Signal Mode: Impulsive, Bar Color = On
📌 In Summary
EPMA % Impulsive | QuantEdgeB is your forward-projecting, volatility-aware momentum meter—combining regression forecasting with adaptive scaling to surface only the most meaningful impulse moves. Whether you’re timing swing entries or validating breakouts, it turns raw price into a clear, normalized impulse signal that adapts to any market regime.
🔹 Disclaimer: Past performance is not indicative of future results. No trading strategy can guarantee success in financial markets.
🔹 Strategic Advice: Always backtest, optimize, and align parameters with your trading objectives and risk tolerance before live trading.
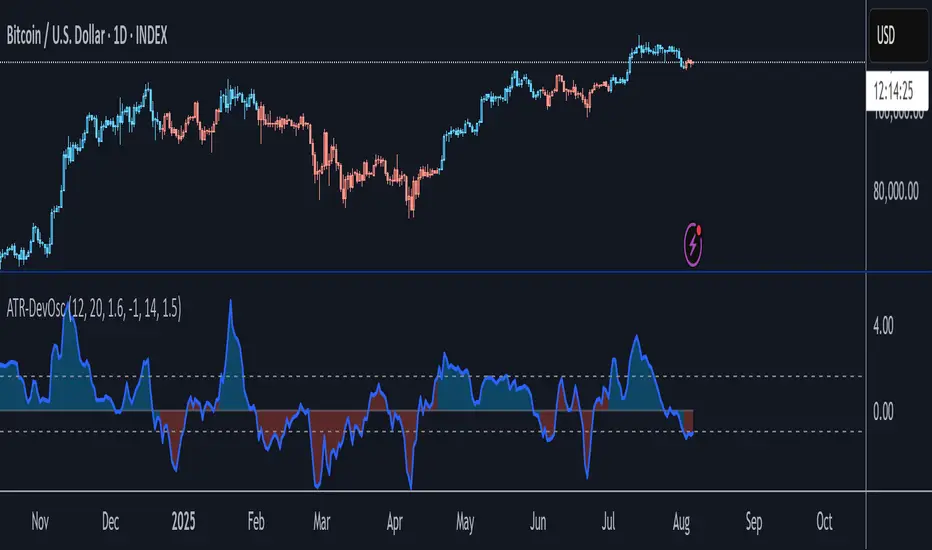
ATR-Scaled Deviation OscillatorATR-DevOsc is a custom momentum-and-volatility adaptive oscillator that scales N-bar price momentum by its rolling deviation and then reacts dynamically to sudden ATR spikes. By shrinking the deviation window when true volatility surges, it amplifies extreme moves—making medium-term trend shifts and deep drawdowns far more likely to breach your predefined thresholds.
Key features include:
• configurable momentum length and separate deviation length for precise control over look-back periods
• ATR Reaction Multiplier to tune how strongly sudden volatility spikes contract the deviation, boosting oscillator amplitude during extreme moves
• independent upper and lower threshold inputs for clear long/short signal definitions
• integrated candle-coloring overlay to immediately visualize trend state on your price chart
• built-in alert conditions for both oscillator-threshold crossovers and ATR-reactive triggers
This indicator is particularly useful for swing traders seeking medium-term entry and exit points in highly volatile markets like BTC. It combines normalized momentum readings with true volatility feedback, so large drawdowns or breakouts generate unmistakable signal events while routine noise stays filtered.
Note: ATR-DevOsc is provided “as is” without formal robustness or optimization testing. Past performance is not indicative of future results; use in live trading only after sufficient back-testing and validation.
DeltaStats (Anchored)DeltaStats (Anchored)
Benchmark price, volatility, and true range against your anchor period—instantly.
Metrics:
• Net Change
– Compares current close to the opening price of the chosen anchor period for % and log returns
– Normalized (PoP) Change = (net move ÷ √span) ÷ weighted average of per-bar absolute moves over the normalization span
• Standard Deviation
– Calculates SD over the anchor period and displays: % of mean, log % of mean
– Normalized (PoP) SD = (current period SD − prior period SD) ÷ weighted average of per-period RMS deviations over the normalization span
• Average True Range
– Calculates ATR over the anchor period and displays: TR/TrueMid % (avg), TR/TrueMid log % (avg)
– Normalized (PoP) ATR = (current period ATR − prior period ATR) ÷ weighted average of per-bar true ranges over the normalization span
Toggle each metric between
1. % of Baseline
2. Log % of Baseline
3. Normalized (PoP—period-over-period)
Underlying calculations:
• Net Change
– % vs baseline = (close ÷ anchorOpen − 1) × 100
– Log % vs baseline = log(close ÷ anchorOpen) × 100
– Normalized (PoP) = (Δ ÷ √span) ÷ weighted average of |Δ one-bar| over norm span
• Standard Deviation
– % of mean = SD(period) ÷ SMA(close, period) × 100
– Log % of mean = log(SD(period) ÷ SMA(close, period) + 1) × 100
– Normalized (PoP) = (SD(period) − SD(prior period)) ÷ weighted average of per-period RMS deviations over norm span
• Average True Range
– % vs TrueMid = SMA(TR ÷ TrueMid, period) × 100
– Log % vs TrueMid = SMA(log(TR ÷ TrueMid + 1), period) × 100
– Normalized (PoP) = (ATR(period) − ATR(prior period)) ÷ weighted average of one-bar TR over norm span

DeltaStats (Rolling)DeltaStats (Rolling)
Benchmark price, volatility, and true range over your rolling window—instantly.
Metrics:
• Net Change
– Compares today’s close to the close span bars ago for % and log returns
– Normalized (PoP) Change = (net move ÷ √span) ÷ simple average of per-bar absolute moves over span × multiplier
• Standard Deviation
– Calculates span-bar SD and displays: % of mean, log % of mean
– Normalized (PoP) SD = (current SD − span bars ago SD) ÷ simple average of RMS deviations over span × multiplier
• Average True Range
– Calculates span-bar ATR and displays: TR/TrueMid % (avg), TR/TrueMid log % (avg)
– Normalized (PoP) ATR = (current ATR − span bars ago ATR) ÷ simple average of one-bar TR over span × multiplier
Toggle each metric between
1. % of Baseline
2. Log % of Baseline
3. Normalized (PoP—period-over-period)
Underlying calculations:
• Net Change
– % vs baseline = (close ÷ close − 1) × 100
– Log % vs baseline = log(close ÷ close ) × 100
– Normalized (PoP) = (Δ ÷ √span) ÷ SMA(|Δ one-bar|, span × mult)
• Standard Deviation
– % of mean = SD(span) ÷ SMA(close, span) × 100
– Log % of mean = log(SD(span) ÷ SMA(close, span) + 1) × 100
– Normalized (PoP) = (SD(span) − SD(span ago)) ÷ SMA(RMS deviations, span × mult)
• Average True Range
– % vs TrueMid = SMA(TR ÷ TrueMid, span) × 100
– Log % vs TrueMid = SMA(log(TR ÷ TrueMid + 1), span) × 100
– Normalized (PoP) = (ATR(span) − ATR(span ago)) ÷ SMA(one-bar TR, span × mult)

Fibonacci-Based Volume Flow (VFI)Fibonacci-based Volume Flow is an advanced next-generation evolution of LazyBear’s original VFI script that calculates and averages up to 21 Fibonacci-based VFI pairings to create a smoothed composite volume flow signal. This unique and powerful approach reduces noise, adapts to volatility, and provides a clearer view of trend strength and market structure across all timeframes. It also includes dynamic fibonacci guide levels, adaptive lookbacks, EMA crossovers, and structure-aware pivot labeling to help traders identify high-quality reversals, confirm directional bias, and detect divergences with greater precision. It's ideal for traders looking to enhance momentum analysis through volume-based confirmation.
🧠 Key Features🧠
🔹 Multi-VFI Fibonacci Fusion🔹
Blends up to 21 VFI signals (5, 13, 21, 34… up to 610) into smartly paired averages (e.g., 13/34, 55/144) — forming a smoothed composite VFI that’s more adaptive, less noisy, and highly responsive across market conditions.
🔸🔸 Dynamic Lookbacks🔸 🔸
Automatically adjusts histogram high/low tracking based on your chart’s timeframe — no more static tuning. Perfect for scalping fast charts or confirming long-term trends.
🟥🟩 Color-Coded Histogram🟥🟩
Visualizes VFI momentum with gradient coloring.
🧩🧩 Signal Crossovers 🧩🧩
Color-coded crossover lines persistently show bullish or bearish dominance.
Includes three powerful crossover systems:
➖5/13 VFI: Fast, early reversal detection
➖8/21 VFI: Swing-trading sweet spot
➖55/144 VFI: Trend confirmation across long cycles
🏷️ 🏷️Pivot Structure Labels🏷️🏷️
Labels oscillator swings with full structural logic:
➖HH, HL, LH, LL, EQ
➖Displays percent change, price at pivot, oscillator reading
➖Smart coloring detects divergence & trend continuation
📈 📈Dynamic Histogram Guides📈📈
Optional zero and ±50% bands anchor histogram levels based on real histogram extremes, not static thresholds — visually frame momentum shifts with context.
📍 📍Persistent High/Low Pivot Lines📍📍
Track the most significant histogram pivots (not price) across time, with smart labels:
➖Volume flow structure zones
➖Label shows price at pivot, oscillator level, and bars since event
➖Ideal for spotting divergence zones, momentum failures, and trend exhaustion.
🔍 🔍Volatility Table (ATR%)🔍🔍
💡Shows real-time volatility compression or expansion
💡Uses multiple ATR periods (e.g., 14 & 55) for short- and medium-term comparison
💡Helps traders understand whether momentum is likely to continue or stall
🔩🔩Volume-weighted VFI baselines🔩🔩
🟢A daily session-based VWAP of the VFI, which resets each day and highlights intraday volume flow context.
🟠A rolling VWA of VFI, which acts like a VWMA over a fixed window (e.g., 55 bars), smoothing short-term fluctuations and supporting trend/momentum confirmation.
These VWAP-style overlays help traders identify strength vs. weakness relative to volume-weighted baselines — useful for divergence spotting, mean reversion setups, or breakout confirmation.
🧰 🧰Under the Hood: How It Works🧰🧰
🔧 Core VFI Logic
Based on LazyBear’s foundational VFI:
➖Uses log returns of price (HLC3)
➖Filters insignificant moves using volatility-weighted thresholds
➖Normalizes volume via adaptive capping (e.g., 2.5× average)
🌀 Composite Blend System
Each VFI instance is smoothed and then fused via user-selectable pairs. This creates a customizable average VFI representing short, mid, and long-term pressure — one value, many time horizons.
📊 EMA Signal Layer
Crosses trigger persistent color shifts in signal lines, making trend strength clear at a glance.
VFI blend feeds into EMA crossovers. You can toggle visibility for:
➖Fast (5/13)
➖Medium (8/21)
➖Slow (55/144)
🧭 Pivot Framework
Structure logic only compares pivots on same-side polarity:
➖Highs compare to highs above zero
➖Lows compare to lows below zero
This avoids nonsensical comparisons and preserves logical sequences (HH → LH → HL).
🧱 Dynamic Labels
All pivots and persistent levels display:
➖Oscillator value
➖Price value
➖Structure tag (e.g., LH, HL)
➖% change from prior pivot
➖Lookback info
➖Bar age
Unlike traditional VFI:
✅ It blends timeframes with Fibonacci precision
✅ Uses dynamic, volatility-aware logic
✅ Embeds visual structure & divergence intelligence
✅ Enhances entry confidence and exit timing
🔧 This isn’t just an indicator — it’s a volume-informed decision engine.
Ideal For:
🔶Trend-followers wanting cleaner volume-based confirmation
🔶Reversal traders spotting structure + divergence
🔶Scalpers or investors needing adaptable signals
🔶Those who loved LazyBear's VFI
📌 Final Note:
As powerful as Fibonacci Blended Volume Flow is, no single indicator should be used in isolation. For best results, combine it with price action analysis, higher-timeframe context, and complementary tools like trendlines, moving averages, or support/resistance levels. Use it as part of a well-rounded trading approach to confirm setups — not to define them alone.

ZenAlgo - ADXThis open-source indicator builds upon the official Average Directional Index (ADX) implementation by TradingView. It preserves the core logic of the original ADX while introducing additional visualization features, configurability, and analytical overlays to assist with directional strength analysis.
Core Calculation
The script computes the ADX, +DI, and -DI based on smoothed directional movement and true range over a user-defined length. The smoothing is performed using Wilder’s method, as in the original implementation.
True Range is calculated from the current high, low, and previous close.
Directional Movement components (+DM, -DM) are derived by comparing the change in highs and lows between consecutive bars.
These values are then smoothed, and the +DI and -DI are expressed as percentages of the smoothed True Range.
The difference between +DI and -DI is normalized to derive DX, which is further smoothed to yield the ADX value.
The indicator includes a selectable signal line (SMA or EMA) applied to the ADX for crossover-based visualization.
Visualization Enhancements
Several plots and conditions have been added to improve interpretability:
Color-coded histograms and lines visualize DI relative to a configurable threshold (default: 25). Colors follow the ZenAlgo color scheme.
Dynamic opacity and gradient coloring are used for both ADX and DI components, allowing users to distinguish weak/moderate/strong directional trends visually.
Mirrored ADX is internally calculated for certain overlays but not directly plotted.
The script also provides small circles and diamonds to highlight:
Crossovers between ADX and its signal line.
DI crossing above or below the 25 threshold.
Rising ADX confirmed by rising DI values, with point size reflecting ADX strength.
Divergence Detection
The indicator includes optional detection of fractal-based divergences on the DI curve:
Regular and hidden bullish and bearish divergences are identified based on relative fractal highs/lows in both price and DI.
Detected divergences are optionally labeled with 'R' (Regular) or 'H' (Hidden), and color-coded accordingly.
Fractal points are defined using 5-bar patterns to ensure consistency and reduce false positives.
ADX/DI Table
When enabled, a floating table displays live values and summaries:
ADX value , trend direction (rising/falling), and qualitative strength.
DI composite , trend direction, and relative strength.
Contextual power dynamics , describing whether bulls or bears are gaining or losing strength.
The background colors of the table reflect current trend strength and direction.
Interpretation Guidelines
ADX indicates the strength of a trend, regardless of its direction. Values below 20 are often considered weak, while those above 40 suggest strong trending conditions.
+DI and -DI represent bullish and bearish directional movements, respectively. Crossovers between them are used to infer trend direction.
When ADX is rising and either +DI or -DI is dominant and increasing, the trend is likely strengthening.
Divergences between DI and price may suggest potential reversals but should be interpreted cautiously and not in isolation.
The threshold line (default 25) provides a basic filter for ignoring low-strength conditions. This can be adjusted depending on the market or timeframe.
Added Value over Existing Indicators
Fully color-graded ADX and DI display for better visual clarity.
Optional signal MA over ADX with crossover markers.
Rich contextual labeling for both divergence and threshold events.
Power dynamics commentary and live table help users contextualize current momentum.
Customizable options for smoothing type, divergence display, table position, and visual offsets.
These additions aim to improve situational awareness without altering the fundamental meaning of ADX/DI values.
Limitations and Disclaimers
As with any ADX-based tool, this indicator does not indicate market direction alone —it measures strength, not trend bias.
Divergence detection relies on fractal patterns and may lag or produce false positives in sideways markets.
Signal MA crossovers and DI threshold breaks are not entry signals , but contextual markers that may assist with timing or filtering other systems.
The table text and labels are for visual assistance and do not replace proper technical analysis or market context.

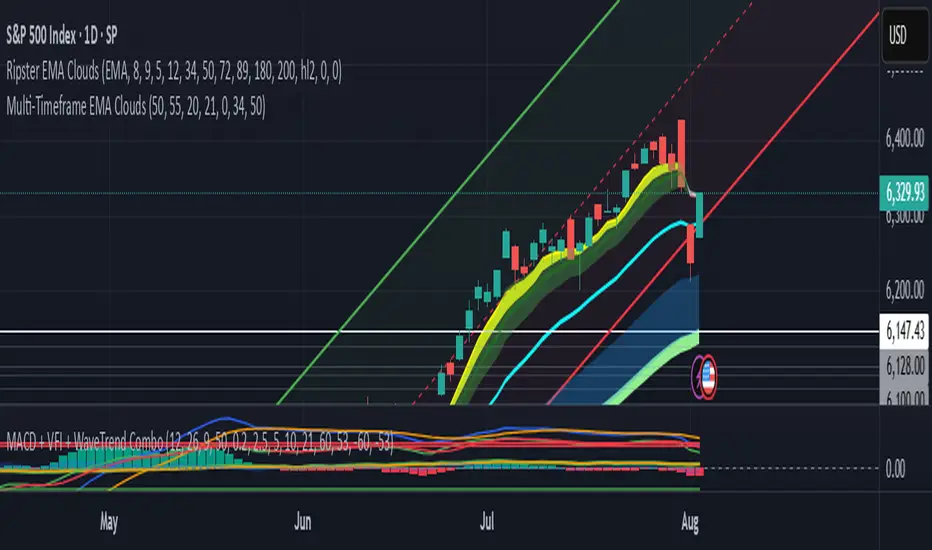
Divergence TridentA Combination of MACD + VFI + WaveTrend
Tradingview hates me and is making me explain this in greater detail so maybe this is enough????
Reversal Radar
**Reversal Radar - Multi-Indicator Confirmation System**
This script combines five proven technical analysis methods into a unified reversal signal, reducing false signals through multi-indicator confirmation.
**INDICATORS USED:**
1. ADX/Directional Movement System
Determines trend direction via +DI and -DI comparison. Signal only during downtrend condition (DI- > DI+). Filters out sideways markets.
2. Custom Linear Regression Momentum
Proprietary momentum calculation based on linear regression. Measures price deviation from Keltner Channel midline. Signal on negative but rising momentum (beginning trend reversal).
3. Williams VIX Fix (WVF)
Identifies panic-selling phases. Calculates relative distance to recent high. Signal when exceeding Bollinger Bands or historical percentiles.
4. RSI Oversold Filter
Default RSI < 35 (adjustable 30-40). Filters only oversold zones for reversal setups.
5. MACD Confirmation
Signal only when MACD below zero line and below signal line. Confirms ongoing weakness before potential reversal.
**FUNCTIONALITY:**
The system generates a BUY signal only when ALL activated filters are simultaneously met. Each indicator can be individually enabled/disabled. Flexible parameter adjustment for different markets/timeframes. Reduces false signals through multi-confirmation.
**APPLICATION:**
Suitable for swing trading on higher timeframes (4H, Daily), reversal strategies in oversold markets, and combination with additional confirmation indicators.
Setup: Activate desired filters, adjust parameters to market/timeframe, check BUY signal as entry opportunity. Additional confirmation through volume/support recommended.
**INNOVATION:**
The Custom Linear Regression Momentum is a proprietary development combining Keltner Channel logic with linear regression for more precise momentum detection than standard oscillators.
**DISCLAIMER:**
This tool serves as technical analysis support. No signal should be traded without additional confirmation and risk management.
