Gaussian Kernel Smoothing EMAGaussian Kernel Smoothing EMA
The Gaussian Kernel Smoothing EMA integrates the exponential moving average with kernel smoothing techniques to refine the trend tool. Kernel smoothing is a non-parametric technique used to estimate a smooth curve from a set of data points. It is particularly useful in reducing noise and capturing the underlying structure of data. The smoothed value at each point is calculated as a weighted average of neighboring points, with the weights determined by a kernel function.
The Gaussian kernel is a popular choice in kernel smoothing due to its properties of being smooth, symmetric, and having infinite support. This function gives higher weights to data points closer to the target point and lower weights to those further away, resulting in a smooth and continuous estimate. Since price isn't normally distributed a logarithmic transformation is performed to remove most of its skewness to be able to fit the Gaussian kernel.
This indicator also has a bandwidth, which in kernel smoothing controls the width of the window over which the smoothing is performed. It determines how much influence nearby data points have on the smoothed value. In this indicator, the bandwidth is dynamically adjusted based on the standard deviation of the log-transformed prices so that the smoothing adapts to the underlying variability and potential volatility.
Bandwidth Factor: The bandwidth factor in this indicator is used to adjust the degree of the smoothing applied to the MA. In kernel smoothing, Bandwidth controls the width of the window over which the smoothing is applied. It determines how many data points around a central point are considered when calculating a smooth value. A smaller bandwidth results in less smoothing, while a larger bandwidth smooths out more noise, leading to a broader, more general trend.
Indicators

Custom EMA Multi-Timeframe Indicator [Pineify]
This innovative indicator combines Exponential Moving Averages (EMAs) across multiple timeframes to provide traders with a comprehensive view of market trends and potential trading opportunities. By analyzing short, medium, and long-term EMAs simultaneously, this indicator offers valuable insights into market dynamics and helps identify high-probability entry and exit points.
Key Features
Multi-timeframe analysis using customizable EMAs
Visual representation of trend alignment across different timeframes
Customizable EMA lengths and sources for each timeframe
Buy and sell signals based on EMA crossovers
Alert functionality for real-time trade notifications
How It Works
The Custom EMA Multi-Timeframe Indicator calculates three separate EMAs:
1. Short-term EMA: Represents immediate market sentiment
2. Medium-term EMA: Captures intermediate trend direction
3. Long-term EMA: Reflects the overall market trend
These EMAs are plotted on the chart using different colors for easy identification. The indicator generates buy and sell signals based on the relative positions of these EMAs, providing traders with clear visual cues for potential trade entries and exits.
Trading Ideas and Insights
This indicator offers several powerful trading concepts:
Trend Alignment: When all three EMAs are aligned (short above medium above long), it indicates a strong trend. Traders can look for pullbacks to enter in the direction of the trend.
Trend Reversal: When the short-term EMA crosses above or below both the medium and long-term EMAs, it may signal a potential trend reversal. This can be used to exit existing positions or enter new trades in the opposite direction.
Range-bound Markets: When the EMAs are tightly grouped together, it suggests a consolidation phase. Traders can wait for a breakout or use range-trading strategies.
Momentum Confirmation: The speed at which the short-term EMA diverges from or converges with the longer-term EMAs can indicate the strength of the current move.
Unique Aspects
What sets this indicator apart is its ability to synthesize information from multiple timeframes into a single, easy-to-interpret visual display. Unlike traditional single-timeframe EMAs, this indicator provides a more holistic view of market trends, reducing false signals and improving trade timing.
The customizable nature of the indicator allows traders to adapt it to various trading styles and market conditions. By adjusting the EMA lengths and sources, traders can fine-tune the indicator to their specific needs and preferences.
How to Use
1. Apply the indicator to your chart
2. Customize the timeframes and EMA settings as desired
3. Look for buy signals when the short and medium EMAs cross above the long EMA
4. Look for sell signals when the short and medium EMAs cross below the long EMA
5. Use the relative positions of the EMAs to gauge overall trend strength and direction
6. Combine with other technical analysis tools for confirmation
Customization
The indicator offers extensive customization options:
Short, medium, and long timeframes can be adjusted
EMA lengths for each timeframe are customizable
EMA source (close, open, high, low, etc.) can be selected for each timeframe
Colors and line styles can be modified to suit personal preferences
Alert settings can be configured for automated trade notifications
Conclusion
The Custom EMA Multi-Timeframe Indicator is a powerful tool for traders seeking to gain a comprehensive understanding of market trends across different time horizons. By combining multiple EMAs and timeframes, it provides a unique perspective on market dynamics, helping traders make more informed decisions and potentially improve their trading results.
Whether you're a day trader looking for short-term opportunities or a swing trader focusing on longer-term trends, this indicator offers valuable insights that can enhance your trading strategy. Its flexibility and customization options make it suitable for a wide range of trading styles and market conditions.
Remember: While this indicator can be a valuable tool in your trading arsenal, it should not be used in isolation. Always combine it with other forms

Multiple EMA Indicator [Pineify]TradingView Multiple EMA Indicator: A Comprehensive Trend Analysis Tool
The TradingView Multiple EMA Indicator is a powerful and versatile tool designed to provide traders with a comprehensive view of market trends across multiple timeframes. By incorporating five Exponential Moving Averages (EMAs) with customizable lengths and sources, this indicator offers a nuanced approach to trend analysis, suitable for both novice and experienced traders.
Key Features:
Five customizable EMAs for multi-timeframe analysis
Flexible source inputs for each EMA
Color-coded plots for easy visual interpretation
Overlay functionality for direct price action comparison
How It Works:
This indicator calculates and displays five separate EMAs on your chart, each with its own customizable length and source. The EMAs are color-coded for easy identification:
EMA-1: Red
EMA-2: Light Green
EMA-3: Light Blue
EMA-4: Purple
EMA-5: Yellow
By default, the indicator uses the following settings:
EMA-1: 10-period EMA of close price
EMA-2: 20-period EMA of close price
EMA-3: 50-period EMA of close price
EMA-4: 100-period EMA of close price
EMA-5: 200-period EMA of close price
However, users can easily adjust these settings to suit their specific trading strategies and preferences.
Trading Ideas and Insights:
The Multiple EMA Indicator offers several ways to analyze market trends and generate trading signals:
Trend Identification: The alignment of the EMAs can help identify the overall trend. When shorter-term EMAs are above longer-term EMAs, it suggests an uptrend, and vice versa for a downtrend.
Dynamic Support and Resistance: Each EMA can act as a dynamic support or resistance level. Price bouncing off these levels can indicate potential entry or exit points.
Crossovers: When a shorter-term EMA crosses above a longer-term EMA, it may signal a bullish trend change. Conversely, a bearish signal may occur when a shorter-term EMA crosses below a longer-term EMA.
Trend Strength: The spacing between the EMAs can indicate trend strength. Wide spacing suggests a strong trend, while narrow spacing or intertwining EMAs may indicate consolidation or a weakening trend.
Multi-Timeframe Analysis: By using different EMA lengths, traders can gain insights into short-term, medium-term, and long-term trends simultaneously.
How to Use the Indicator:
Add the indicator to your chart and adjust the input parameters as needed.
Observe the relative positions of the EMAs to identify the overall trend direction.
Look for potential entry signals when price or shorter-term EMAs cross above or below longer-term EMAs.
Use the EMAs as dynamic support and resistance levels for setting stop-loss and take-profit orders.
Combine the Multiple EMA Indicator with other technical analysis tools, such as oscillators or volume indicators, for more comprehensive trading decisions.
Customization Options:
The indicator offers extensive customization options, allowing traders to tailor it to their specific needs:
Adjust the length of each EMA to focus on different timeframes
Change the source of each EMA (e.g., close, open, high, low, HL2, HLC3, OHLC4)
Modify the color and line thickness of each EMA for better visibility
Conclusion:
The TradingView Multiple EMA Indicator is a versatile and powerful tool for trend analysis and trade decision-making. By providing a multi-faceted view of market trends, it enables traders to make more informed decisions based on a comprehensive understanding of price action across various timeframes.
Remember that while this indicator can be a valuable tool in your trading arsenal, it should not be used in isolation. Always combine it with other forms of analysis and proper risk management techniques for the best results.
We hope this indicator enhances your trading experience and contributes to your success in the markets. Happy trading!

ADR (Log Scale) with MTF LabelsHere's a detailed presentation of the Average Daily Range (ADR) indicator, with a focus on its advantages compared to the classic ADR, its unique features, utility, and interpretation:
Advantages Compared to Classic ADR
1. Logarithmic Scale: Unlike the classic ADR, which uses a linear scale, this version uses a logarithmic scale for calculations. This approach provides a more accurate representation of relative price movements, especially for assets with large price ranges.
2. Multi-Timeframe Analysis: This enhanced ADR indicator allows traders to view daily, weekly, and monthly ADRs simultaneously. This multi-timeframe capability helps traders understand volatility trends over different periods, offering a more comprehensive market analysis.
3. Optional Smoothing: The inclusion of an optional smoothing feature (using Exponential Moving Average, EMA) helps reduce noise in the data. This makes the indicator more reliable by filtering out short-term fluctuations and highlighting the underlying volatility trend.
4. Information Display Labels: The indicator includes labels that display precise ADR values for each timeframe directly on the chart. This feature provides immediate, clear insights without requiring additional calculations or references.
Utility of the Indicator
1. Volatility Analysis: The ADR indicator is essential for assessing market volatility. By showing the average daily price range, it helps traders gauge how much an asset typically moves within a day, week, or month.
2. Risk Management: ADR levels can be used to set stop-loss points, improving risk management strategies. Knowing the average range helps traders avoid setting stops too close to the current price, which might otherwise be triggered by normal market fluctuations.
3. Setting Realistic Targets: By understanding the average daily range, traders can set more realistic profit targets. This helps in avoiding over-ambitious goals that are unlikely to be reached within the typical market movement.
4. Identifying Entry and Exit Points: The ADR can signal potential entry and exit points. For example, if the price approaches the upper or lower ADR boundary, it might indicate an overbought or oversold condition, respectively.
Interpretation and Examples
1. Increasing Volatility: If the ADR is increasing, it indicates rising market volatility. Traders might adjust their strategies accordingly, such as widening their stop-losses to accommodate larger price swings.
2. Range Breakout: If the price significantly exceeds the daily ADR, it may signal a strong trend or exceptional market movement. Traders can use this information to stay in the trade longer or to anticipate a potential reversal.
3. Mean Reversion: Prices often revert to the ADR mean. A trader might consider mean reversion trades when the price approaches the extremes of the ADR range, expecting it to move back towards the average.
4. Multi-Timeframe Comparison: If the daily ADR is higher than the weekly ADR, it may indicate unusually high short-term volatility. This can be a signal for traders to be cautious or to capitalize on the increased movement.
While the ADR indicator provides valuable insights into market volatility and can significantly enhance trading strategies, it is essential to remember that no indicator is foolproof. Market conditions can change rapidly, and past performance is not always indicative of future results. Traders should use the ADR indicator in conjunction with other tools and follow sound risk management practices to protect their capital.

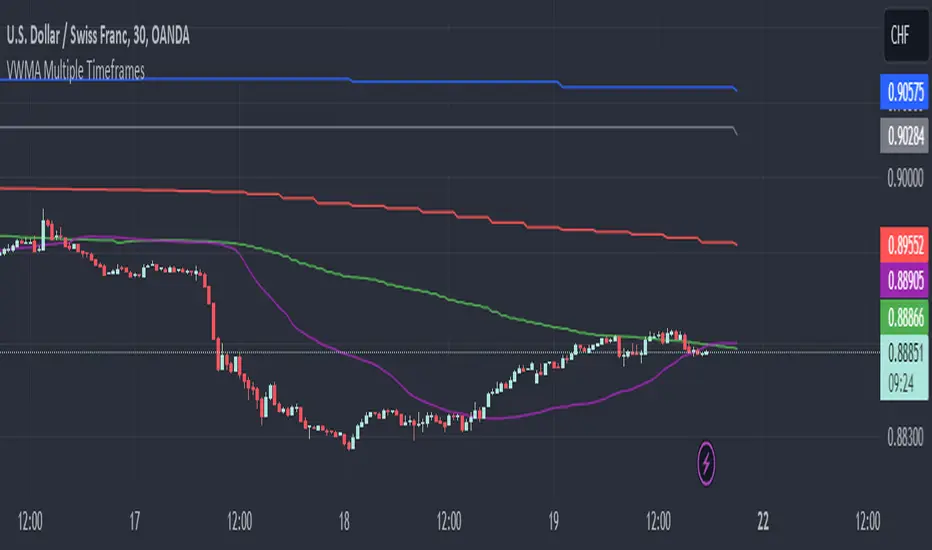
VWMA Multiple TimeframesVWMA Multiple Timeframes Indicator
This TradingView indicator plots the Volume Weighted Moving Average (VWMA) across multiple timeframes on your chart. The VWMA is a type of moving average that gives more weight to periods with higher volume, making it a valuable tool for traders who want to incorporate volume into their technical analysis.
Features:
Multi-timeframe Analysis: This indicator calculates and plots the VWMA on five different timeframes:
Weekly (W)
Daily (D)
4 Hours (240 minutes)
1 Hour (60 minutes)
15 Minutes
Visual Representation: Each timeframe's VWMA is plotted with a different color, making it easy to distinguish between them on the chart:
Weekly VWMA: Gray
Daily VWMA: Blue
4 Hours VWMA: Red
1 Hour VWMA: Green
15 Minutes VWMA: Purple
How to Use:
Trend Identification: Use the VWMA to identify the direction of the trend on different timeframes. For example, if the VWMA is trending upwards on multiple timeframes, it indicates a strong upward trend.
Support and Resistance: The VWMA can act as dynamic support or resistance levels. Price bouncing off a VWMA line might indicate a continuation of the trend.
Volume Confirmation: The VWMA considers volume, making it useful for confirming the strength of price movements. High volume moves that cause the VWMA to change direction can be more significant than low volume moves.
This indicator is ideal for traders who use multi-timeframe analysis and want to incorporate volume into their trend and support/resistance identification. Feel free to customize the periods and timeframes to suit your trading style.
SOL & BTC EMA with BTC/SOL Price Difference % and BTC Dom EMAThis script is designed to provide traders with a comprehensive analysis of Solana (SOL) and Bitcoin (BTC) by incorporating Exponential Moving Averages (EMAs) and price difference percentages. It also includes the BTC Dominance EMA to offer insights into the overall market dominance of Bitcoin.
Features:
SOL EMA: Plots the Exponential Moving Average (EMA) for Solana (SOL) based on a customizable period length.
BTC EMA: Plots the Exponential Moving Average (EMA) for Bitcoin (BTC) based on a customizable period length.
BTC Dominance EMA: Plots the Exponential Moving Average (EMA) for BTC Dominance, which helps in understanding Bitcoin's market share relative to other cryptocurrencies.
BTC/SOL Price Difference %: Calculates and plots the percentage difference between BTC and SOL prices, adjusted for their respective EMAs. This helps in identifying relative strength or weakness between the two assets.
Background Highlight: Colors the background to visually indicate whether the BTC/SOL price difference percentage is positive (green) or negative (red), aiding in quick decision-making.
Inputs:
SOL Ticker: Symbol for Solana (default: BINANCE
).
BTC Ticker: Symbol for Bitcoin (default: BINANCE
).
BTC Dominance Ticker: Symbol for Bitcoin Dominance (default: CRYPTOCAP
.D).
EMA Length: The length of the EMA (default: 20 periods).
Usage:
This script is intended for traders looking to analyze the relationship between SOL and BTC, using EMAs to smooth out price data and highlight trends. The BTC/SOL price difference percentage can help traders identify potential trading opportunities based on the relative movements of SOL and BTC.
Note: Leverage trading involves significant risk and may not be suitable for all investors. Ensure you have a good understanding of the market conditions and employ proper risk management techniques.

MTF-Colored EMA Difference and Stochastic indicatorThis indicator combines two popular technical analysis tools: the Exponential Moving Average (EMA) and the Stochastic Oscillator, with the added flexibility of analyzing them across multiple time frames. It visually represents the difference between two EMAs and the crossover signals from the Stochastic Oscillator, providing a comprehensive view of the market conditions.
Components:
EMA Difference Histogram :
EMA Calculation : The indicator calculates two EMAs (EMA1 and EMA2) for the selected time frame.
EMA Difference : The difference between EMA1 and EMA2 is plotted as a 4 coloured histogram.
Stochastic Oscillato r:
Calculation : The %K and %D lines of the Stochastic Oscillator are calculated for the selected time frame.
Additional Confirmation via Colors :
Green: %K is above %D, indicating a bullish signal.
Red: %K is below %D, indicating a bearish signal.
Entry and Exit Strategies
Entry Strategy :
Bullish Entry :
Condition 1: The histogram is Dark green (indicating a strong upward trend).
Condition 2: The Stochastic colour is green (%K is above %D).
Bearish Entry :
Condition 1: The histogram is Dark Red (indicating a strong downward trend).
Condition 2: The Stochastic colour is red (%K is below %D).
Exit Strategy:
Bullish Exit:
Condition: The Stochastic colour turns red (%K crosses below %D).
Bearish Exit:
Condition: The Stochastic colour turns green (%K crosses above %D).
Additional Considerations:
Time Frame Selection : The chosen time frame for both the EMA and Stochastic calculations should align with the trader’s strategy (e.g., daily for swing trading, hourly for intraday trading).
Risk Management : Implement stop-loss orders to manage risk effectively. The stop-loss can be placed below the recent swing low for long positions and above the recent swing high for short positions.
Confirmation : Consider using this indicator in conjunction with other technical analysis tools to confirm signals and reduce the likelihood of false entries and exits.

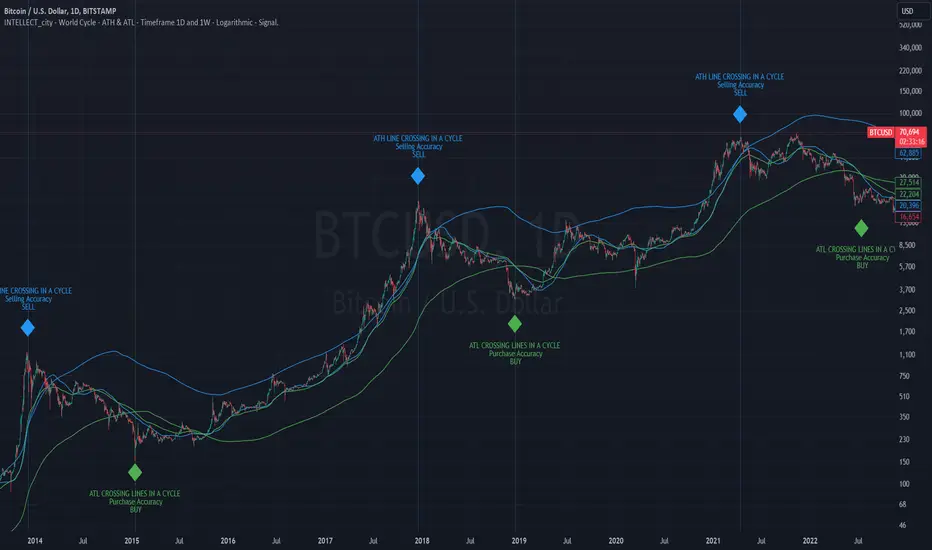
intellect_city - World Cycle - Ath & Atl - Logarithmic - Signal.Indicator Overview
INTELLECT_city - World Cycle - ATH & ATL - Timeframe 1D and 1W - Logarithmic - Signal - The Pi Cycle Top and Bottom Oscillator is an adaptation of the original Pi Cycle Top chart. It compares the 111-Day Moving Average circle and the 2 * 350-Day Moving Average circle of Bitcoin’s Price. These two moving averages were selected as 350 / 111 = 3.153; An approximation of the important mathematical number Pi.
When the 111-Day Moving Average circle reaches the 2 * 350-Day Moving Average circle, it indicates that the market is becoming overheated. That is because the mid time frame momentum reference of the 111-Day Moving Average has caught up with the long timeframe momentum reference of the 2 * 350-Day Moving Average.
Historically this has occurred within 3 days of the very top of each market cycle.
When the 111 Day Moving Average circle falls back beneath the 2 * 350 Day Moving Average circle, it indicates that the market momentum of that cycle is significantly cooling down. The oscillator drops down into the lower green band shown where the 111 Day Moving Average is moving at a 75% discount relative to the 2 * 350 Day Moving Average.
Historically, this has highlighted broad areas of bear market lows.
IMPORTANT: You need to set a LOGARITHMIC graph. (The function is located at the bottom right of the screen)
IMPORTANT: The INTELLECT_city indicator is made for signal purchases of sales, there is also a strategic one from INTELLECT_city
IMPORTANT: The Chart shows all cycles, both buying and selling.
IMPORTANT: Suitable timeframes are 1 daily (recommended) and 1 weekly
-----------------------------
Описание на русском:
-----------------------------
Обзор индикатора
INTELLECT_city - World Cycle - ATH & ATL - Timeframe 1D and 1W - Logarithmic - Signal - Логарифмический - Сигнал - Осциллятор вершины и основания цикла Пи представляет собой адаптацию оригинального графика вершины цикла Пи. Он сравнивает круг 111-дневной скользящей средней и круг 2 * 350-дневной скользящей средней цены Биткойна. Эти две скользящие средние были выбраны как 350/111 = 3,153; Приближение важного математического числа Пи.
Когда круг 111-дневной скользящей средней достигает круга 2 * 350-дневной скользящей средней, это указывает на то, что рынок перегревается. Это происходит потому, что опорный моментум среднего временного интервала 111-дневной скользящей средней догнал опорный момент импульса длинного таймфрейма 2 * 350-дневной скользящей средней.
Исторически это происходило в течение трех дней после вершины каждого рыночного цикла.
Когда круг 111-дневной скользящей средней опускается ниже круга 2 * 350-дневной скользящей средней, это указывает на то, что рыночный импульс этого цикла значительно снижается. Осциллятор опускается в нижнюю зеленую полосу, показанную там, где 111-дневная скользящая средняя движется со скидкой 75% относительно 2 * 350-дневной скользящей средней.
Исторически это высветило широкие области минимумов медвежьего рынка.
ВАЖНО: Выставлять нужно ЛОГАРИФМИЧЕСКИЙ график. (Находиться функция с правой нижней части экрана)
ВАЖНО: Индикатор INTELLECT_city сделан для сигнальных покупок продаж, есть также и стратегический от INTELLECT_сity
ВАЖНО: На Графике видны все циклы, как на покупку так и на продажу.
ВАЖНО: Подходящие таймфреймы 1 дневной (рекомендовано) и 1 недельный
-----------------------------
Beschreibung - Deutsch
-----------------------------
Indikatorübersicht
INTELLECT_city – Weltzyklus – ATH & ATL – Zeitrahmen 1T und 1W – Logarithmisch – Signal – Der Pi-Zyklus-Top- und Bottom-Oszillator ist eine Anpassung des ursprünglichen Pi-Zyklus-Top-Diagramms. Er vergleicht den 111-Tage-Gleitenden-Durchschnittskreis und den 2 * 350-Tage-Gleitenden-Durchschnittskreis des Bitcoin-Preises. Diese beiden gleitenden Durchschnitte wurden als 350 / 111 = 3,153 ausgewählt; eine Annäherung an die wichtige mathematische Zahl Pi.
Wenn der 111-Tage-Gleitenden-Durchschnittskreis den 2 * 350-Tage-Gleitenden-Durchschnittskreis erreicht, deutet dies darauf hin, dass der Markt überhitzt. Das liegt daran, dass der Momentum-Referenzwert des 111-Tage-Gleitenden-Durchschnitts im mittleren Zeitrahmen den Momentum-Referenzwert des 2 * 350-Tage-Gleitenden-Durchschnitts im langen Zeitrahmen eingeholt hat.
Historisch gesehen geschah dies innerhalb von 3 Tagen nach dem Höhepunkt jedes Marktzyklus.
Wenn der Kreis des 111-Tage-Durchschnitts wieder unter den Kreis des 2 x 350-Tage-Durchschnitts fällt, deutet dies darauf hin, dass die Marktdynamik dieses Zyklus deutlich nachlässt. Der Oszillator fällt in das untere grüne Band, in dem der 111-Tage-Durchschnitt mit einem Abschlag von 75 % gegenüber dem 2 x 350-Tage-Durchschnitt verläuft.
Historisch hat dies breite Bereiche mit Tiefstständen in der Baisse hervorgehoben.
WICHTIG: Sie müssen ein logarithmisches Diagramm festlegen. (Die Funktion befindet sich unten rechts auf dem Bildschirm)
WICHTIG: Der INTELLECT_city-Indikator dient zur Signalisierung von Käufen oder Verkäufen, es gibt auch einen strategischen Indikator von INTELLECT_city
WICHTIG: Das Diagramm zeigt alle Zyklen, sowohl Kauf- als auch Verkaufszyklen.
WICHTIG: Geeignete Zeitrahmen sind 1 täglich (empfohlen) und 1 wöchentlich
Advanced Fractal and Hurst IndicatorAdvanced Fractal and Hurst Indicator (AFHI)
Description:
The Advanced Fractal and Hurst Indicator (AFHI) is a custom technical analysis tool designed to identify market trends and potential reversals by leveraging the concepts of Fractal Dimension and the Hurst Exponent . These advanced mathematical concepts provide insights into the complexity and persistence of price movements, making this indicator a powerful addition to any trader's toolkit.
How It Works:
Fractal Dimension (FD) :
The Fractal Dimension measures the complexity of price movements. A higher Fractal Dimension indicates a more complex, choppy market, while a lower value suggests smoother trends.
The FD is calculated using the log difference of price movements over a specified length.
Hurst Exponent (HE) :
The Hurst Exponent indicates the tendency of a time series to either regress to the mean or cluster in a direction. Values below 0.5 indicate a tendency to revert to the mean (mean-reverting), while values above 0.5 suggest a trending market.
The HE is calculated using the rescaled range method, comparing the range of price movements to the standard deviation.
Composite Indicator :
The Composite Indicator combines the smoothed Fractal Dimension and Hurst Exponent to provide a single value indicating market conditions. This is done by normalizing the FD and HE values and combining them into one metric.
A positive Composite Indicator suggests an uptrend, while a negative value indicates a downtrend.
Smoothing :
Both FD and HE values are smoothed using a simple moving average to reduce noise and provide clearer signals.
Trend Confirmation :
A 50-period moving average (MA) is used to confirm the trend direction. The price being above the MA indicates an uptrend, while below the MA indicates a downtrend.
Background Shading :
The indicator pane is shaded green during uptrend conditions (positive Composite Indicator and price above MA) and red during downtrend conditions (negative Composite Indicator and price below MA).
How Traders Can Use It:
Identifying Trends :
Traders can use the AFHI to identify current market trends. The background shading in the indicator pane provides a visual cue for trend direction, with green indicating an uptrend and red indicating a downtrend.
Trend Confirmation :
The Composite Indicator line, plotted in purple, helps confirm the trend. Positive values suggest a strong uptrend, while negative values indicate a strong downtrend.
Entry and Exit Signals :
Traders can use the transitions of the Composite Indicator and the background shading to time their entry and exit points. For instance, a shift from red to green shading suggests a potential buy opportunity, while a shift from green to red suggests a potential sell opportunity.
Alerts :
The script includes alert conditions that can notify traders when the Composite Indicator signals a new trend direction. Alerts can be set up for both uptrends and downtrends, helping traders stay informed of key market changes.
Strategy Development :
By integrating AFHI into their trading strategies, traders can develop more robust systems that account for market complexity and persistence. The indicator can be used alongside other technical tools to enhance decision-making and improve trade accuracy.

Breadth Indicators NYSE Percent Above Moving AverageBreadth Indicators NYSE - transmits the processed data from the Barchart provider
NYSE - Breadth Indicators
S&P 500 - Breadth Indicators
DOW - Breadth Indicators
RUSSEL 1000 - Breadth Indicators
RUSSEL 2000 - Breadth Indicators
RUSSEL 3000 - Breadth Indicators
Moving Average - 5, 20, 50, 100, 150, 200
The "Percentage above 50-day SMA" indicator measures the percentage of stocks in the index trading above their 50-day moving average. It is a useful tool for assessing the general state of the market and identifying overbought and oversold conditions.
One way to use the "Percentage above 50-day SMA" indicator in a trading strategy is to combine it with a long-term moving average to determine whether the trend is bullish or bearish. Another way to use it is to combine it with a short-term moving average to identify pullbacks and rebounds within the overall trend.
The purpose of using the "Percentage above 50-day SMA" indicator is to participate in a larger trend with a better risk-reward ratio. By using this indicator to identify pullbacks and bounces, you can reduce the risk of entering trades at the wrong time.
Bull Signal Recap:
150-day EMA of $SPXA50R crosses above 52.5 and remains above 47.50 to set the bullish tone.
5-day EMA of $SPXA50R moves below 40 to signal a pullback
5-day EMA of $SPXA50R moves above 50 to signal an upturn
Bear Signal Recap:
150-day EMA of $SPXA50R crosses below 47.50 and remains below 52.50 to set the bearish tone.
5-day EMA of $SPXA50R moves above 60 to signal a bounce
5-day EMA of $SPXA50R moves below 50 to signal a downturn
Tweaking
There are numerous ways to tweak a trading system, but chartists should avoid over-optimizing the indicator settings. In other words, don't attempt to find the perfect moving average period or crossover level. Perfection is unattainable when developing a system or trading the markets. It is important to keep the system logical and focus tweaks on other aspects, such as the actual price chart of the underlying security.
What do levels above and below 50% signify in the long-term moving average?
A move above 52.5% is deemed bullish, and below 47.5% is deemed bearish. These levels help to reduce whipsaws by using buffers for bullish and bearish thresholds.
How does the short-term moving average work to identify pullbacks or bounces?
When using a 5-day EMA, a move below 40 signals a pullback, and a move above 60 signals a bounce.
How is the reversal of pullback or bounce identified?
A move back above 50 after a pullback or below 50 after a bounce signals that the respective trend may be resuming.
How can you ensure that the uptrend has resumed?
It’s important to wait for the surge above 50 to ensure the uptrend has resumed, signaling improved breadth.
Can the system be tweaked to optimize indicator settings?
While there are various ways to tweak the system, seeking perfection through over-optimizing settings is advised against. It's crucial to keep the system logical and focus tweaks on the price chart of the underlying security.
RUSSIAN \ Русская версия.
Индикатор "Процент выше 50-дневной скользящей средней" измеряет процент акций, торгующихся в индексе выше их 50-дневной скользящей средней. Это полезный инструмент для оценки общего состояния рынка и выявления условий перекупленности и перепроданности.
Один из способов использования индикатора "Процент выше 50-дневной скользящей средней" в торговой стратегии - это объединить его с долгосрочной скользящей средней, чтобы определить, является ли тренд бычьим или медвежьим. Другой способ использовать его - объединить с краткосрочной скользящей средней, чтобы выявить откаты и отскоки в рамках общего тренда.
Цель использования индикатора "Процент выше 50-дневной скользящей средней" - участвовать в более широком тренде с лучшим соотношением риска и прибыли. Используя этот индикатор для выявления откатов и отскоков, вы можете снизить риск входа в сделки в неподходящее время.
Краткое описание бычьего сигнала:
150-дневная ЕМА на уровне $SPXA50R пересекает отметку 52,5 и остается выше 47,50, что задает бычий настрой.
5-дневная ЕМА на уровне $SPXA50R опускается ниже 40, сигнализируя об откате
5-дневная ЕМА на уровне $SPXA50R поднимается выше 50, сигнализируя о росте
Обзор медвежьих сигналов:
150-дневная ЕМА на уровне $SPXA50R пересекает уровень ниже 47,50 и остается ниже 52,50, что указывает на медвежий настрой.
5-дневная ЕМА на уровне $SPXA50R поднимается выше 60, сигнализируя о отскоке
5-дневная ЕМА на уровне $SPXA50 опускается ниже 50, что сигнализирует о спаде
Корректировка
Существует множество способов настроить торговую систему, но графологам следует избегать чрезмерной оптимизации настроек индикатора. Другими словами, не пытайтесь найти идеальный период скользящей средней или уровень пересечения. Совершенство недостижимо при разработке системы или торговле на рынках. Важно поддерживать логику системы и уделять особое внимание другим аспектам, таким как график фактической цены базовой ценной бумаги.
Что означают уровни выше и ниже 50% в долгосрочной скользящей средней?
Движение выше 52,5% считается бычьим, а ниже 47,5% - медвежьим. Эти уровни помогают снизить риски, используя буферы для бычьих и медвежьих порогов.
Как краткосрочная скользящая средняя помогает идентифицировать откаты или отскоки?
При использовании 5-дневной ЕМА движение ниже 40 указывает на откат, а движение выше 60 указывает на отскок.
Как определяется разворот отката или отскока?
Движение выше 50 после отката или ниже 50 после отскока сигнализирует о возможном возобновлении соответствующего тренда.
Как вы можете гарантировать, что восходящий тренд возобновился?
Важно дождаться скачка выше 50, чтобы убедиться в возобновлении восходящего тренда, сигнализирующего о расширении диапазона.
Можно ли настроить систему для оптимизации настроек индикатора?
Хотя существуют различные способы настройки системы, не рекомендуется стремиться к совершенству с помощью чрезмерной оптимизации настроек. Крайне важно сохранить логичность системы и сфокусировать изменения на ценовом графике базовой ценной бумаги.

Correlated Movement Indicator V2Hello!
This script was briefly known as as Bing Chilling. I converted this to Pine Script V5 to ensure compliance with publishing requirements.
This script tracks RSI and inserts an indicator when correlated movement is detected. Proximity of current tick to indicator origin tick determines freshness of the indicator.
DO NOT sit on the indicator for a long time. This is not a magic solution. It is very accurate but, not always precise. Ensure that you use other factors to determine the relevance of the indicator on current tick. This script can technically be used on any security/commodity/currency. Your Mileage May Vary! Proceed with caution as always.
General Workflow:
Look at proximity to where the flag is placed, general volatility, and other indicators and you can potentially determine the direction/strength. Not always the duration. The indicator could be for 30s, 1hr, 1 day, or whatever the market feels like. It depends on precision/quantity of pricing data. ex. 30min tick rate pricing vs. 1 day tick rate pricing will change the scope.
So if the time scope shows all sell from 1 week -> 3 months except for a couple recent buy indicators on the day, then it may be a bad call long term but, might be good for a short term play. Very volatile. Careful.
If it was all green with long term indicators such as 1 month -> 1 year, then it looks more like a buy and forget type strategy.
If it's all green with a recent red then you can try and figure out what the relative the bottom is so you can buy for long term at a slightly more favorable price.
Flip all that for shorting. I highly recommend AGAINST shorting since the stakes are very different and usually involves taking out what is essentially a loan to bet against the market.
This script pairs nicely with the top pick indicator when you search "Heiken Ashi". I use that to determine peaks and pits to better guess a good time to open a position.
This should be used alongside other indicators. Good for short term day trading and long term hold and forget. (Don't actually forget. Set some alerts periodically.)
Please use caution. Please do not take what I've said here as fact and diamond pepe hands bet all on green to the moon. This, like all the other strategies and indicators on this site, are used as tools to inform you about potential and to categorize/depict data in a more human recognizable way. If you have access to a paper account try there first.
Happy trading!
- Zetsu

Enhanced Forex IndicatorDescription of the "Enhanced Forex Indicator"
The "Enhanced Forex Indicator" is designed for traders who want a comprehensive technical analysis tool on the TradingView platform. This script integrates Exponential Moving Averages (EMAs), support and resistance zones, and candlestick pattern recognition to provide actionable trading signals, particularly useful for Forex and other financial markets. The script is suitable for intraday trading and swing trading.
Components of the Indicator
Exponential Moving Averages (EMAs):
Short EMA (Blue Line): Faster responding average, good for identifying recent trend changes.
Long EMA (Red Line): Slower moving average, helps in confirming longer-term trends.
Support and Resistance Zones:
Resistance Zone (Red): Area where potential selling pressure could overcome buying pressure, halting price increases temporarily or reversing them.
Support Zone (Green): Area where potential buying pressure could overcome selling pressure, supporting prices and preventing them from falling further.
Candlestick Patterns:
Bullish Engulfing Pattern (Green Triangle Up 'BE'): Suggests a potential upward reversal or start of a bullish trend.
Bearish Engulfing Pattern (Red Triangle Down 'BE'): Indicates a potential downward reversal or start of a bearish trend.
Buy/Sell Signals:
Buy Signal (Green Label 'BUY'): Triggered when the price is above both EMAs and a bullish engulfing pattern is detected.
Sell Signal (Red Label 'SELL'): Triggered when the price is below both EMAs and a bearish engulfing pattern is detected.
Trading Setup:
Entry: Consider entering a buy position when the 'BUY' signal appears, indicating bullish conditions. Enter a sell position when the 'SELL' signal appears, indicating bearish conditions.
Exit: Look for closing signals opposite your entry or use predefined take profit and stop loss levels. For instance, exit a buy position on a 'SELL' signal or when the price drops below the support zone.
Risk Management:
Set stop losses just below the support zone for buy orders and above the resistance zone for sell orders to protect against significant losses.
Adjust position sizes according to your risk tolerance and account balance.
Considerations:
Use this indicator in conjunction with other analysis tools and fundamental data to confirm signals and strengthen your trading strategy.
Periodically backtest the strategy based on this indicator to ensure its effectiveness in current market conditions.
Optimization:
Adjust the lengths of the EMAs and the buffer size of the support and resistance zones to better fit the asset's volatility and your trading timeframe.

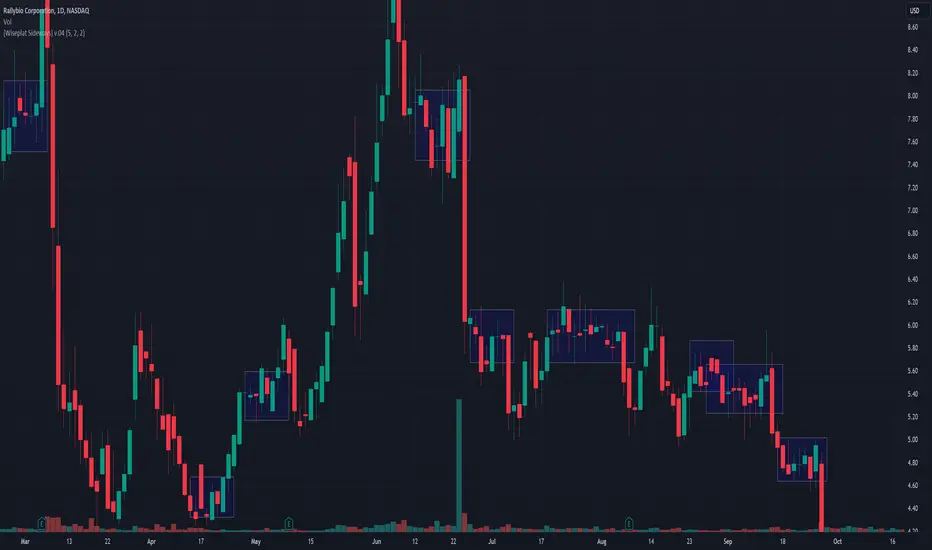
[Wiseplat Sideways] v.04The Sideway indicator for TradingView is a powerful tool designed to identify periods of sideways or ranging price action in the market. With its intuitive interface and customizable parameters, traders can easily spot when an asset is consolidating, providing valuable insights for both trend-following and range-bound strategies.
This indicator utilizes really simple algorithm to analyze price movement and volatility, effectively filtering out noise and false signals. By plotting clear visual cues on the chart.
Traders can adjust the sensitivity parameters to tailor the indicator to their specific trading style and preferences. Whether used in isolation or in conjunction with other technical analysis tools, the Sideway indicator empowers traders to make informed decisions in dynamic market conditions.
Its user-friendly design and simple settings of parameters makes it accessible to traders of all levels, from beginners seeking clarity in choppy markets to seasoned professionals looking for confirmation of their analysis. With the Sideway indicator, traders can confidently navigate sideways price action and stay ahead of the curve in their trading endeavors.
Developer: Oleg Shpagin
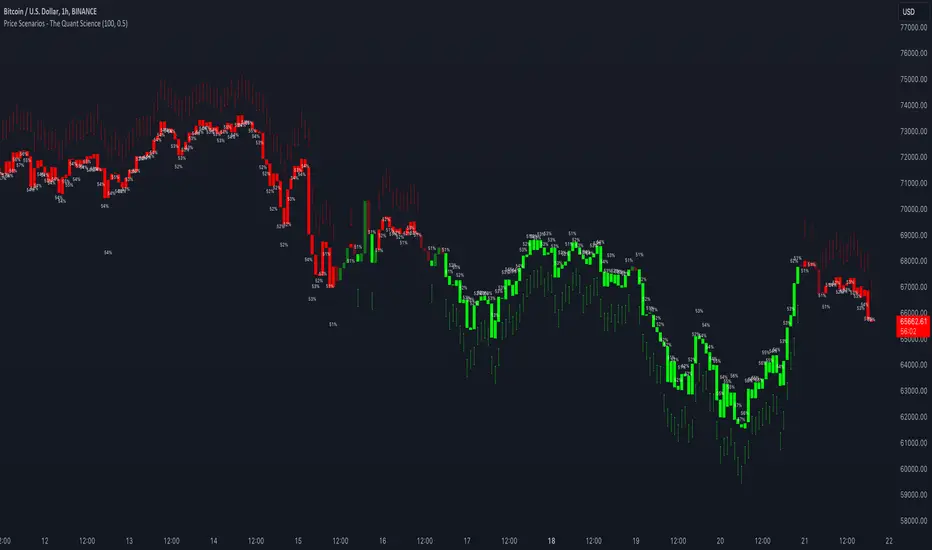
Price Scenarios - The Quant ScienceGENERAL OVERVIEW
Price Scenarios - The Quant Science is a quantitative statistical indicator that provides a forecast probability about future prices moving using the mathematical-statistical formula of statistical probability and expected value.
HOW TO USE
The indicator displays arrow-shaped signals that represent the probable future price movement calculated by the indicator, including the current percentage probability. Additionally, the candlesticks are colored based on the predicted direction to facilitate visual analysis. By default, green is used for bullish movements and red for bearish movements. The trader can set the analysis period (default value is 200) and the percentage threshold of probability to consider (default value is greater than 0.50 or 50%) through the user interface.
USER INTERFACE
Lenght analysis: with this features you can handle the length of the dataset to be used for estimating statistical probabilities.
Expected value: with this feature you can handle the threshold of the expected value to filter, only probabilities greater than this threshold will be considered by the model. By default, it is set to 0.50, which is equivalent to 50%.
Design Settings: modify the colors of your indicator with just a few clicks by managing this function.
We recommend disabling 'Wick' and 'Border' from the settings panel for a smoother and more efficient user experience.
QQE MOD + SSL Hybrid + Waddah Attar Explosion IndicatorINDICATOR PURPOSE
This indicator is designed to complement my original QQE MOD + SSL Hybrid + Waddah Attar Explosion strategy.
Multiple users have requested that I convert the strategy to an indicator because alertconditions do not work on strategies and people want to specific set alerts for BUY, SELL, CLOSE BUY and CLOSE SELL. This can only be achieved using alertcondition().
This indicator functions in the exact same way as the strategy, but it doesn't have any backtesting functionality. I recomment that you use the original QQE MOD + SSL Hybrid + Waddah Attar Explosion strategy for parameter tuning and backtesting, then if you need more control on alerts you can use this indicator for that purpose.
Only other difference is that I have added grey exit labels on the chart since it's not obvious where the exits would happen like it was in the strategy version.
CREDITS
QQE MOD byMihkel00
SSL Hybrid by Mihkel00
Waddah Attar Explosion by shayankm

Targets For Overlay Indicators [LuxAlgo]The Targets For Overlay Indicators is a useful utility tool able to display targets during crossings made between the price and external indicators on the user chart. Users can display a series of two targets, one for crossover events and another one for crossunder event.
Alerts are included for the occurrence of a new target as well as for reached targets.
🔶 USAGE
In order for targets to be displayed users need to select an appropriate input source from the "Source" drop-down input setting. In the example above we apply the indicator to a volatility stop.
This can also easily be done by adding the "Targets For Overlay Indicators" script on the VStop indicator directly.
Targets can help users determine the price limit where the price might start deviating from an indication given by one or multiple indicators. In the context of trading, targets can help secure profits/reduce losses of a trade, as such this tool can be useful to evaluate/determine user take profits/stop losses.
Due to these essentially being horizontal levels, they can also serve as potential support/resistances, with breakouts potentially confirming new trends.
Users might be interested in obtaining new targets once one is reached, this can be done by enabling "New Target When Reached" in the target logic setting section, resulting in more frequent targets.
Lastly, users can restrict new target creation until current ones are reached. This can result in fewer and longer-term targets, with a higher reach rate.
🔹 Examples
The indicator can be applied to many overlay indicators that naturally produce crosses with the price, such as moving average, trailing stops, bands...etc.
Users can use trailing stops such as the SuperTrend or VStop to more easily create clean targets. Do note that certain SuperTrend scripts separate the upper and lower extremities of the SuperTrend into two different plot, which cannot be used with this tool, you may use the provided SuperTrend script below to have a compatible version with our tool:
//@version=5
indicator("SuperTrend", overlay = true)
factor = input.float(3, 'Factor', minval = 0)
atrLen = input.int(10, 'ATR Length', minval = 1)
= ta.supertrend(factor, atrLen)
plot(spt, 'SuperTrend', dir != dir ? na : dir < 0 ? #089981 : #f23645, 2)
plot(spt, 'Circles', dir > dir ? #f23645 : dir < dir ? #089981 : na, 3, plot.style_circles)
Using moving averages can produce more targets than other overlay indicators.
Users can apply the tool twice when using bands or any overlay indicator returning two outputs, using crossover targets for obtaining targets using the upper band as source and crossunder targets for targets using the lower band. We can also use the Trendlines with breaks indicator as example:
🔹 Dashboard
A dashboard is displayed on the top right of the chart, displaying the amount, reach rate of targets 1/2, and total amount.
This dashboard can be useful to evaluate the selected target distances relative to the selected conditions, with a higher reach rate suggesting the distance of the targets from the price allows them to be reached.
🔶 SETTINGS
Source: Indicator source used to create targets. Targets are created when the closing price crosses the specified source.
Show Target Labels: Display target labels on the chart.
Candle Coloring: Apply candle coloring based on the most recent active target.
🔹 Target
Crossover and Crossunder targets use the same settings below:
Show Target: Determines if the target is displayed or not.
Above Price Target: If selected, will create targets above the closing price.
Wait Until Reached: When enabled will not create a new target until an existing one is reached.
New Target When Reached: Will create a new target when an existing one is reached.
Evaluate Wicks: Will use high/low prices to determine if a target is reached. Unselecting this setting will use the closing price.
Target Distance From Price: Controls the distance of a target from the price. Can be determined in currencies/points, percentages, ATR multiples, or ticks.

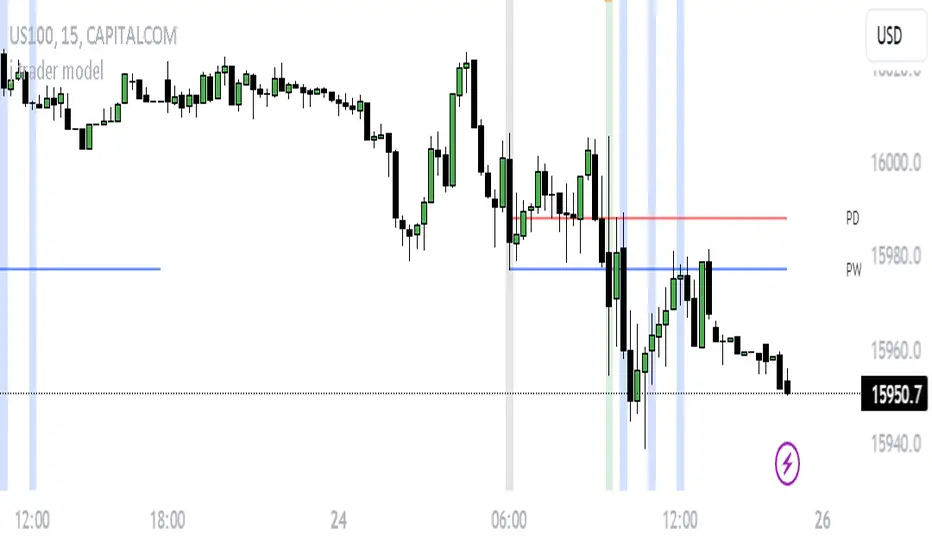
j trader ModelAn indicator designed to trade indices using the jtrader model and ICT concepts.
jtrader Model:
Below are the key points to trade this model:
Power of 3 is the key element of this model.
Accumulation during pre NY open.NY Open represents 9:30am opening of NY Stock Exchange.
Manipulation(JUDA) immediately after NY open. Juda is a manipulated move by the indices after the session open.
Distribution as a reversal with BOS ,Heatmap preferably during Macros. Distribution is market phase where it moves towards its original expansion during macros. Macros are 20 minute time windows where indices give moves with strong force. Heatmap represent kis point of interests for the trade.
Indicator Features:
Creates a complete window of trading with key elements needed to trade The jtrader Model.
Identify and marks key points of interests (POIs).
Identify and highlights key swing points of Sessions, Days, Weeks, True open etc.
Highlights the NY Open.
Highlights the Macros.
Indicator Settings:
Enable/Disable any POI marking.
Adjust session time ranges.
Adjust enabling of model poi marking time window.
Choose color of choice for highlighting the POI.
Enable/Disable Macros.
This indicator will gradually updated with new features to trade the jtrader model. Your feedback will help us improve and enhance this indicator.
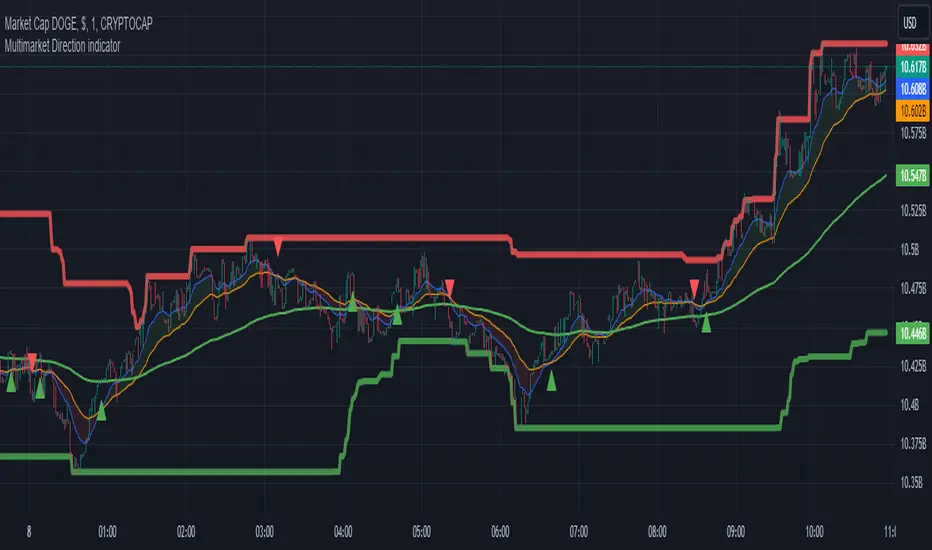
Multimarket Direction indicatorTrendline trading with resistant and support made by me.
Im bad coder and just jump into the tradingview pine script 1 days before so please don't hates me
- I don't know why my script is ded before lol
Signals to trade up
1. The big candles up cross the ema200 (last 5 candles for confirmation)
2. Wait for showing the up triangle.
3. Lookup the resistant/support line. If near the resistant please consider to wait if it break then join the trade
4. Only out trade when it has a down triagle or the candles has big down candles at the resistant/support line.
That it...
K`s Extreme DurationExtreme duration uses a special combination of the RSI and its relative position to deliver a reversal signal.
The following are the conditions to generate signals:
* Bullish signal: The current 8-period RSI is below 50 and above 35 while the previous 5 RSI's are below 35.
* Bearish signal: The current 8-period RSI is above 50 and below 65 while the previous 5 RSI's are above 65.

Breakout/Breakdown Indicator (30 Min Range) by InvestYourAsset👉The indicator provided here is a technical analysis indicator for TradingView users that identifies potential breakout and breakdown opportunities on the initial 30-minute range in every trading session.
👉The indicator high and low of the initial 30-minute period and plotting them as horizontal lines on the chart. The high is marked in green line and the low is marked in red line.
📈The indicator then generates buy and sell signals based on whether the current close price crosses above or below the previous 30-minute high and low, respectively.
📢The indicator also has two inputs:
👉 sessionStartHour : The hour at which the trading session begins. The default value is 9, However users can change the time according to their own trading style.
👉 sessionStartMinute : The minute at which the trading session begins. The default value is 0.
These inputs can be used to adjust the indicator to the specific trading session that you are interested in.
✅How to use the Indicator:
👉To use the 30 Minute Breakout/Breakdown Indicator, simply add it to your chart and configure the inputs to your liking. Once the indicator is added to the chart, it will plot the 30-minute high and low as horizontal lines, as well as generate buy and sell signals based on the current close price.
✅Here is a step-by-step guide:
📈Open TradingView and select the chart that you want to add the indicator to.
📈Click on the "Indicators" tab and search for "30 Minute Breakout/Breakdown Indicator by InvestYourAsset".
📈Click on the indicator to add it to your chart.
📈Configure the inputs to your liking. The default values are typically fine, but you can experiment with different values to see what works best for you.
📈Once you are satisfied with the settings, click on the "Apply" button.
📈The indicator will now be displayed on your chart. You will see two horizontal lines representing the previous 30-minute high and low, as well as triangles representing buy and sell signals.
✅How to interpret the signals:
📈Buy signal : A buy signal is generated when the current close price crosses above the previous 30-minute high. This suggests that the price is likely to continue moving higher in the short term.
📈Sell signal : A sell signal is generated when the current close price crosses below the previous 30-minute low. This suggests that the price is likely to continue moving lower in the short term.
👉Traders should remember that the present indicator is just one tool that can be used to identify potential trading opportunities. It is important to use other technical analysis tools and risk management techniques to confirm your trading signals before entering any trades.
✅Things to consider while using the indicator:
📈Look for buy signals in an uptrend and sell signals in a downtrend. This will increase the likelihood of your trades being successful.
📈Place your stop losses below the previous 30-minute low for buy signals and above the previous 30-minute high for sell signals. This will help to limit your losses if the trade goes against you.
📈Consider taking profits at key resistance and support levels. This will help you to lock in your profits and avoid giving them back to the market.
Follow us for timely updates regarding indicators that we may publish in future and give it a like if you appreciate the indicator.

Drawdown Dynamics IndicatorDescription :
The Drawdown Dynamics Indicator is a straightforward tool that offers insights into three critical aspects of an asset’s financial performance: Total Max Drawdown, Rolling Period Max Drawdown, and Current Max Drawdown. Inside of the indicator, you can select to view either the rolling period max drawdown or the all-time max drawdown. This is represented by the gray line. The blue line represents the asset's current drawdown.
Rolling Period Max Drawdown is more about a snapshot view, highlighting the maximum loss from a peak to a trough for an adjustable rolling time frame. This is a feature not available with other indicators that exist on TradingView.
Total Max Drawdown gives a broad view, showcasing the all-time deepest decline in an asset’s value.
Current Max Drawdown offers a live update, focusing on the asset's present phase and how it's performing in real-time.
Practical Uses :
The utility of this indicator becomes evident when you start exploring the risks and performance metrics of assets. A notable use of this indicator is in comparing the drawdowns of a trading strategy against the inherent drawdowns of an asset. It helps in painting a clearer picture of risk and performance of both the asset and the strategy.
Risk Understanding : By comparing the strategy drawdown to the asset drawdown, traders get to understand if the risk they’re taking aligns with the asset’s natural risk behavior.
Evaluating Strategy’s Strength : If a strategy can weather the storms of the asset's natural drawdown phases and come out relatively unscathed, it can speak to its strength.
Performance Comparison : It also acts as a benchmark tool. Traders can pit different strategies against each other, using the asset’s drawdown as a baseline, to see which one manages risks better.
Disclaimer : This is not financial advice. Open-source scripts I publish in the community are largely meant to spark ideas that can be used as building blocks for part of a more robust trade management strategy. If you would like to implement a version of any script, I would recommend making significant additions/modifications to the strategy & risk management functions. If you don’t know how to program in Pine, then hire a Pine-coder. We can help!

Auto Trailing stoploss By InvestYourAsset💥The Auto Trailing Stop-Loss indicator is a technical indicator that uses the ATR (Average True Range) to calculate a trailing stop-loss for both long and short positions.
💥The signals according to the indicator allows traders to exit from the position before its too late! The indicator can be used to determine when to enter and exit trades.
💥To use the indicator, you simply need to set the input parameters to suit your trading style and risk tolerance. The default values for the parameters are:
p: The ATR period (14)
q: The stop period (20)
x: The multiplier used to calculate the initial high and initial low (1.5)
Calculations:
📈Calculates the ATR using the specified period you can modify ATR period according to your trading style.
📈Calculates the initial high and low stop levels based on the highest high and lowest low over the user defined ATR period.
📈Calculates short and long stoploss levels using the initial high and low stops.
💥Once you have set the input parameters according to your trading style whether you are a day trader or a swing trader, the indicator will plot the short stoploss, long stoploss, and stoploss hit signals on your chart.
💥You can use the indicator to enter and exit trades in a various ways.
For example,
🚀 you could enter a long trade when the price crosses above both red and green lines plotted on the chart. (or when price crosses over both short stoploss and long stoploss.) You could also use the indicator to secure your profits by moving your stop-loss up as the price moves in your favor.
Here is an example of how you could use the indicator to enter and exit trades:
🚀Enter a long trade when the price crosses above the red line or short stoploss.
✅keep Moving your stop-loss upward with the long stoploss or green line.
✅Exit the trade when the price crosses below the long stoploss or green line.
💥You can also use the indicator to protect your existing trades. For example, if you are already in a long trade, you could move your stop-loss up to the short stop when the price moves up 10%. This will help you to protect your profits in case the price starts to move against you.
💥💥some additional tips for using the Auto Trailing Stop-Loss indicator:
✅Use the indicator in conjunction with other technical indicators or your own trading strategy to generate entry and exit signals.
✅Backtest your trading strategy before using it live to make sure that it is profitable.
✅Use the indicator to protect your profits by moving your stop-loss up as the price moves in your favor.
✅ Always follow risk management rules and manage your position sizing according to your risk appetite.
✅ Be aware of the overall trend direction. If the trend is up, you should be looking for bullish reversals or continuations. If the trend is down, you should be looking for bearish reversals or continuations.
This script essentially provides a visual representation of a trading strategy that automatically adjusts stop-loss levels based on market volatility (ATR). It also includes signals for entering long or short positions and visually highlights these signals on the chart.
📣📣Follow us for timely updates regarding future indicators and give it a like if you appreciate the work.📣📣

Swing based support and resistanceThis indicator provided here is for identifying swing-based support and resistance levels. It uses two swing lengths, which can be adjusted by the user, to identify swings in the price data. For each swing length, the script calculates the support level as the low of the swing if the trend is up, or the high of the swing if the trend is down. It then plots the support and resistance levels on the chart, along with buy and sell signals.
The buy and sell signals are generated by comparing the current closing price to the support and resistance levels. If the closing price is above the support level, the script plots a buy signal. If the closing price is below the level, the script plots a sell signal.
To use the script, you would first need to add it to your trading platform. Once it is added, you can configure the swing lengths and other parameters to suit your trading style. You can then apply the script to a chart and begin using the support and resistance levels and buy and sell signals to make trading decisions.
Points to be noted while using the indicator:
# The script is designed to be used on a daily chart. However, you can also use it on other timeframes, such as weekly or monthly charts.
# The swing lengths that you choose will depend on your trading style. If you are a swing trader, you may want to use longer swing lengths. If you are a day trader, you may want to use shorter swing lengths.
# Remember, the support and resistance levels generated by the script are not exact price points. They are rather zones where demand and supply can change. Therefore, you should always use other technical analysis tools and indicators to confirm your trading decisions.
# Overall, the script is a useful tool for identifying swing-based support and resistance levels. It can be used by traders of all experience levels to generate trading ideas and improve their trading performance.
To use the swing-based support and resistance indicator with respect to price, you can follow these steps:
=> Identify the support and resistance levels that have been generated by the indicator.
=> Look for price action that is taking place near these levels.
=> If the price is above the level, look for bullish reversals or continuations.
=> If the price is below the level, look for bearish reversals or continuations.
For Example,
=> Bullish reversal: The price is above the level and forms a bullish candlestick pattern, such as a bullish hammer or engulfing pattern.
=> Bullish continuation: The price is above the level and bounces off of the level.
=> Bearish reversal: The price is below the level and forms a bearish candlestick pattern, such as a bearish hammer or engulfing pattern.
=> Bearish continuation: The price is below the level and rejects the level.
$$ You can also use the indicator to identify potential trading entry and exit points. For example, you could enter a long trade when the price breaks above a resistance level and exit the trade when the price retraces to the resistance level. Or, you could enter a short trade when the price breaks below a support level and exit the trade when the price rallies to the support level.
This swing-based support and resistance indicator is just one tool that you can use to trade. You should always use other technical analysis tools and indicators, such as price action and trend analysis, to confirm your trading decisions.
Additionally:
=> Be aware of the overall trend direction. If the trend is up, you should be looking for bullish reversals or continuations. If the trend is down, you should be looking for bearish reversals or continuations.
=> Use a stop loss order to limit your risk on each trade.
=> Consider using a position sizing strategy to manage your risk.
=> Do your own research and backtest any trading strategy before using it in a live trading environment.
Follow us for timely updates regarding future indicators and give it a like if you appreciate the indicator.
