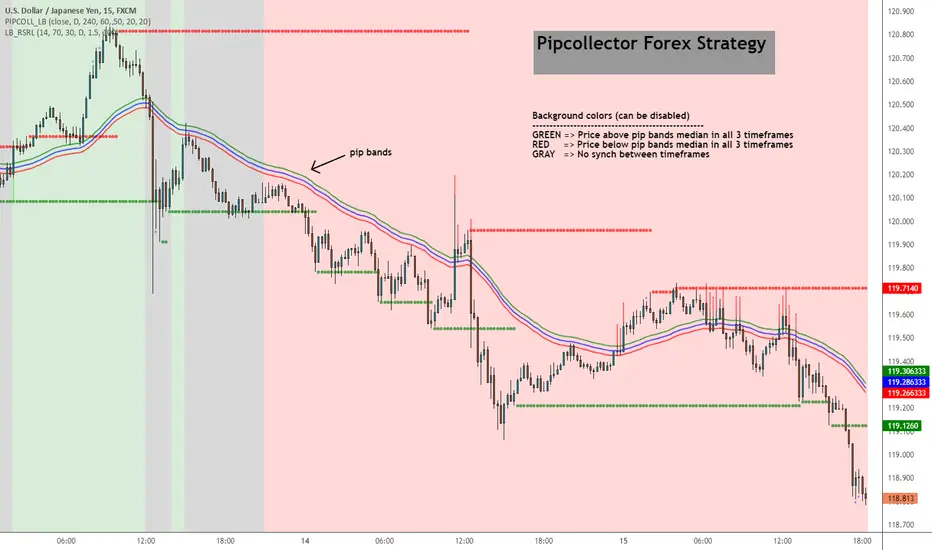
Pip collector [LazyBear]A simple but effective Forex strategy requested by user @pipcollector.
Suggested chart timeframe is 5mins.
Indicator marks potential long/short entries based on the following conditions:
LONG
------
Price above pip median ema on daily, 4 hour and 1 hour timeframe. These 3 timeframes and median EMA lengths are configurable.
Background color is set to GREEN (if option is enabled).
As soon as price touches or crosses the median ema, a GREEN arrow is shown to mark potential long.
SHORT
------
Price below pip median ema on daily, 4 hour and 1 hour timeframe. These 3 timeframes and median EMA lengths are configurable.
Background color is set to RED (if option is enabled).
As soon as price touches or crosses the median ema, a RED arrow is shown to mark potential short.
NO SETUP
-----------
Moving averages do not align on the 3 timeframes.
Background color is set to GRAY (if option is enabled)
I have noticed that this works well on other instruments too (anything trending), also on higher time frames. Feel free to leave any questions/comments on this below.
List of my public indicators: bit.ly
List of my app-store indicators: blog.tradingview.com
Indicators
Belkhayate Timing [LazyBear]--- Update April 11, 2015 ----
I have merged in @TheMighyChicken's code (Thanks!) and added some more options. Updated source here - pastebin.com
Changes:
--------------
- Switch between plain candles and colored oscillator candles.
- Switch between candles and plain oscillator view.
--- Original Description ---
Belkhayate Timing, by Mostafa Belkhayate, is very famous in the Forex groups. This is a port from one of the MT4 versions available. If you have used this in other platforms, do let me know if this looks compared to those.
The usage is similar to that of ValueChart (). The middle area is the centroid or neutral area, the shaded regions (red/green) are extreme and beyond those are AlertZones. This seems to be used in conjunction with his other indicators, but, in my limited testing, I have seen this give a lot of good signals, especially on divergences.
Indicator allows coloring bars based on the oscillator position or show oscillator histogram (Check the options page).
Histogram=ON:
No Oscillator Smoothing:
@TheMightyChicken Can you do your candle magic on this oscillator too, just like you did for ValueChart? :)
More Info:
www.forexfactory.com
List of my public indicators: bit.ly
List of my app-store indicators: blog.tradingview.com

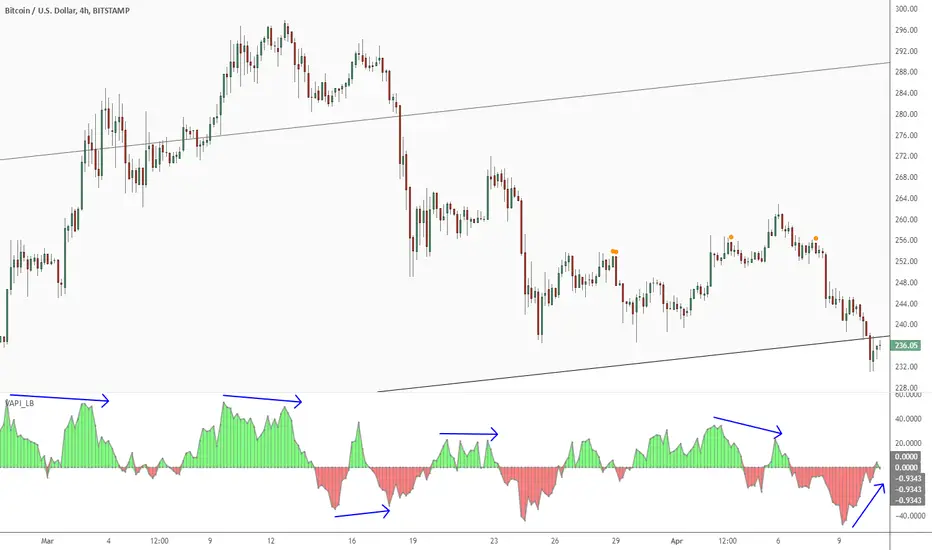
Volume Accumulation Percentage Indicator [LazyBear]Volume Accumulation Percentage Indicator (VAPI) is a variation of the classic volume-accumulation indicators. It uses volume the same way as OBV except that it assigns volume weights based on intraday volatility.
In a positive trend, if the stock price is close to a (local) new high, the VAPI should be at its maximum as well (and vice versa for a negative trend). If the market is looking for a direction, if the price is in the bottom side of his current trading range and if, at the same moment the VAPI osc slopes up, there is accumulation on the stock and that the prices should start to climb. The SELL signal is given when the VAPI decreases (distribution). Divergences are usually very effective too.
Tuning the "length" parameter may be needed for your instrument (default is 10), do let me know if you find a different value to be optimal for majority of instruments.
List of my public indicators: bit.ly
List of my app-store indicators: blog.tradingview.com
UCS_TTM - Reversion BandsOk, Here we go - Version 1 of TTM Reversion Band goes live.
Link to TTM Reversion Band - www.tradethemarkets.com
Link to TTM Reversion Band Guide - kb.simplertrading.com
John Carters Mastering the trade - www.amazon.com
For the amount of information this has, the price tag is not hefty.
John's RTM Chapter Synopsis - www.tradethemarkets.com
What did I modify?
1. Automated the Daily + and Intraday settings. So Switching to intraday will change the setting automatically.
2. Added text callouts for RTM condition
a. John Carter's Indicator
b. Slope Based (my addition).
Future Improvement Planned.
1. Will Convert this into a system based on John's Indicator from TS.
2. Custom Options for Slope and MA setting for Trade filter.

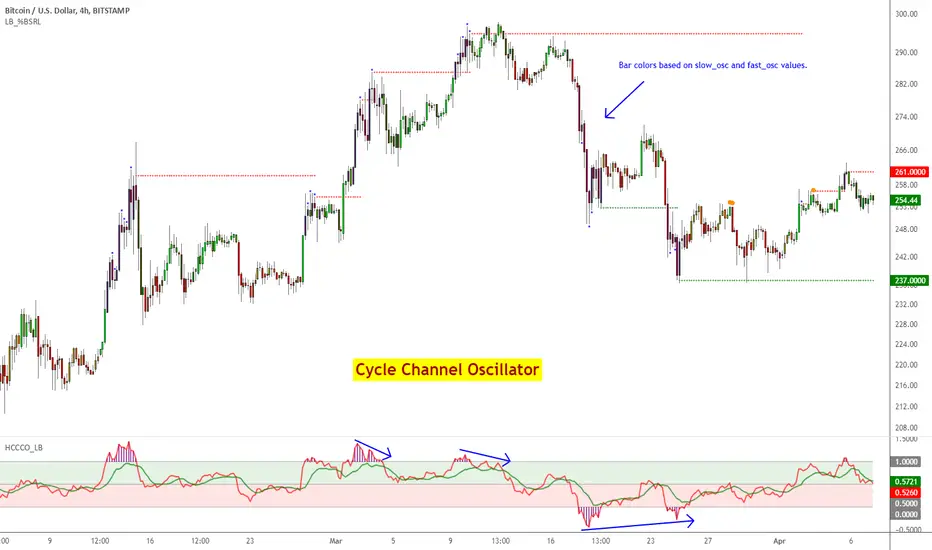
Cycle Channel Oscillator [LazyBear]Here's an oscillator derived from my previous script, Cycle Channel Clone ().
There are 2 oscillator plots - fast & slow. Fast plot shows the price location with in the medium term channel, while slow plot shows the location of short term midline of cycle channel with respect to medium term channel.
Usage of this is similar to %b oscillator. The slow plot can be considered as the signal line.
Bar colors can be enabled via options page. When short plot is above 1.0 or below 0, they are marked purple (both histo and the bar color) to highlight the extreme condition.
This makes use of the default 10/30 values of Cycle Channel, but may need tuning for your instrument.
More info:
List of my free indicators: bit.ly
List of my app-store indicators: blog.tradingview.com (More info: bit.ly)
Hurst Cycle Channel Clone [LazyBear]Cycle Channel is loosely based on Hurst's nested channels. Basic idea is to identify and highlight the shorter cycles, in the context of higher degree cycles.
This indicator plots the shorter term (red) & medium term (green) cycles as channels. Some things to note:
As you can see the red channel keeps moving with in the bounds of green channel. When green breaches red channel, it usually signifies extreme market condition.
Both red & green channels provide support/resistance levels. Also, the green channel provides S/R levels to the inner red channel.
Movement of red channel with reference to green highlights reversal points, reducing momentum et al. For ex., point "(x)" in the chart shows how red channel failed to reach the upper green channel line and highlighted the local top.
Use this just like other bands/channels. I have more indicators derived from this idea, will post them later.
Some more examples:
---------------------------------
MSFT 1M:
DXY 1M:
IWM 1M:
More info:
------------
cyclicwave.blogspot.com
List of my free indicators: bit.ly
List of my app-store indicators: blog.tradingview.com
(Support doc: bit.ly)

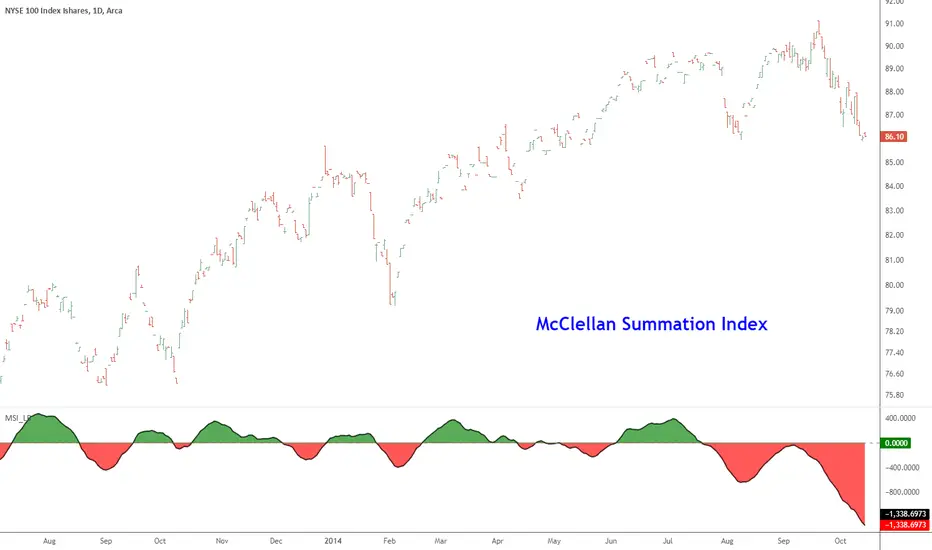
McClellan Summation Index [LazyBear]McClellan Summation Index is a breadth indicator derived from McClellan Oscillator ().
The Summation Index is simply a running total of the McClellan Oscillator values. Even though it is called a Summation Index, the indicator is really an oscillator that fluctuates above/below zero. As such, signals can be derived from bullish/bearish divergences, directional movement and centerline crossovers. A moving average can also be applied to identify upturns and downturns.
Indicator uses the advancing/declining stocks from NYSE by default, but you can change them to any market in the options dialog.
More info:
- www.mcoscillator.com
- stockcharts.com
Complete list of my indicators:
docs.google.com
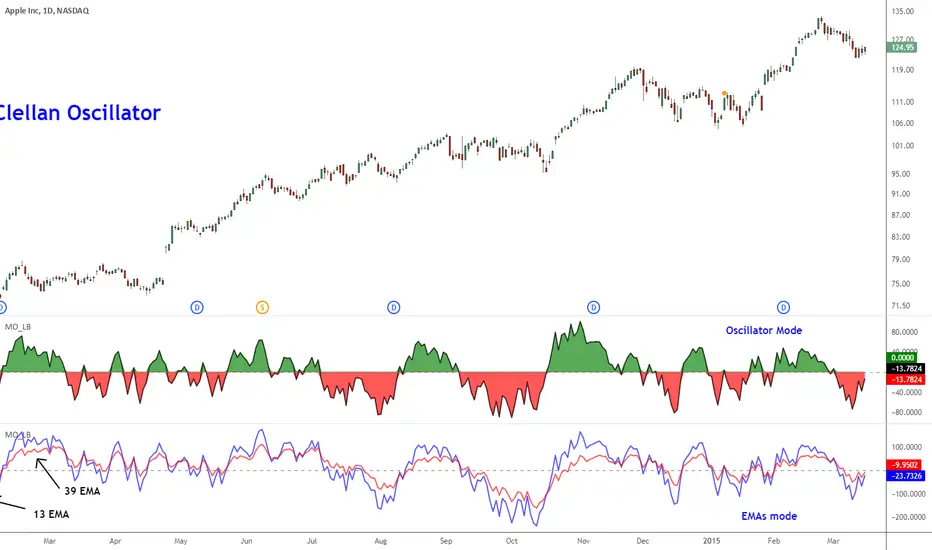
McClellan Oscillator [LazyBear]Developed by Sherman and Marian McClellan, the McClellan Oscillator is a breadth indicator derived from Net Advances, the number of advancing issues less the number of declining issues. Subtracting the 39-day exponential moving average of Net Advances from the 19-day exponential moving average of Net Advances forms the oscillator.
As the formula reveals, the McClellan Oscillator is a momentum indicator that works similar to MACD.
McClellan Oscillator signals can be generated with breadth thrusts, centerline crossovers, overall levels and divergences.
I have added the following options:
- Can choose Advancing/Declining issues of any market. Default is NYSE.
- Can show the EMAs and/or oscillator.
- Ratio Adjusted Calculation mode (as explained in the stockcharts link below) or default mode.
- Can use custom timeframe. Default is chart timeframe.
More info:
stockcharts.com
Complete list of my indicators:
docs.google.com
Thanks @mpinky for pointing out the StockCharts version of this oscillator.
Mirrored MACD [LazyBear]This is a famous indicator I have seen used by many Forex traders in MT4 platform. This indicator uses the difference between EMA of "close" and EMA of "open" to form the oscillator lines (not just a convergence/divergence calculation between EMA of "close")
Current market state is determined by which histogram is above zero line. For more confirmation, wait for it to cross above Signal line too. Crossing down the signal or zeroline should be the exit condition. Also, look for divergences.
Use plot labels BullHisto/BearHisto/BearLine/BullLine/ZeroLine/Signal for setting up alerts.
Complete list of my indicators:
-----------------------------
docs.google.com

LBR Paintbars [LazyBear]
Added coloring of LB bars above/below Keltner Channel (as suggested by user @20813 below in the comments).
Updated code: pastebin.com
See comments section below for a sample chart. Copy the code from the pastebin above and update your local copy (TV doesn't allow me to update an already published code -- yet!).
Added features:
- Switch ON/OFF KC
- Mark LB bars above/below KC
----------------------------------------------------------------------
The LBR PaintBars indicator changes the colour of the price bars based on the trend direction (derived from price & volatility bands). This is mostly used as a confirmation indicator.
For the Pine coders: I suggest trying stdev() in lieu of atr()...some wild combinations can be derived from this simple idea :)
Indicator supports the following options:
- Switching on/off volatility bands
- Switching on/off LBR colors (lime/maroon).
- Color non-LBR bars (blue).
Thanks @mseaworthy for pinging me with this idea.
Complete list of my indicators:
-----------------------------
docs.google.com

Price Volume Rank [LazyBear]Price-Volume Rank, designed by Anthony J. Macek, compares the direction of the change in price (up or down) to the direction of the change in volume and assigns a number to that specific relationship. By quantifying price/volume interaction, P-V rank seeks to determine our position within a typical market cycle.
The various modes shown on the chart above or explained below. Also, read on for a little trick using the new Pine feature that you can use in your script.
How to read the PVR?
-------------------
The most desirable market condition occurs when both price and volume are moving up, that phenomenon is assigned a PVR of 1.
The next most desirable condition, when prices are still moving up but volume is diminishing, is given a PVR of 2. Although still technically healthy, this relationship between price and volume issues a warning that market momentum is weakening.
The worst-case scenario, seen when selling pressure is greatest with prices dropping and volume
increasing, is given PVR's weakest designation, 4.
Finally, even though prices are still moving down, volume begins to diminish as selling pressure abates. This price/volume relationship is assigned a PVR of 3, often alerting us to a potential buying opportunity ahead.
What do the modes mean?
----------------------
1) Histogram Mode: This plots PVR along with helpful ranges. Be careful when PVR is trending at turn-around points.
2) MA Crossover Mode: This plots a slow/fast MA of PVR. Default is 5/10 SMA. Buy is signalled when slow MA falls below fast MA. Sell is signalled when slow MA crosses up fast MA. There is a warning line at 2.5 that can be used for more confirmation.
3) Double Smoothed Crossover Mode: Same as MA crossover, but PVR is smoothed more. Warning line (2.5 level) is very useful in this mode. Use slow MA as the signal and fast MA of PVR for tracking the market.
Misc notes:
-----------
This won't work for Forex and other instruments for which TradingView doesn't expose volume. Thanks to the new Text rendering feature of PlotShape(), I can actually let users know of that :) Good use-case, eh? I will post a sample chart below in the comments.
Feel free to use any part of this code in your indicators.
More info:
--------
Stocks & Commodities V. 12:6 (235-239): Price-Volume Rank by Anthony J. Macek
Complete list of my indicators:
-----------------------------
docs.google.com

Moving CO-covariance (covariance on covariance)This is Covariance on Covariance. It shows you how much a given covariance period has deviated from it mean over another defined period. Because it is a time series, It can allow you to spot changes in how covariance changes. You can apply trend lines, Fibonacci retracements, etc. This is also volume weighting covariance.
This is not a directional indicator nor is moving covariance. This is used for forecasting volatility. This must be used in conjunction with moving covariance.
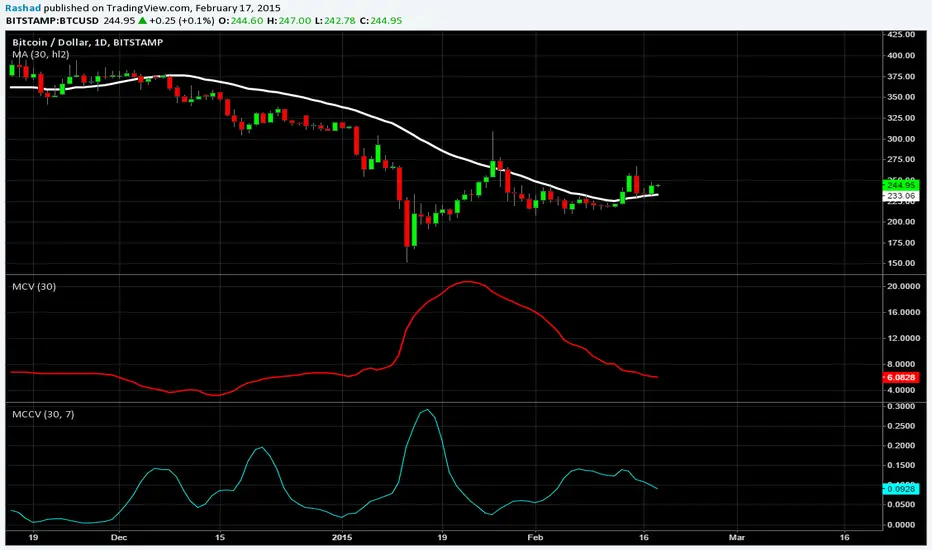
Moving CovarianceCo-variance is a representation of the average percent data points deviate from there mean. A standard calculation of Co-variance uses One standard Deviation. Using the empirical rule, we can assume that about 68.26% of Data points lie in this range.
The advantage to plotting co variance as a time series is that it will show you how volatility of a trailing period changes. Therefore trend lines and other methods of analysis such as Fibonacci retracements could be applied in order to generate volatility targets.
For the purpose of this indicator I have the mean using a vwma derived from vwap. This makes this measurement of co-variance more sensitive to changes in volume, likewise are more representative a change in volatility, thus giving this indicator a "leading aspect".

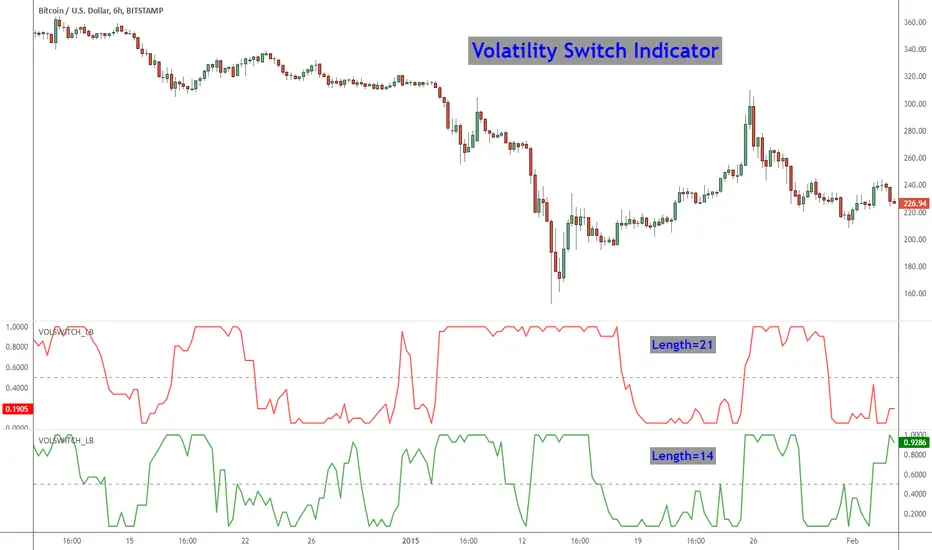
Volatility Switch Indicator [LazyBear]The Volatility Switch (VOLSWITCH) indicator, by Ron McEwan, estimates current volatility in respect to historical data, thus indicating whether the market is trending or in mean reversion mode. Range is normalized to 0 - 1.
When Volatility Switch rises above the 0.5 level, volatility in the market is increasing, thus the price action can be expected to become choppier with abrupt moves. When the indicator falls below the 0.5 level from recent high readings, volatility decreases, which may be considered a sign of trend formation.
Trading strategy as suggested by Ron McEwan is:
- If VOLSWITCH is less than 0.5, volatility decreases, which may be considered a sign of trend formation
- If VOLSWITCH is greater than 0.5, market is in high volatility mode. Can be choppy. Use RSI to look for OB/OS levels.
I have implemented support for 2 lengths (14 and 21) Note that, Pine doesn't support loops. Once it is introduced, I will publish an updated version.
Building a strategy out of this is straightforward (refer to my strategy explanation above), I strongly encourage new Pinescript coders to try to a plotarrow() based overlay indicator to get more familiar with Pine.
More info:
---------
The Volatility (Regime) Switch Indicator : traders.com
Complete list of my indicators:
-------------------------------------
docs.google.com
Vortex Indicator with Thresholds DefinedA problem I noticed with the built in Vortex indicator was that it didn't include any defined thresholds that are important to understanding how to read the vortex indicator. So I modified the vortex indicator in order to have the thresholds built in so you don't have to draw horizontal lines on your chart.

EMA Wave Indicator [LazyBear]This is a 3 EMA visualization tool. Relative momentum across 3 timeframes are rendered as A/B/C waves. Also, helpful in identifying spike/exhaustion bars.
When all the waves are in the same direction, the momentum is very high on that direction. I have made all options configurable, have fun tuning for your instrument :)
Complete list of all my indicators:
docs.google.com

Coral Trend Indicator [LazyBear]This is a famous trend indicator in MT4 platform. Is this better than other MA based trend systems? I will let you decide that :)
Supported modes:
- Trend mode: This is the default. Draws a trend line (like MA) and colors them based on the trend.
- Ribbon Mode: Shown at the bottom pane. No trend lines are drawn.
- OverlayMode: Bars are colored based on the current trend. Trend line is also displayed (default color=gray).
Complete list of all my indicators:
docs.google.com

Anchored Momentum [LazyBear]Anchored Momentum (AMOM), by Rudy Stefenel, is a modified momentum indicator to capture the relative momentum. AMOM uses SMA as the reference for deriving momentum, thereby anchoring it to that MA rather than "value of close n bars back".
Mr.Stefenel suggests using this like other oscillators -- crossing signal line, crossing zero, divergences.
For alerts, use "Momentum", "Signal" and "ZeroLine" plots.
Configurable options:
- Momentum Period: Default is 10.
- Signal Period: Default is 8.
- Smooth Momentum: Default is FALSE. If TRUE, enables EMA(close) to be used rather than "close".
- Smoothing Period: Default is 7. If momentum smoothing is enabled, this period is used.
- Show Histogram: Default is FALSE. This is not histogram per se (indicator - signal), but is used for highlighting the crosses. Check out the histogram pane below to see an example.
- Enable Barcolors: Default is FALSE. If enabled, colors the price data (bars/candles) using histogram color.
More info:
Anchored Momentum, Stocks & Commodities V16:2 (89-98)
Complete list of all my indicators:
docs.google.com

Market Direction Indicator [LazyBear]Market Direction Indicator (MDI), by Donald Lambert, is an extension of simple moving average cross over systems. Series of price cross over points are determined to derive MDI.
Note that the short/long lengths will differ between instruments. They need to be tuned properly.
I have added an option to specify a "cutoff" parameter. When MDI is in the cutoff zone (-/+ cutoff), bars are colored gray. Set this to zero to turn off cutoffs.
Other options:
- OverlayMode: Enable this to color bars. MDI values are not plotted. If unchecked, MDI default rendering mode is Histogram mode.
- ShowBelowZero: Plots the negative values below zero (Oscillator mode)
Use "MDI" and "ZeroLine" for setting up alerts. Make sure MDI is in OscillatorMode.
Master list of all my indicators:
docs.google.com

Variable Moving Average Bands [LazyBear]VMA Bands are ATR bands with VMA as its centre. For a description of options, refer to my VMA post:
I have moved VMA calculation in to a separate function. Feel free to use calc_vma() in your scripts. For more MA calculation function (KAMA, VIDYA and others), refer to my complete list of indicators below.
Wish you all a very prosperous New year. Hope these indicators make you all more money this year too :)
List of my other indicators:
- GDoc: docs.google.com
- Chart:

Variable Moving Average [LazyBear]Variable Moving Average, often abbreviated as VMA, is an Exponential Moving Average developed by Tushar S. Chande. VMA automatically adjusts its smoothing constant on the basis of Market Volatility.
Use this like other Moving Averages. I have added the following options that can be enabled via options page:
- Trend Direction Indication: Green = Up trend, Blue = Potential congestion, Red = down trend.
- Color bars based on Trend
More info:
www.thewizardtrader.com
List of my other indicators:
- GDoc: docs.google.com
- Chart:

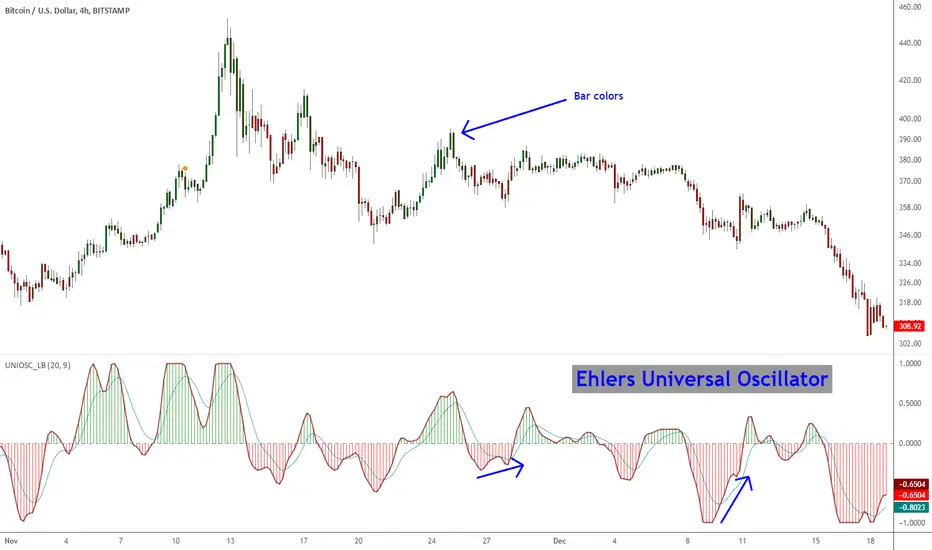
Ehlers Universal Oscillator [LazyBear]Universal Oscillator by Mr. Ehlers is an evolution of his SuperSmoother filter. The new indicator follows the swings in price without introducing extra delay.
It is controlled through one single input – the band edge – which basically is frequency. The smaller it is set, the less lag there is, but you may see lot of whipsaws. Built-in automatic gain control normalizes the output to vary between the range of -1 to +1.
Mr. Ehlers suggests a straightforward system:
- Buy when long-term Universal Oscillator crosses above zero
- Sell when long-term Universal Oscillator crosses below zero
I have added options to draw a signal line, histogram and bar coloring. Bar coloring, if enabled, is done using the histogram color, but you can change it easily to signal_cross by uncommenting a line (check the source).
More info:
Whiter is Brighter - Ehlers
List of my other indicators:
- GDoc: docs.google.com
- Chart:
Vervoort Heiken-Ashi LongTerm Candlestick Oscillator [LazyBear]HACOLT (Heikin Ashi Candles Oscillator Long Term) is a technical indicator designed by Sylvain Vervoort. It is based on Mr.Vervoort's other indicator, HACO (Heikin-Ashi Candles Oscillator - posted here: ).
Optimized for long-term trading, HACOLT shows three levels: -1, 0 and 1. These levels suggest "an open short position", "no open position", and "an open long position", respectively. Passing from a certain level to another is viewed as a trading signal:
- Rising from -1 or 0 to 1 suggests a Long Entry and Short exit;
- Falling from 1 to 0 or -1 suggests a Long Exit;
- Falling from 1 or 0 to -1 indicates a Short Entry.
Fits in nicely with any trading setup as a confirmation indicator
More info:
- tlc.thinkorswim.com
- www.motivewave.com
List of my other indicators:
- GDoc: docs.google.com
- Chart:
