피보나치

bg_FibCastVersion 1.0
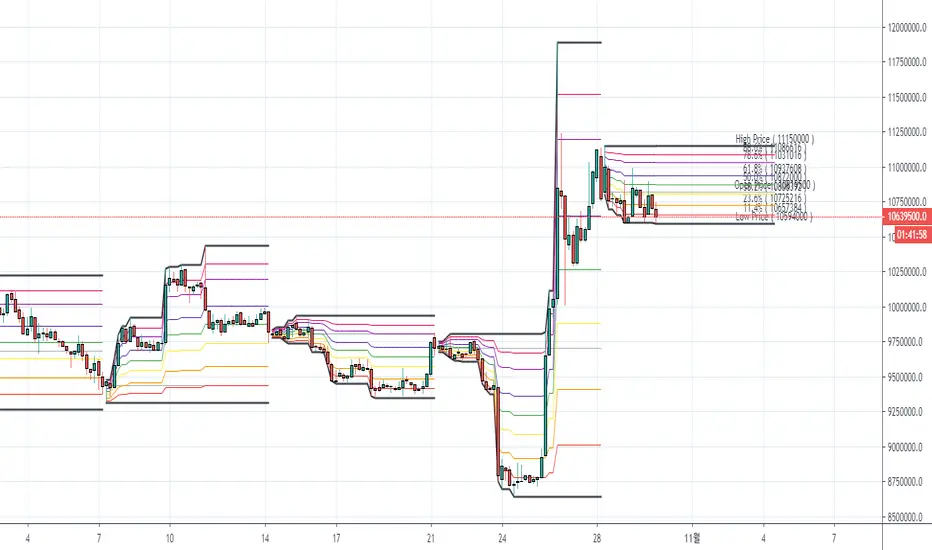
A simple script to place horizontal lines where fib levels are, over a given period of candles, on a specified or charted time-frame. Includes the option to fib-retrace a "sub-zone" or the space between Fibonacci levels.
In The Depicted Example Above:
- Large white Fibonacci Lines from 377 Daily Candle Range, Gray "Sub-Fib" levels are plotted in "Zone 4" of the 377 1D Fib. Re-trace. (Zone 4 is between the 0.5 and 0.618, Zone 3 is between 0.618 and 0.786, etc.)
- Optional 1.618 Fib Extension is available for the main Fibonacci indicator, but is not shown here (Disabled/Hidden).
- Supports multiple time-frames, which is also depicted above. (377 Daily Candles used on 12-Hour chart.)

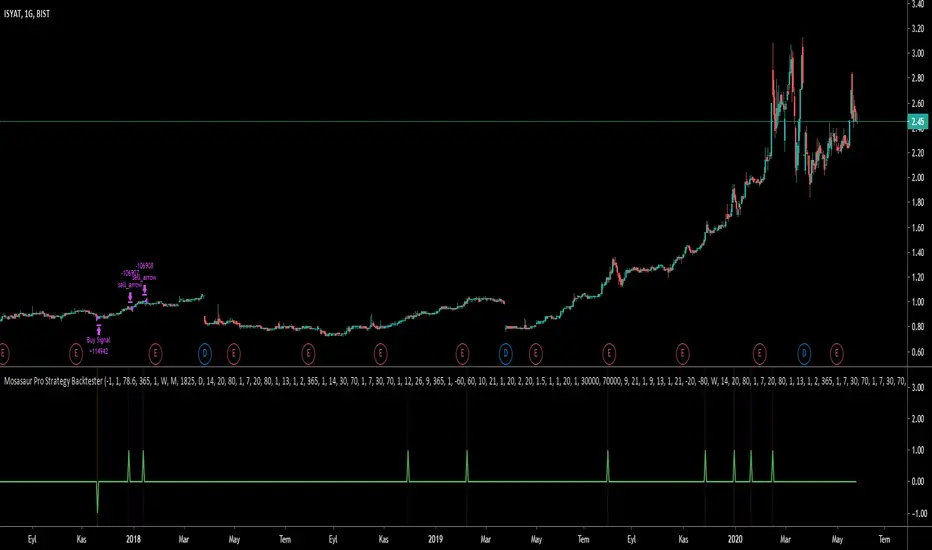
Mosasaur Pro BacktesterBacktester indicator for Mosasaur ◬ | Comprehensive & Profitable Trading Setup Builder available for free here.
Scroll all the way down in the setting menu to adjust the backtesting strategy.
Current features:
Find out the backtesting results for your customized strategy.
Set alerts for strong buy, buy, strong sell and sell signals.
Option for waiting fractal candle stick pattern before entering or exiting.
All features and setups used can be found on this tradingview page.
This backtester has settings of:
Setting 1 lets user select the source for putting a buy order.
Setting 2 lets user select the source for putting a sell order.
Setting 3 defines how much percent user wants to risk per trade to buy.
Setting 4 defines maximum possible trades for buying.
Setting 5 lets user only buy with fractal bottom after a buy signal has been found.
Setting 6 lets user only sell with fractal top after a sell signal has been found.
Setting 7 lets user only buy if the pre defined time period has elapsed on the chart.
Setting 8 lets user only sell if the pre defined time period has elapsed on the chart.
Setting 9 lets user only buy with a strong buy signal (orange color).
Setting 10 lets user only sell with a strong sell signal (purple color).
Setting 11 defines the time period to be elapsed to trigger a buy.
Setting 12 defines the time period to be elapsed to trigger a sell.
Upcoming features:
Advanced pre-defined strategies for user to select from. This will also auto adjust the setups and time frames being combined.
Stop Loss and Stop to Trailing options for the strategy.
Stop Loss and Stop to Trailing alerts.
Defining risk/reward ratio before entering the trade.
~Bo
Founder of Megalodon Indicators
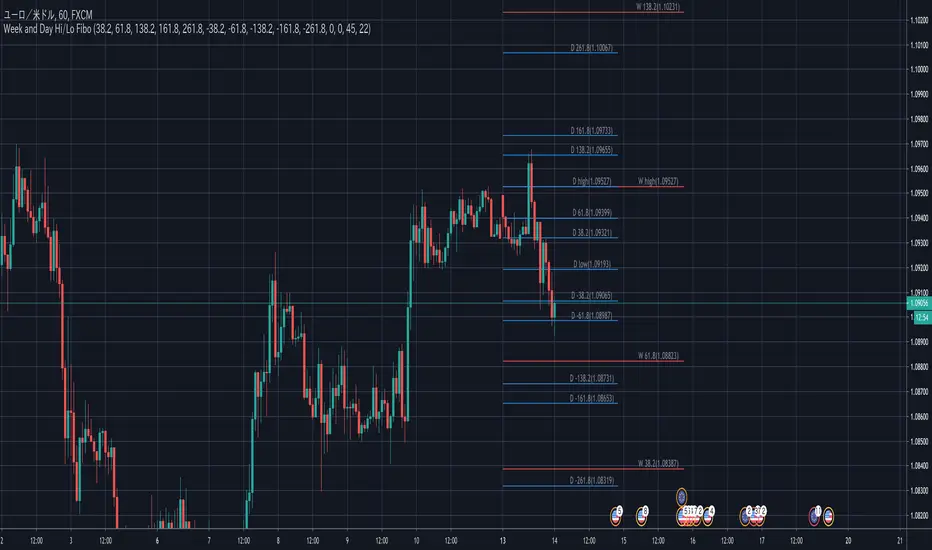
Week and DAY High/Low Fibo LineDraw Fibonacci retracements using High/Low of the previous week
Draw Fibonacci retracements using High/Low of the previous day
A Fibonacci value of 0 will hide the line
Ori Auto Fibonacci RetracementDraws last -input- bars fibonacci retracement levels.
Change Styles
Change Colors
Switch Placements
Change Line Width
Reverse Levels
Extend Rigt, Left or Both
Change Fib Levels
Hide info labels

Hiubris AutoFibFeatures
-Automatically drawn Fibonacci Retracement Levels based on the input Lookback Period
-Corresponding labels for each level (Price & Level)
-Fully customizable Levels and Lines through user Inputs
-Alerts based on crosses of any of the levels (Up or Down)
* Option to display a customizable Linear Regression

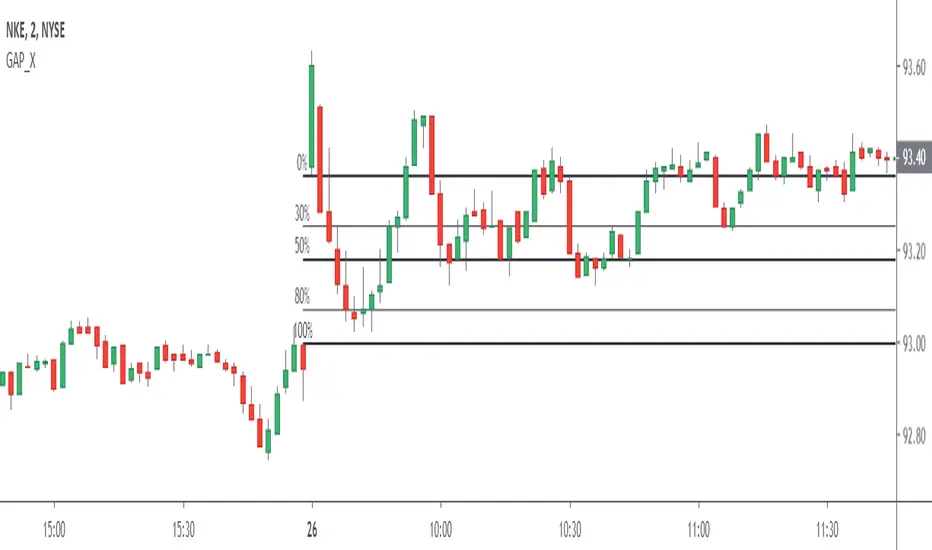
Gap Automatic Retrocess LevelsThis Script detects Bearish / Bullish GAP at market opening 09:30 am NY and automatically traces backward levels, of which 2 are configurable at your discretion.
Bundle of various indicators, All-in-oneThis scripts compiles many indicators into one. It comes from many sources and i added all sources i used. If i forgot one, don't hesitate to message me.
This is useful if you need to setup your chart layout fast. The menu makes it easy to configure it.
You can configure and display:
- Various types of moving averages: RMA, SMA , EMA , WMA , VWMA , SMMA , HullMA, LSMA , DEMA , TEMA
- Stochastic RSI crosses from multi-timeframes directly on candle's close (1h, 4h, D, W)
- Bollinger bands with primary and secondary deviation
- SAR
- Color background using difference between Stochastic RSI K and D
- Support and resistance
- Open high low close from higher timeframes (D, W, M)
- Auto fibonacci levels (still a work in progress, i will add logarithmic fibonacci levels too later)
- "Alt season" for crypto users: if BTC dominance cross his SMA , display a pictogram on every chart
Stil working on:
- Auto fibonacci levels: i will add logarithmic fibonacci levels
- Stochastic crosses
- Alt season: use others types of moving averages
If you have any suggestions / improvements, feel free to message me or write it in the comments below.

FibboGattoFibboGatto
Up = crossover(FG,ema(FG,period)) , color=blue
Down = crossunder(FG,ema(FG,period)) , color=orange
Uptrend = (FG>ema(FG,period)) ,color=lime
Downtrend = (FG

Periodic Auto Fibonacci by Atilla YurtsevenPeriodic Auto Fibonacci indicator automatically draws Fibonacci retracement ratios on the chart for the selected period. For example, if you select the weekly period, indicator will plot past and live retracement ratios on the chart. You can even shift periods. For example, if you shift by 1, last weeks retracement ratios will be plotted for the live session.
You can use this indicator with any supported time frames.
Periodic Auto Fibonacci helps you to identify fibonacci confluences as well.
Important: As current session of the selected period continues, most recent session will be repainted as low and high of the selected period changes. (For the live market)
Disclaimer: This is not financial advice.
Trade safe,
Atilla

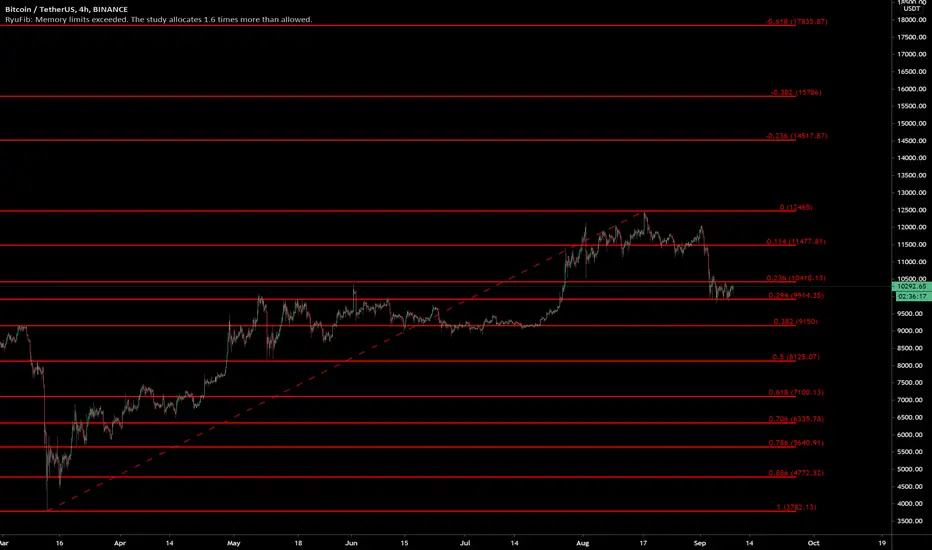
RyuFib🔰 Auto Fibonacci Retracement
New look, features, and improvements from the previous auto Fibonacci indicator. Now looks like the Fib Retracement Tool that you can draw and with all of it's settings options. This indicator will automatically draw all the Fibonacci levels onto the chart and update for each timeframe and adjust saving you time. By default the length is long so it will show the major levels, however, can be adjusted to any custom length or shorter length to select various retracements. An improvement to the indicator in the update is that now it will auto update and adjust to fit the history length. The previous custom timeframe option has been removed, since you can select any length for retracement anyways and is not needed. Lines that go further back in history that are not shown in the chart view are not loaded to prevent loading lines not in view, this done by TradingView. So if the length is long the lines do not appear unless you scroll back further in history to the start point in time of the retracement history. To prevent this, by default the lines are extended to the left so you don't have to scroll back for them to show, but you can still turn off the extend if you choose. Another update improvement is that it will now auto detect and adjust the Fibonacci retracement type, i.e, from high to low or low to high with the appropriate levels, with the option to reverse like the tool gives. Now also shows the trend line which shows the points used from the retracement from the high and low, which can also be turned on/off. Additionally, another improvement now the Fibonacci price levels are shown along with the levels.
This indicator shows all of the common default Fibonacci levels as well as my own added fib levels for the default levels, with the default extension levels, and added custom levels. By default there 9 of the common and my added Fibonacci levels displayed, plus the 2 for the high and low, so 11 levels, plus default 3 extension levels and 3 reverse extension levels, and 18 additional custom Fibonacci levels that are hidden and can be turned on and adjusted. So there are 35 total Fibonacci levels with the levels and price labels. All of the Fibonacci levels can be customized and adjusted in the settings with an input and can be turned on/off to be shown or hidden.
You don't need to do anything, simply load the indicator and it will auto adjust the appropriate length if needed, retracement type, and display the Fibonacci levels for each timeframe and update. However, you can still change the custom Fibonacci settings and style settings as you choose.
📌 Note: New update and redesign updated to new version pine script v4. This is published as a new indicator since it is now completely different redesigned with updates and improvements, and since the description was too long to fit in an update. This older Auto Fibonacci indicator is no longer used and updated by this one.
📌The following are the custom settings options of the user interface:
📌 For the plots display options:
Can show/hide all Fibonacci levels with a single master control switch
Can turn on/off the default Fibonacci extension levels
Can turn on/off the default Fibonacci reverse extension levels
Can show/hide all Fibonacci levels labels
Can show/hide all Fibonacci price labels
Can show/hide the Fibonacci trend line
📌 Fibonacci retracement settings:
Can adjust each Fibonacci level custom input
Reverse option to reverse the levels retracement type and levels
Can select the Fibonacci length max bars back, which will also auto adjust if needed if too long
Option to select the candle type for the retracement to use wick or candle close, default uses wick
📌 Fibonacci custom style settings:
The style settings updates for all 35 Fibonacci levels so you don't have to do individually
Can adjust all of the colors to your preference, default red since works for both black/white backgrounds
Adjusting the color will adjust all of the colors for the levels line, levels label, and price label
Can adjust the lines to solid, dashed, or dotted as preferred
Can extend lines to the left, right, or both, or turn off, default extended left
Can change the levels labels to display as levels or percents, i.e, 0.618 or 61.8%
Can adjust the width of the Fibonacci lines
Can adjust the size of the Fibonacci levels and price text labels
Can adjust the offset to shift the levels and price text labels
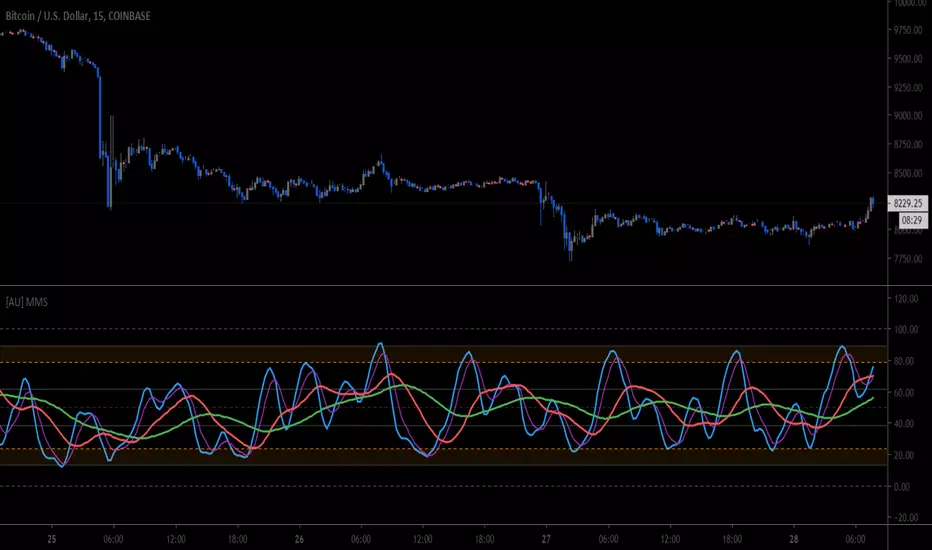
📌 Example on Bitcoin currently on the 1h showning Fibonacci levels being respected.
📌 Another example with BTC on the 15m showing price ping pong between Fibonacci levels; and with different settings with white color and levels shown as percents option.
📌 Here is Bitcoin again on the 1D timeframe with just default settings. Based on the history the indicator automatically selected the appropriate length and shows the high and low point and drew the levels. We can see the major Fibonacci levels being respected and with the extension levels can see the further future potential resistances.
Swing Trade Pros - Auto Fibonacci IndicatorThe Swing Trade Pros Auto Fibonacci indicator automatically plots a fibonacci retracement based on the swing high and swing low of the weekly price action. The fibonacci is automatically updated in real time as new highest and lowest values appears amongst the selected bars. The indicator accurately predicts the high and low points of the overall trend.

[ALL-IN-ONE] Algorithmic S/R and Pivots and Long Term LevelsHello my trading padawans.
Hope you're all having a blast
Here's the invite-only script of the week. The ALL-IN-ONE saga continues with another script.
This time, I compiled a lot of algorithmic supports and resistances (S/R) - to be used with any indicators out there.
Those S/R are universal and work with all asset classes (FOREX, CRYPTO, INDICES, STOCKS, COMMODITIES, ...)
No one can predicts which S/R will stop a move - generally - the high timeframes S/R + the SMAs with a big input value - work as strong walls often forcing the candles to retrace a bit short-term.
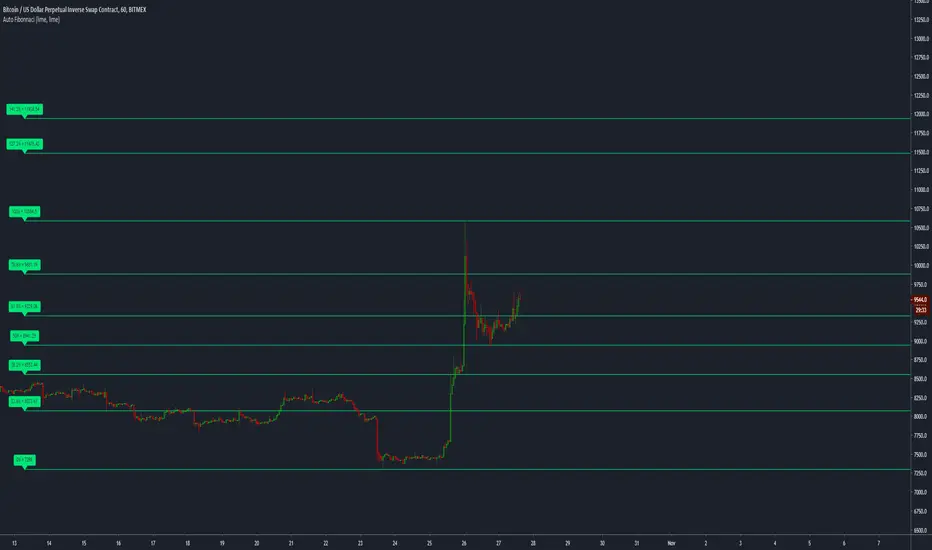
At Today's post (October, 25th 2019 - 12 pm UTC-4), we see how useful they were, to identify how high BTC/USD could go before retracing.
I. 💎 SCRIPTS ACCESS 💎
1.🖐️ Access can only be requested through my website.
2.🖐️ My website URL is in this script signature at the very bottom (you'll have to scroll down a bit and going past the long description) and in my profile status available here : Daveatt
3.🖐️ A tutorial article/video will be provided on those sub mentioned links + Tradingview
4.🖐️ You obviously can contact me directly for more information
II. 🔎 ALL-IN-ONE Supports and Resistances 🔎
You can display the algorithmic S/R, and/or pivots, (not finished yet) and the long terms levels.
For the 3 types of S/R, I pre-selected those that I think are the most relevant and useful for everyone. Please let me know if you'd like me to add/remove some.
All those listed by default are important and provide a MAP for a trader.
They give great take profits zones, levels where it's better to wait for a pullback before entering.
2.1 👁️🗨️ S/R mode 👁️🗨️
Each type of S/R can be displayed or not.
2.2 📱 Mobile optimized display 📱
Preview : imgur.com I posted 2 images there
The script is made using the newest version of Pinescript, and displaying small labels for every support/resistance.
✨ This will come in handy for mobile users - they'll get nice looking labels displayed at the right of their chart.
Each S/R type have its own labels and label position. The script users can activate/deactivate them at will
Let's review quickly each one.
2.3 Algorithmic SMAs
I cherish, love, sometimes despite them, but they're very relevant for all asset classes. The tool displays as many relevant algorithmic and generic SMAs that I could think of.
The indicator lists about 18 different SMAs in multiple timeframes.
2.4 Pivots
7 pivots are displayed (S1/S2/S3/P/R1/R2/R3)
You can choose one of 4 pivot point types:
- Traditional
- Woodie
- Fibonacci
- Camarilla.
The fun doesn't stop here. You can also select a timeframe between Daily/Weekly/Monthly/Yearly for those pivots.
For INDICES, for example, I use a lot the daily Traditional Pivots.
2.5 Long Terms Levels
Display by default the highest/lowest weekly/monthly/quarterly/monthly levels.
The scripts user can chose to select the previous highest/lowest also.
-------------------------------------------------------------------------------------------------------------------------------------
If you have any doubts or questions, please hit me up directly or ask in the comments section of this script.
I'll never claim I have the best trading methodology or indicators.
You only will judge and I'll appreciate all the questions and feedback you're sending my way.
They helped me a ton for developing indicators based on all the requests I received.
May the force 💪 be with you all 🥳.
Dave

ote 3d v0This was supposed to be an automatic ICT OTE (Optimal Trade Entry) Fib level placement on a 3-day scale, but this did not turn out anywhere near close to how I envisioned it working.
Probably with some more development and applied math for the fib levels, I can get this to work even with breached 3D levels, but currently it's an exercise in frustration.


Auto Fibonacci by CryptoProToolsIt's been a while since we've released a free indicator so here we go.
Clean and Simple Automated Fibonacci Retracement levels
Includes the Golden Pocket zone
Ability to alter how far back the script looks to find the swing high and low.
-------------------------------------
Like this indicator? Check out our profile to see the full library of custom indicators available to CryptoProTools members (link in comments)

Cyatophilum Levels IndicatorPlot instantly Support/Resistance and Fibonacci levels!
How to use?
Simply add the indicator to any chart from the invite only tab. This indicator instantly display Support/Resistance and Fibonacci levels. Works on any TradingView market : Forex, Stocks, Cryptocurrency, CFD, Futures, Indexes. You can use it on any timeframe.
Support/Resistance and Fibonacci levels
Use these levels to find take profit targets for your trades. Use multiple levels to setup multiple take profit exit targets.
Trade Breakouts
When a level is broke with great strength, there is a strong opportunity of trade. Go short when the support is broke to the bottom. Go long when the resistance is broke to the top.
Does not repaint ! Proof
> > Start using this indicator now! < <

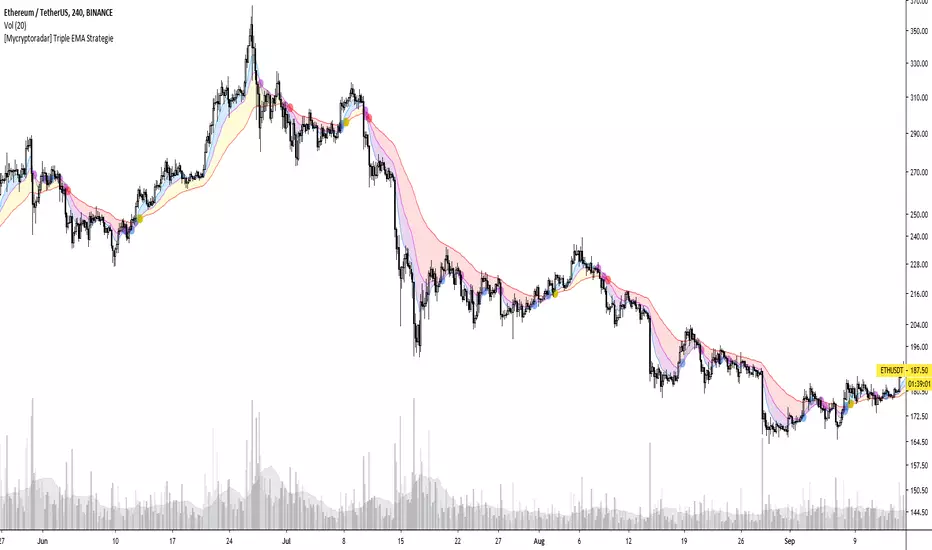
[Mycryptoradar] Triple EMA StrategieTriple EMA strategy consists of EMA 9, 21 & 55. A widely discussed trading strategy. If you want to know more about this strategy, enter the following search term at Google, "triple EMA 9, 21, 55 strategy".
How does this indicator work!
Background blue / yellow = bullish
Background red / purple = bearish
Every EMA crossover can be displayed on the chart (see circles)
Blue / blue / yellow circles = bullish
Purple / purple / red circles = bearish
Play with the settings and adjust them to your hand and don't forget to read about the EMA 9, 21, 55 strategy. Each background and crossover marking can be switched on and off separately.
This indicator visualizes the strategy and is not financial advice, you trade on your own findings. Has the indicator helped you with trading? Then leave a comment and like the indicator.
WANNA TIP ME? BUY ME SOME BEERS!
BTC: 3BMEXX5JrX94ziUSoQMLEmi51WcYwphAg3
ETH: 0x541e504bb461aa141de6ddce09dc89eb16f58f9c
LTC: LPBJXzUZJksCuCK27AY2qAVYGGGiUfejok
DON'T FORGET TO LOOK AT OUR SITE MYCRYPTORADAR
Fibo Market Interpretation Level V1.0Fibonacci ini yang saya gunakan untuk menginterpretasikan pasar. Dimana saya menggunakan beberapa level fibonacci retracement untuk menentukan level-level psikologis dari pasar.

Auto Fibonacci Retracement Levels A Fibonacci retracement is a popular tool that traders can use to identify support and resistance levels, and place stop-loss orders or target prices.
The indicator connects any two points that are relevant, a high and low point.
The percentage levels provided are areas where the price could stall or reverse.
Levels should not be relied on exclusively. For example, it is dangerous to assume the price will reverse after hitting a specific Fibonacci level. It may, but it also may not.
Fibonacci retracement levels are most frequently used to provide potential areas of interest. If a trader wants to buy, they watch for the price to stall at a Fibonacci level and then bounce off that level before buying.
The most commonly used ratios include 23.6%, 38.2%, 50%, 61.8% and 78.6%. These represent how much of a prior move the price has corrected or retraced.
