Dinapoli LevelsThis indicator displays Fibonacci levels in a clearer way. That helps to identify Confluence and Agreement zones.
Once the indicator is added to a chart, you must select the A-B focus points:
In an Up Swing, the A-point would be the Low Pivot and the B-point would be the High Pivot.
In a Down Swing, the A-point would be the High Pivot and the B-point would be the Low Pivot.
Due to Tradingview limitations, the indicator needs to be deleted and re-added to the chart every time you need to draw new levels.
The indicator can be added as many times as D-Levels you indend to display.
Here are its main features:
Select which levels to display for each instance of the indicator (F3, F4, F5).
Customize the color for each level.
Display the price tag.
Customize the distance to the right at which the levels are displayed.
Customize the width of the levels.
Customize the thickness of the lines.
피보나치

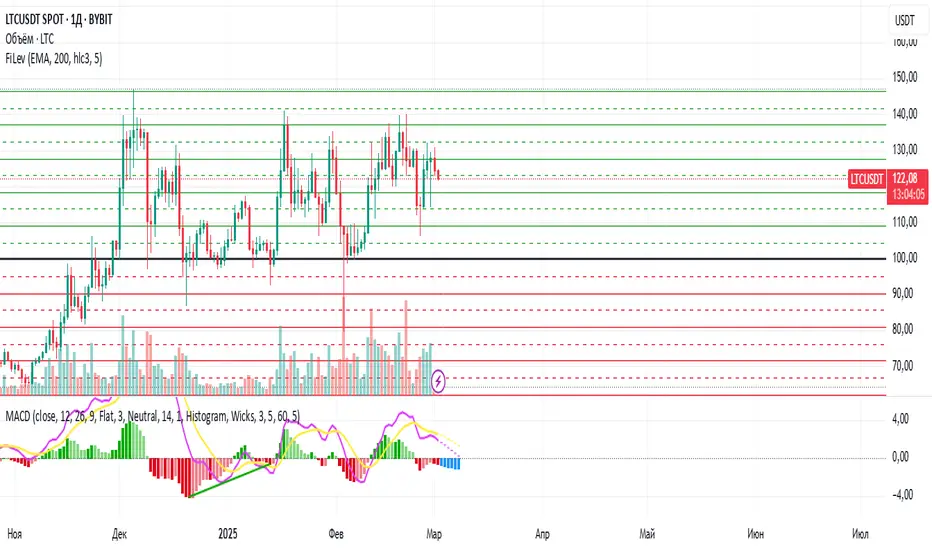
Fibonacci LevelsENGLISH
FiboLevels uses standard deviation (a measure of market volatility). For me, more successful parameters were EMA, 500 days, showing levels 50 and 100.
The standard RSI 14 indicator helps to determine the levels, you can use its values to navigate the levels if the price approaches any line, and the RSI is in the overbought or oversold zone, that is, there is a high probability that the price may rebound from this level.
If the script does not display levels, then you need to reduce the length parameter
If the price has gone beyond the lines, then the number of levels can be increased in the Number of Lines Show parameter
Russian
В FiboLevels используется стандартное отклонение (величина измерения волатильности рынка). Для меня более удачными параметрами вышли EMA, 500 дней , показ уровней 50 и 100.
Определять уровни помогает стандартный индикатор RSI 14, по его значениям можно ориентироваться в уровнях, если цена подходит к какой-либо линии, а RSI находится в зоне перекупленности или перепроданности, то есть большая вероятность что от этого уровня цена может оттолкнуться.
Если скрипт не отображает уровней, то нужно уменьшить параметр длина
Если цена вышла за пределы линий, то количество уровней можно увеличить в параметре Number of Lines Show
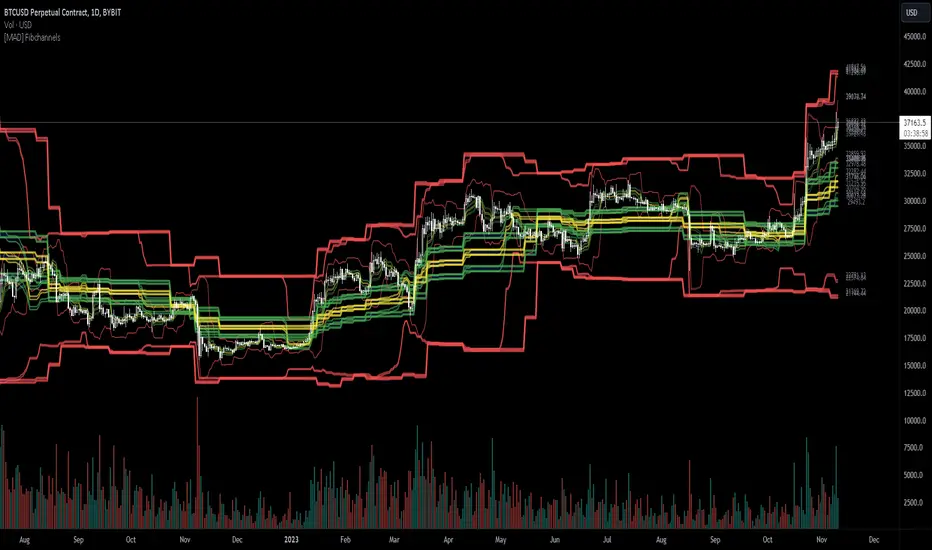
[MAD] FibchannelsThis is an indicator that gives you bands around the Fibonacci levels High/Low of the asset.
There are 3 time frames available so you can use the hourly, daily and weekly at the same time.
You can change the bands via selectable inputs to suit your own preferences.
you can as example combine with RSI or MACD to find a entry
Auto Fibonacci From Previous High & Low w/ Percentages & AlertsAUTO FIBONACCI FROM PREVIOUS D/W/M/Q/Y HIGH & LOW WITH PERCENTAGES & ALERTS
This is an auto fibonacci level generating indicator that uses the high and low from the previous day, week, month, quarter or year. It also has a table with real time updates of how far away the nearest fibonacci levels are above and below the current price, represented in percentages. It includes alerts for each level as well if you want to be notified of price crossing fibonacci levels without watching the chart.
***HOW TO USE***
Fibonacci levels are also known as the golden ratio and are popular levels for traders to use as support and resistance levels. Expect price to bounce off of these levels regularly.
The previous high and low are marked as white lines. These are very important levels so make sure to pay attention when price reaches these lines.
Make sure to check out the higher timeframes for major levels.
Each fibonacci line retracement and extension up to the 3.272 level in each direction is displayed as red or green depending on whether price is above or below that level.
The retracement levels used are: previous high, .117, .236, .382, .5, .618, .786, .883, previous low, 1.272, 1.618, 2, 2.272, 2.618, 3 and 3.272.
The extension levels used are: .272, .618, 1, 1.272, 1.618, 2, 2.272, 2.618, 3 and 3.272.
In the indicator settings input tab you can quickly change the timeframe used, turn lines on/off, upper line colors, lower line colors, previous high and low line colors, line width, turn percentage table on/off, change the color of the percentage table and move the percentage table to a different location on the chart.
The indicator includes alerts for each fibonacci level as well, just set your fibonacci timeframe on your favorite ticker and turn on tradingview alerts for alert() calls.
***MARKETS***
This indicator can be used as a signal on all markets, including stocks, crypto, futures and forex.
***TIMEFRAMES***
This auto fibonacci indicator can be used on all timeframes.
***TIPS***
Try using numerous indicators of ours on your chart so you can instantly see the bullish or bearish trend of multiple indicators in real time without having to analyze the data. Some of our favorites are our Buy & Sell Pressure Colored Candles, Directional Movement Index + Fisher Transform, Volume Profile W/ Buy & Sell Pressure Labels, Auto Support And Resistance and Money Flow Index in combination with this Auto Fibonacci. They all have real time Bullish and Bearish labels or percentage gap info as well so you can immediately understand each indicator's trend and how far away major levels are in percentages.

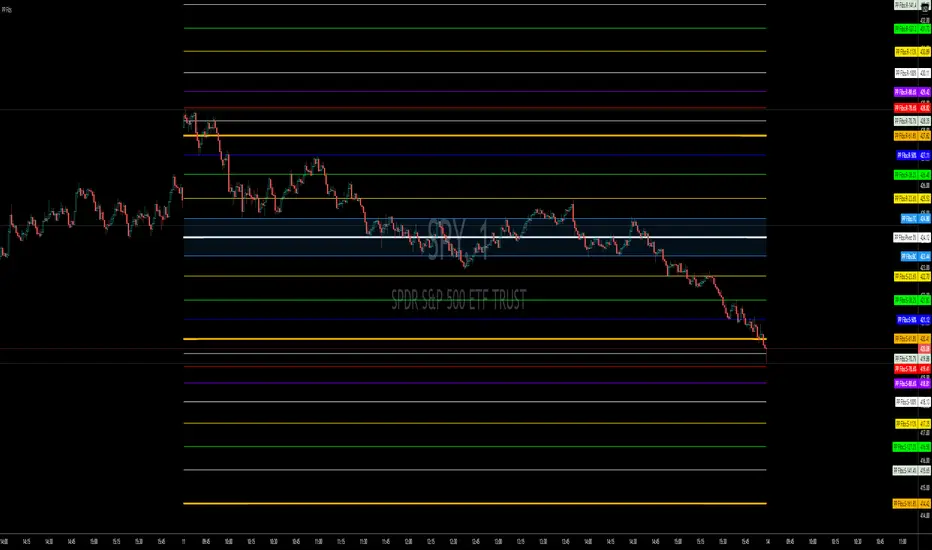
TWS Pivot Points FibsPivot Points with Fibonacci
Day, Week, Month. Year Time Frames
0% to 200%
What is a Pivot Point?
A pivot point is a technical analysis indicator, or calculations, used to determine the overall trend of the market over different time frames. The pivot point itself is simply the average of the high, low and closing prices from the previous trading day. On the subsequent day, trading above the pivot point is thought to indicate ongoing bullish sentiment, while trading below the pivot point indicates bearish sentiment.
The pivot point is the basis for the indicator, but it also includes other support and resistance levels that are projected based on the pivot point calculation. All these levels help traders see where the price could experience support or resistance. Similarly, if the price moves through these levels it lets the trader know the price is trending in that direction.
When the price of an asset is trading above the pivot point , it indicates the day is bullish or positive.
When the price of an asset is trading below the pivot point , it indicates the day is bearish or negative.
The indicator typically includes four additional levels: S1, S2, R1, and R2. These stand for support one and two, and resistance one and two.
Support and resistance one and two may cause reversals, but they may also be used to confirm the trend. For example, if the price is falling and moves below S1, it helps confirm the downtrend and indicate a possible continuation to S2.
All levels are based on Fibonacci
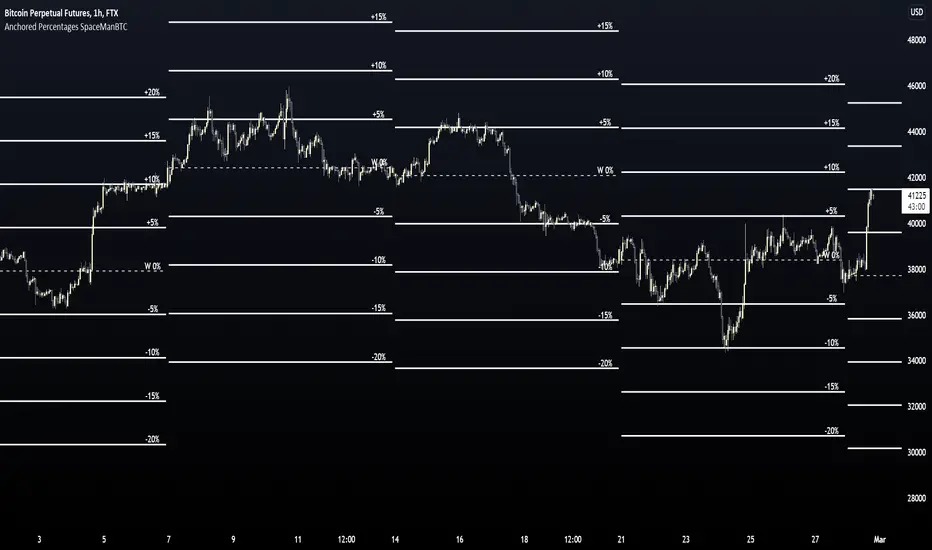
Anchored Percentages SpaceManBTCAnchored Percentages SpaceManBTC
This indicator is a successor to Percentage Values SpaceManBTC.
As opposed to anchoring via user selection on chart,
the user can choose common anchor points related to typical important Price Action levels such as: Daily, Weekly, Monthly.
And choose point of interest such as the Open for weekly open, or high,low, close...
The code is quite simple, specify a point in origin, and apply percentage deviations on price from that point,
For usecase I find it can be quite useful for round numbers personally which is why ive set the default to be: 5,10,15,20.
Similar to playing round values that may provide some psychological reason for resistance/support I beleive the same can be done with %, allowing for Dynamic Targets and S/R Based on average moves vs what is potentially over extended.
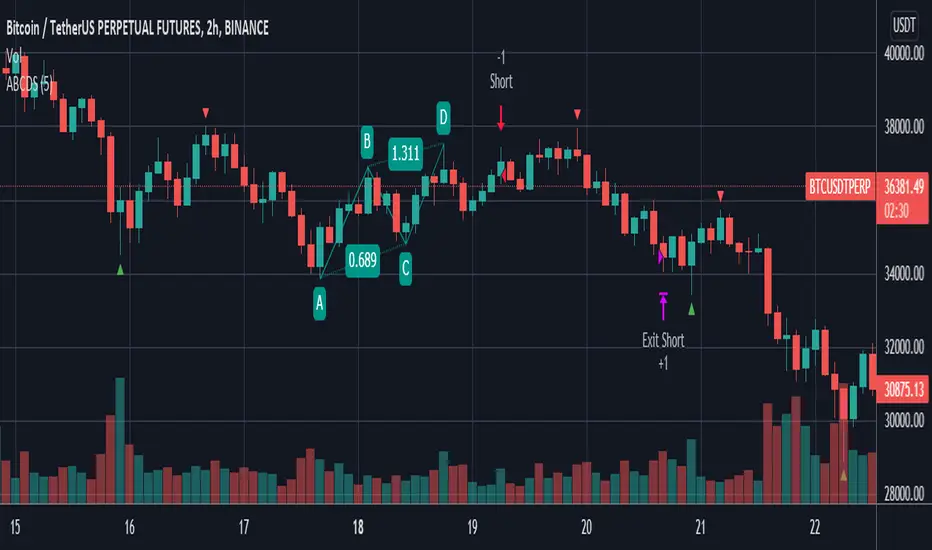
ABCD StrategyOne from many harmonic pattern that consists of two equivalent price legs. The ABCD pattern that helps traders predict when the price is about to change direction.
Tracing And Calculation
This code using pivot high and pivot low built-in method and calculate with Fibonacci Retracement.
Limitation
To find ABCD pattern is very difficult, just coming up a few from thousand candle. That why this code using little bit tolerance ratio to get more pattern.
Litt Auto FibThe Litt Auto Fib Tool automatically draws Fibonacci Retracements & Fibonacci Extensions based on time periods. The time period has two important settings.
1. The Fib Period is the period in which the Fib Tool determines a High and Low.
2. Use Previous Fib overlays the past periods Fib Levels on the current period.
For example, if we are using Daily period (D), then the Litt Auto Fib will calculate that Time periods High and Low. After determining the High and Low the tool will plot retracement levels and extension levels based off that Time periods High and Low. If we have the Use Previous Fib Unchecked it will use the current Day. If we have the Use Previous Fib checked (Or set to True), the Fib tool will use the previous day and overlay onto the current day. These levels can act as support and resistance, profit targets or stop losses. If you need more information on Fibonacci or how traders use it, it is best to do a quick Google search.

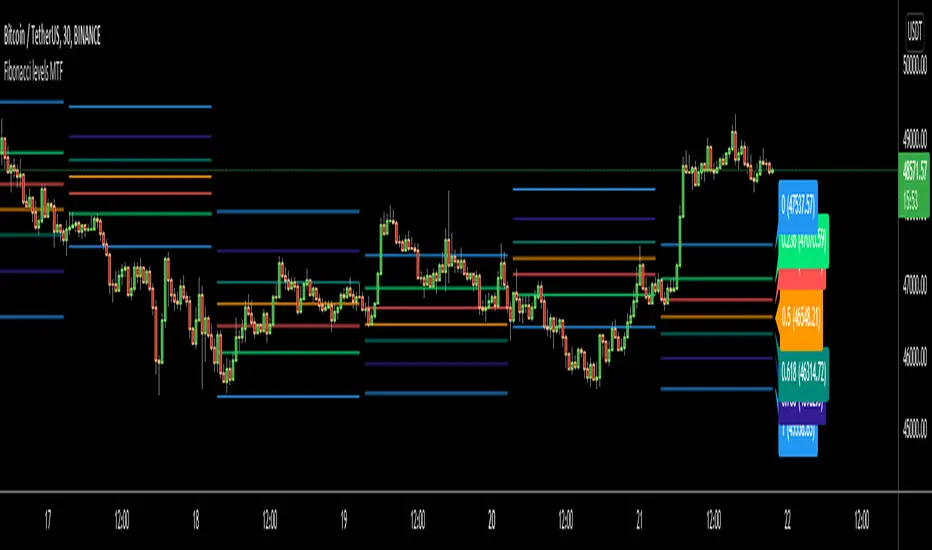
Fibonacci levels MTFHello All,
I got some requests for a script that shows Fibonacci Levels of Higher Time Frame Candles. so I made/published this script. I hope it would be useful for you.
Options:
You can set Higher Time Frame, by default it's 1 Day.
Optionally it can use Current or Last Candle of higher time frame to calculate/show its Fibonacci Levels.
It can show higher time frame candles at the background optionally. You can change its colors.
You can enable/disable/change each Fibonacci levels and their colors.
You can enable/disable Fibonacci Labels that is shown at the right ride and see only Fibonacci lines/levels
example, Fibonacci levels with higher time frame candles:
P.S. if you have ideas to improve this script, drop a comment under the script please
Enjoy!
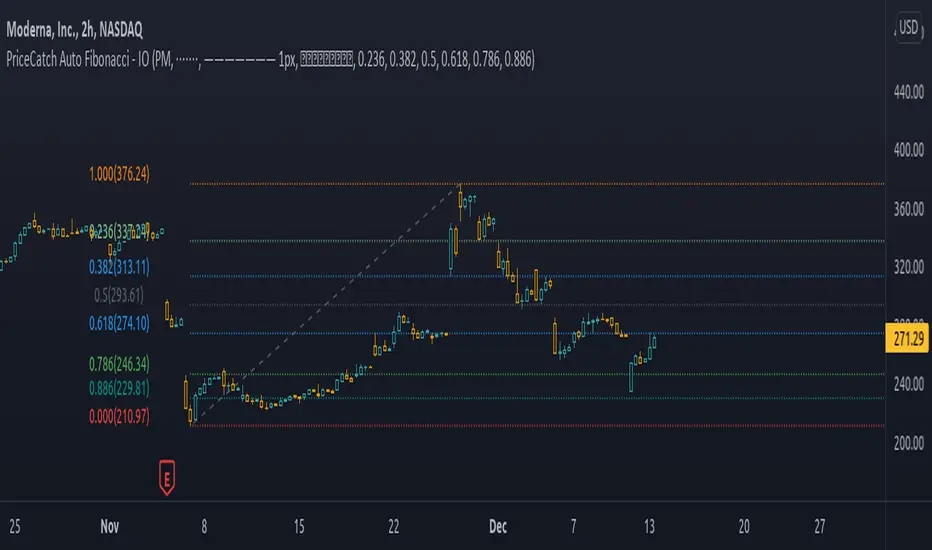
PriceCatch Auto Fibonacci - IOHello and Warm Greetings to Tradingview community.
PriceCatch Auto Fibonacci Levels
The Problem
One of the problems faced by traders who use Fibonacci levels is that they have to draw the levels manually on their charts. It's tedious and sometimes leads to inaccuracies in identifying correct levels.
Secondly, while there are so many Auto Fibonacci scripts available in the Public Scripts Library, most of them are not really useful as they are very limited in their capability for the following reasons:
either they are based on historical bars or historical pivots - user has to enter the number of historical bars or pivots for the starting point of the Fibonacci Levels.
they are time-frame dependent. This is a very serious limitation with most scripts.
they do not offer real and practical user settings.
many of them are not actually pure Fibonacci Levels scripts.
Limitations with other Auto Fibonacci scripts
Other Fibonacci scripts ask user to specify a number of historical bars or pivots to draw the Fibonacci levels. This is a major problem with such scripts - because 50 historical bars on the daily time frame changes to 50 historical bars on the 4H if you change the chart's time-frame to 4H, thereby altering the position of the Fibonacci levels. So, the desired view that the user seeks about price action is not what he/she gets whenever the time-frame changes. Similarly with specifying Pivots. For example, for a swing trader who specifies Pivots, the number of pivots that occur in one month varies depending on the chart's time-frame. So after trying these scripts, users quickly realize that they are not really all that useful.
PriceCatch Auto Fibonacci Levels - Unparalleled advantage
The PriceCatch Auto Fibonacci Levels script that I am publishing is completely different from other Fibonacci scripts on the TradingView Public Library. My script offers users unparalleled flexibility and options to use it effectively and to suit their trading style. With PriceCatch Auto Fibonacci Levels script, user has the ability to choose a variety of options to draw the Fibonacci levels from Current Day, Previous Day all the way up to 52 weeks. Not only that, users can also set their own levels via input options and that makes it even more adaptive to a user's specific needs. So, if you do not want 0.382 level and want the level to be at 0.312, yes, you can do that with this script.
Time-frame independence
This script works independent of the chart time frame and this is it's USP. So, while your chart may be set to 15 minutes time-frame, you can set the script to draw Fibonacci levels of Previous Week, last 3 days or any other available interval of your choice and it will draw it accurately. What's more, you can change your chart's time-frame to any interval of your choice and the Fibonnacci levels stay fixed and true to the chosen option. To my knowledge, none of the other scripts offer such a feature as they are dependent on the Chart's time frame.
The Difference
With the PriceCatch Auto Fibonacci Levels script, when user chooses Previous Month to draw Fibonacci levels, it only considers the high and low of previous month and this can never change. This makes it time-frame independent and actually helpful to the user because while the Fibonacci levels are drawn based on the chosen interval's high and low, user can then choose any chart time frame to trade on the drawn Fibonacci levels. This is the crucial difference and big advantage of PriceCatch Auto Fibonacci Levels script from other scripts.
Chart type independence
PriceCatch Auto Fibonacci Levels script is also independent of chart type. You can set your chart to Bars, Japanese, Hollow, Heikin-Ashi or even line style and this script accurately draws the Fibonacci levels as the logic is independent of chart type.
Practical and really useful
I have written the script after careful study of all the other available scripts and only then took on this project. Once you look at other scripts and what they lack, you will realize my script is all-rounded, very flexible with a wide variety of options to choose from. All of these features make PriceCatch Auto Fibonacci Levels script unique, very powerful and highly useful to traders.
Use Cases
Intraday
If you trade intraday, setting the interval to 3D (3 days) will give you Fibonacci levels of last three days. This may be useful in taking intraday trades by knowing probable support and resistance levels in that period. Then, you can trade on 1 minute, 3 minutes, 5 or any other intraday time frame of your choice.
Swing / Long term trading
For swing or long term traders, setting the interval to PM (previous month) or CQ (current quarter) will help you find probable support / resistance levels in that period that you can use to plan your trades. Then, of course, with the 52W setting, you can take a really long term view of the asset.
Multiple Advantage
Since you can add the script more than once to your chart, you can set one script to a longer time frame and another to a shorter one to form a combination of Fibonacci levels to give you even more precise and desired information about price action and to help you plan/manage your trades.
Some Samples
Tesla with CQ (Current Quarter) setting
Microsoft with CM (Current Month) setting
NVAX Bar Chart in 2H with PM (Previous Month) setting
NOTE - PRIOR TO USING THIS SCRIPT:
Please remember that the script is shared with absolutely no assurances about usability and any warranties whatsoever and as a responsible trader, please satisfy yourselves thoroughly and use it only if you are satisfied it works for you. Remember, you are 100% responsible for your actions. If you understand and accept that, you may use the script.
Why Invite only?
I merely want to know how many traders actually show interest to use it.
QUERIES/FEEDBACK
Please PM me.
I have to thank @BJORGUM for helping me out with this script.
Hope you find this script useful. Wish everyone all the best with trading.
B-auto fibA new interactive input mode for price and time inputs is now available. Instead of selecting bar numers and/or time from input widgets, you can now select them by clicking on the chart.
The interactive mode is activated by using confirm = true in input.time() and input.price().
This is code for an Anchored fibonachi indicator where the anchor point is set interactively
this way you can change start date and fib level is calculating automaticly indicator is finding highest and lowest price and calculating fib levels
thanks to versiyon5
i hope tradingview will make a fibo widget like Anchored VWAP it will be very usefull
thanks good works so far :)

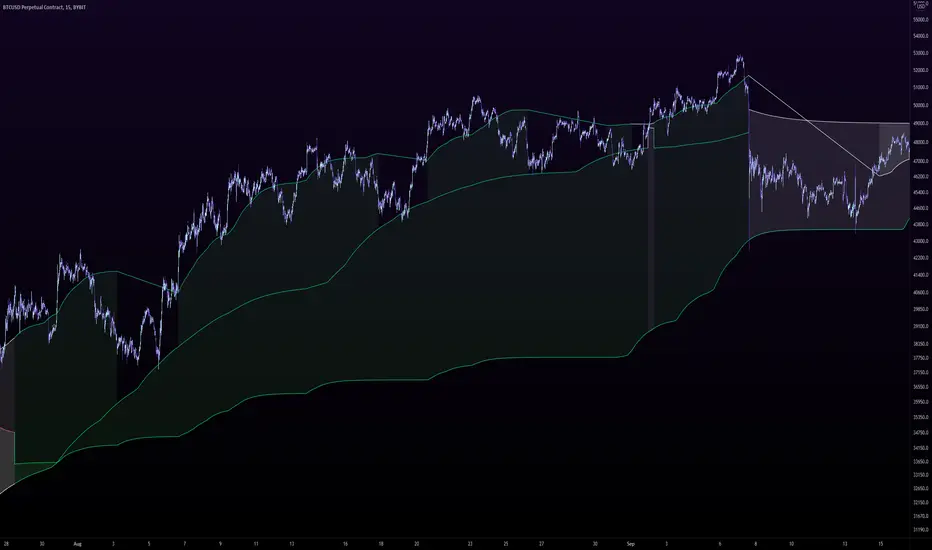
+ Donchian ChannelsThis version of Donchian Channels uses two source options so that one can create a channel using highs and lows rather than one or the other or closes. My thinking was that this would create a more accurate portrayal of price action (or at least contain the greatest scope of it) as seen through the lens of a Donchian Channel. This was actually part of the genesis of my idea around my Ultimate Moving Average.
Besides the single top and bottom plot for the DC's extremities, I've enabled the ability to create outer bands with a variable width that the user can adjust to their preference. I think it's quite nice. I use it in the DC in my other non-overlay indicators.
Besides this additional functionality, the indicator has options to plot lines between the basis and the upper and lower bands, so, basically, splitting the upper and lower channel in half.
There is no magic number to the lookback. I chose 233 as default because it's a fibonacci sequence number and I'm more interested in using the DC like a very long period bias indicator, and the longer lookback gives a much wider window (because highs and lows are so spread apart) with which other faster indicators (supertrend, shorter period moving averages, etc.) can work without making the screen a clutter.
The color of the basis may also be made relevant to higher timeframe information. What I mean by this is that you can set it so that the basis of the current timeframe is colored based on the candle close of the higher timeframe of your choosing. If you're looking at an hourly chart, and you set the color to Daily, the basis will be colored based on the candle close (above or below the basis) of the previous day. If the previous daily close was above the basis, that positive color will be reflected in the basis, even if the current hourly candle closes are below the hourly basis. This could potentially be useful for setting a higher timeframe directional bias and reacting off price crossing the lower timeframe basis (or whatever your trigger for entering a trade might be). This is also optional in my Ultimate Moving Average indicator.
You can also set the entire indicator to whatever time frame you want if you want to see where the actual basis, or other levels are on that higher timeframe.
Further additions include fibonacci retracement levels. These are calculated off the high and the low of the Donchian Channels themselves.
You will see that there are only three retracement levels (.786, .705, .382), one of which is not a fib level, but what some people call the 'OTE,' or optimal trade entry. If you want more info on the OTE just web search it. So, why no .618 or .236? Reason being that the .618 overlaps the .382, and the .236 is extremely close to the .786. This sounds confusing, but the retracement levels I'm using are derived from the high and low, so it was unnecessary to have all five levels from each. I could have just calculated from the high, or just from the low, and used all the levels, but I chose to just calculate three levels from the high and three from the low because that gives a sort of mirror image balance, and that appeals to me, and the utility of the indicator is the same.
The plot lines are all colored, and I've filled certain zones between them. There is a center zone filled between both .382 levels, and an upper and lower zone filled between the .786 and either the high or the low.
If you like the colored zones, but don't like the plots because they cause screen compression, turn off the plots under the "style" tab.
There are alerts for candle closes across every line.
I should state that, regarding the fibs, obviously the length of the Channels is going to affect to what levels price retraces to. A shorter lookback means you will see more changes in highs and lows, and therefore retraces are often going to be full retraces within the bands unless price is trending hard. A longer lookback means you will see smaller retraces. Using this in conjunction with key high timeframe levels and/or a moving average can give great confidence in a trade entry. Additionally, if you have a short bias it may help in finding levels or entering a trade on a pullback. It could also be good for trade targets. But again, the lookback you choose for this indicator is going to dictate its use in the system you're building or already have. A 9 EMA and a 200 EMA, while fundamentally the same, are going to be used somewhat differently while doing your chart analysis.
Additional images below.
Same image as main, but with supertrend and my +UMA to help with chart analysis.
Image with the fib stuff turned on.
Zoomed out image with the same.
Shorter lookback period.
Zoomed in image of shorter lookback.

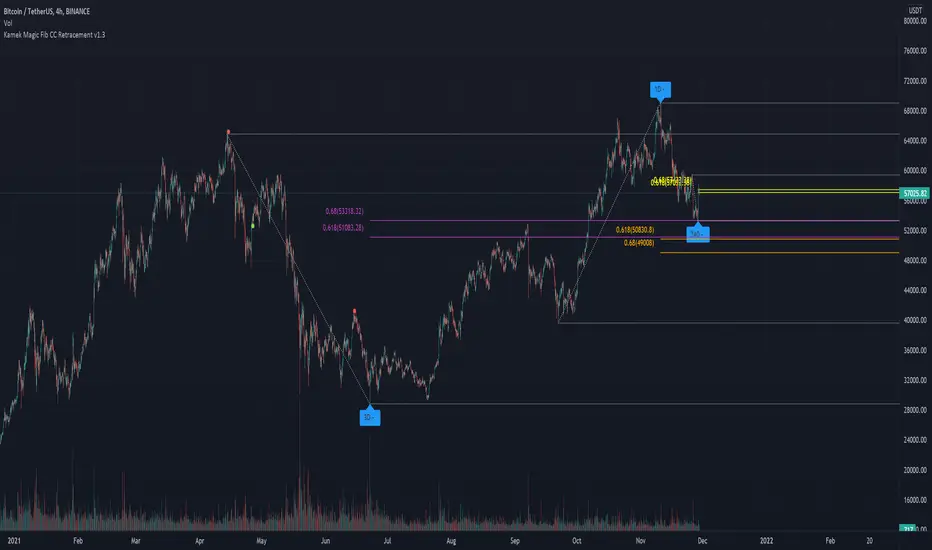
Kamek CC Magic v1.2This indicator has been created to automatically find the sweet spot for two fib levels. 0.618 & 0.66
- Using 3 Time Frame pivot points for fibs
- Each Time Frame pivot has fib retracement levels with customizable levels
- dynamic pivot left and right lookback period to adjust the lag in the higher highs and lower lows
Note: You need to have the chart time frame on the lowest fib time frame.
Recommended to use for scalping
0.618 & 0.66 for each Time frame.
1hr, 4hr, 1day
Recommended to use for Swing
0.618 & 0.68 for each Time frame.
4hr, 1day, 3day
but you can still use your own strategy using 4 fib levels.
The idea is based on the course material from Chart Champions
Its recommended using S&R levels or session volume to confirm entry or exit
Martyv Technical Analysis KitThis indicator is being developed as a tool hopefully suited to both the beginner/amateur/hobbyist and possibly also the professional analyst/trader. The idea is that it would be a tool that can give you an instant ‘overview’ of a few different schools of measurement on any measurable asset. Makes for great training wheels or a primer for further analysis.
Out of the box settings will give you an AutoFib for the most recent low and high (with extension targets), a pair of commonly-used moving averages (50 SMA and 200 SMA), RSI (and/or many other) divergences on the chart, and candles colored according to current trend (Blue = Bullish Control, Purple = Neutral/Coasting, Red = Bearish Control) and intensity according to volume (Darker = High Volume/Increasing, Lighter = Low Volume/Decreasing). For more advanced traders/analysts, almost all settings can be customized, with multiple options and additional features.
*There are a lot of settings. Shrug. Wink. I tried to bundle them together, however there are a few that I use quite often and placed them at the top for easy access. If you have any suggestions as to what's super useful in the top area, lmk. Happy trading! -E
AutoFib
-Places an AutoFib for the most recent low and high (with extension targets)
-You can choose to "contain price action" inside a 0-1 fib retrace, or allow extension targets to automatically be used (potentially useful within Harmonic Trading among other things)
-Uses the Fast/Medium/Slow (Default) global inputs for fib lookback period (Defaults to 8/21/34 at the time of this writing, can be changed in settings)
-Customizable fib levels, colors, and styles
-Can choose between AutoFib with manually defined levels or SmartFib with levels automatically calculated, including extensions as needed
--Choose between only using the most recent confirmed fib retrace, or the currently developing (non-confirmed) fib retrace - this will also contain price action within a 0-1 fib
--Adds fib extensions as needed, you can define extension levels
-Can change the lookback period and turn the visible Zig Zag and/or AutoFib on/off
-Can turn Logarithmic on/off in settings
Divergence
-Can identify and mark divergences (regular and hidden) for MACD, MACD Histogram, RSI (Default), Stochastic (Default), CCI, Momentum, OBV, Diosc, VWmacd, and Chaikin Money Flow
-Can turn divergences on/off individually
-Can choose to show hidden divergence
-Uses the Fast/Medium/Slow global inputs (Defaults to 8/21/34 at the time of this writing, can be changed in settings)
Trend Channels
-Uses a Zig-Zag with a specified lookback period (can be changed in settings)
-Setting AutoFIb to a different lookback than Trend Channels yields interesting results imo
-Can turn channels on/off
-Can change the lookback period and turn the Zig Zag and/or Channels on/off
Trend Ribbon
-Uses the John F. Ehlers Supersmooth method on a specified lookback period (Default 14)
-Checks the current price action against the lookback period trend and if the Supersmooth signal aligns with the trend direction, it gives a strong signal (Bull/Bear). A continuation signal (Neutral) is given if these two don’t match, and often indicates trend continuation or trend reversal.
-Can turn supersmooth and/or matching bar repaint on/off
-Can choose between Bull/Bear/Neutral signals and only Bull/Bear signals
-Alerts available for Bullish or Bearish change
-Can choose current timeframe or any timeframe
Bar Repaint
-Candles colored according to current trend (Blue = Bullish Control, Purple = Neutral/Coasting, Red = Bearish Control) and intensity according to volume (Darker = High Volume/Increasing, Lighter = Low Volume/Decreasing). You can set candle color to reflect: Open/Close, Trend (Default), or an RSI Gradient. You can set candle intensity to reflect: Volume (Default), Momentum, RSI, or ADX.
Price Tag
-Price tag that sits neatly between the candles and the fib labels. You can turn this on or off.

Weekly Fibonacci MatrixThe weekly Fibonacci Matrix builds a matrix based on specific time and price criteria. It is paired with higher and lower timeframe matrices to identify key entry and exit points for day trades and intraweek swing trades.
This is part of a full suite of tools I have developed for matrix analysis and ORB breakouts.

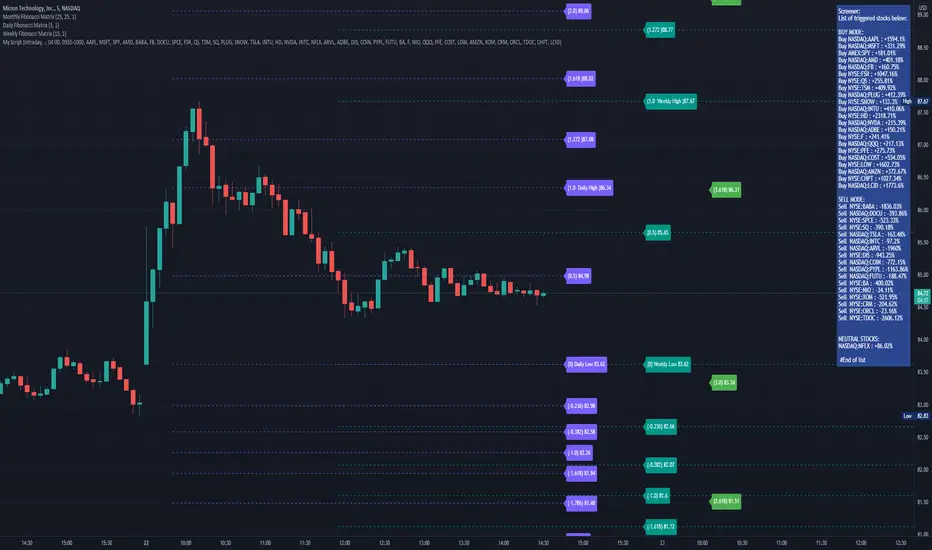
Fibonacci ORB scannerThe Fibonacci ORB scanner allows users to monitor Fibonacci Levels as defined by a user-defined time range.
The 0 Fibonacci and 1 Fibonacci will be defined by the lowest and highest price points during the defined time period.
The scanner can be set to intraday settings or any user-defined time-frame ("Delivery" settings).
A common way to use the scanner is to set it to the first 15 - 30 minutes of the day.
When prices are above the opening range set by the user, the ticker will enter the "Buy" column.
When prices are below the opening range set by the user, the ticker will enter the "Sell" column.
When prices are contained within the opening range set by the user, the ticker will enter the "Neutral" column.
The "Delivery" settings can be used to define an opening range that exceeds standard ORB levels.
One way to use the Delivery settings is to set them to first week of the month.
The scanner will then show "buy" for any ticker that is above the first week's high, and show "sell" for any stock that is below the first week's low.
The scanner is meant to be used in conjunction with my Fibonacci Matrix system, which gives users pre-defined fibonacci levels for each day, week, month, and quarter, each designed for a different type of trader.
You can DM me for access to my full suite of Fibonacci Matrix indicators.
Percentage Values SpaceManBTCPercentage Values SpaceManBTC
This is a free release indicator, it makes use of tradingviews new update to pinescript.
The goal of this script is to allow the user to choose a point in time on the chart and price.
In doing so it will generate automatically the percentage deviations specified by the user in the settings.
The code is quite simple, specify a point in origin, and apply percentage deviations on price from that point,
For usecase I find it can be quite useful for round numbers personally which is why ive set the default to be: 5,10,15,20.
Similar to playing round values that may provide some psychological reason for resistance/support I beleive the same can be done with % from important swing highs and lows in the correct trading environments.
Users can:
-Show Origin
-Choose distance from origin
-Toggle Labels altogether
-Choose color of lines
-Decide to show above, below, or both. For retracements and extensions.
-Customize the % Amount
To Do
-Customize line styles
-Customize line size
-Customize Font size
-Add more options for number of percentages

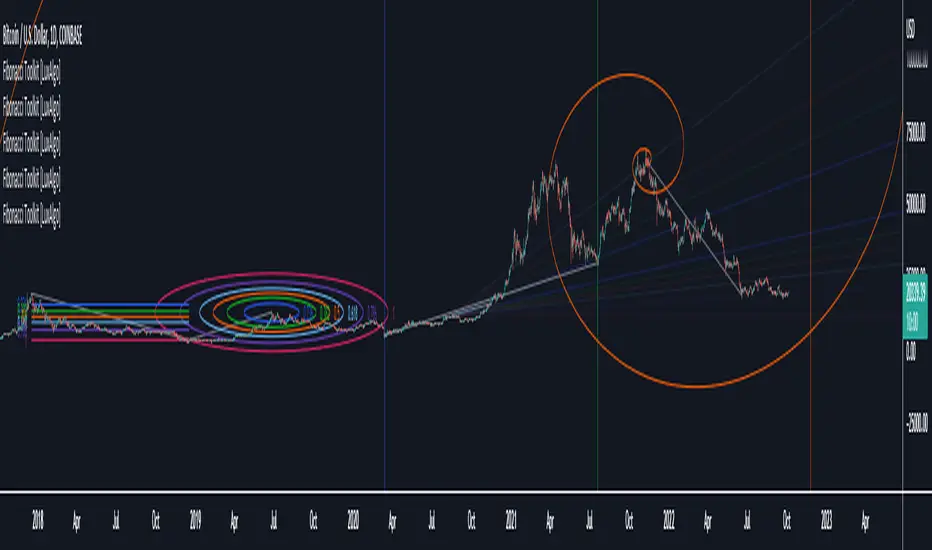
Fibonacci Toolkit [LuxAlgo]This toolkit aims to display multiple Fibonacci drawing tools including retracements, arcs, circles, fans, timezones and spirals.
Usage
Upon adding the indicator to the chart, users will be prompted to choose a starting point and an ending point for the calculation of the drawing tools.
Users can then navigate to the settings of the toolkit and choose which drawing tool to display using the Fibonacci drop-down menu. Users are also free to change the default Fibonacci ratios used by the indicator from within the settings. Each tool is described below.
Retracements
Fibonacci retracements display multiple levels constructed using the starting price point, ending price point, and multiple Fibonacci ratios. These levels can be used as support and resistance.
Arcs
Fibonacci arcs display multiple semi-circles. Each semi-circle crosses the line connecting the starting & end price point at a certain percentage determined by Fibonacci ratios. These arcs can be used as support and resistance.
Circles
The Fibonacci circles are similar to the Fibonacci arcs but display a full circle instead. Users can expect the price to bounce off of the circles.
This tool is less commonly used by traders.
Fan
A Fibonacci fan is a tool displaying trendlines all connected to a starting point and extending to a point determined by Fibonacci ratios. These can also be used as support and resistance.
Timezone
Fibonacci timezones return a series of horizontal lines. The distance of the lines increases by a factor given by the numbers in the Fibonacci sequence.
This tool can be useful to highlight points where a trend might reverse assuming that their duration increases over time.
Spiral
The Fibonnaci spiral displays a spiral that grows by a factor given by the golden ratio. This indicator returns a spiral using 7 turns (5 internal) and sets the origin of the spiral to the ending point which is selected by the user. The height of the spiral is based on the price range between the starting point and ending point.
Note that potential display artifacts can be seen when fitting the spiral on stocks and forex pairs.
Auto Fib Golden Pocket Band - Strategy with Buy Signalsthis strategy is based on the Indicator "Auto Fib Golden Pocket Band - "Autofib Moving Average"
it's the same as the indicator but with:
- the strategy tester included
- several entry Signal filter
- Dynamic SL

Auto Fib Golden Pocket Band - Autofib Moving Averageplots the fib retracement Golden pocket moving average band on two different pivots
3rd WaveHello All,
In Elliott Wave Theory, 3rd wave is not the shortest one in the waves 1/3/5 and it's usually longest one. so if we can catch it then we may get good opportunities to trade. This script finds 3rd wave experimentally. it can be also the 3rd waves in the waves 1, 3, 5, A and C. the 3rd wave should have greater volume than other waves, the script can check its volume and compare with the volumes of the waves 1 and 2 optionally.
Pine Team released Pine version 5! This script was developed in v5 and it uses Library feature of Pine v5 for the zigzag functions. This script is also an example for the Pine developers who learn Pine v5 and Libraries.
Options:
Zigzag Period: is the length that is used to calculate highest/lowest and the zigzag waves
Min/Max Retracements: is the retracement rates to check the wave 2 according to wave 1. for example; if min/max values are 0.500-0.618 then wave 2 must be minimum 0.500 of wave 1 and maximum 0.618 of wave 1.
Check Volume Support: is an option to compare the volumes of1. 2. and . waves. if you enable this option then the script checks their volume and 3rd wave volume must be greater then 1 and 2
there are 4 options for the targets. you can enable/disable and change their levels. targets are calculated using length of wave 1.
Options to show breakout zone, zigzag, wave 1 and 2.
and some options for the colors.
The Library that is used in this script:
P.S. This is an experimental work and can be improved. So do not hesitate to drop your comments under the script ;)
Enjoy!

ZigZag Chart with SupertrendHello All,
This script creates Zigzag Chart by using Zigzag waves, so it's timeless chart meaning that no time dependency on X-axis. Optionally it can calculate & show Zigzag Supertrend or Simple Moving Average. Also it can change bar colors of the main chart by trend direction of Zigzag Supertrend.
As seen below, each zigzag wave is a candle on Zigzag chart:
You have a few options and using these options you can find best settings for the securities/timeframes.
You can change Zigzag period, if you change Zigzag Period then all zigzag and the chart is recalculated/reconstructed.
You have option to show Zigzag Supertrend or Zigzag Moving Average, the options you have;
- You can change ATR Length and ATR multiplier for supertrend
- You can change Length for Simple Moving Average
You can change Zigzag candle & wick colors using options. Also you have option to change bar colors according to Zigzag Supertrend direction.
As it's timeless chart, below you can see how/when bar colors and Zigzag Supertrend change:
You can see Simple Moving Average of the Zigzag Candles:
You can play with ATR length and multiplier to find best supertrend:
You can play with the candle & wick colors:
Enjoy!

Vision Reversal ZonesVision Reversal Zones is our twist on Fibonacci Retracements to help identify areas of possible retracement. It's important to understand that in real-time the retracement levels of the past are not to be mistaken as retracement levels of the future. The goal is to provide yourself with an idea of general ranges you could potentially expect a retracement based on recent activity. This indicator should not be used as your only source of trade ideas... Build a strategy around your preferred setups, and leverage it for confirmation.
What makes this indicator different?
Our indicator outputs averaged metrics with retracement ratios
Our indicator adjusts it's averaging decisions automatically based on your chart
Our indicator focuses on the outer ratios of retracement
How do I use this indicator?
To use this indicator simply apply it to your chart. With this version there are no user required settings or adjustable values. The indicator will make adjustments itself based on your chart. To understand the use of the indicator you'll need to understand the basic principles of support & resistance. We recommend reading up on Fibonacci Retracements as well, however you'll first want to understand support & resistance.
