EsIstTurnt's Relative Value Comparison Multi SymbolCompare the relative valuation of up to 8 tickers. By taking a shorter term moving average and dividing by a longer term moving average(optionally with an offset) we get a value that is either above or below 1. Easy to tell what is undervalued and overvalued with this setup. Useful for comparing different asset classes or sector specific securities looking for outperformers/underperformers. Overvalued and Undervalued levels marked by Red and Green background. Recommended in conjunction with other indicators of your choosing for confirmation of trend changes but this is good for getting a broader view of the market you're interested in. Multiple timeframes, sources available however you should tinker with it to find what gives you the best view for your preferred timeframe.
Comparison

Relative StrengthRelative strength is a calculation of the price trend of a stock or a financial instrument in comparison to another instrument, stock, or industry. It shall be determined by taking the price of one commodity and dividing it by another.
Relative strength is a strategy used for determining value stocks and is used in momentum investing as well. It involves investing in stocks that have done well, in relation to their index or benchmark. For example, a relative strength investor might pick technology companies that have outperformed the Nasdaq Composite Index or large-cap stocks that are lagging against the S&P 500 index(Adjustable in the settings).
This indiator will give you a plot for relative strength between the current pair with another pair (adjustable in the settings), with a plotshape for RSNHBP & RSNH
Features :
1. Relative Strength
2. Double EMA of Relative Strength
3. RSNHBP & RSNH
How to use it :
1. Adjust All the settings parameter
2. For Alerting, Just use any alert function call, it will give you an alert of RSNHBP and RSNH

Stock Rotation Model [CC]This is an original indicator so a true hidden gem in my opinion. I based this idea off of the work by Giorgos Siligardos (Stocks and Commodities Aug 2012) with his indicator called the Sector Rotation Model. This indicator is best used as a trend confirmation in combination with another indicator such as a leading indicator. This will show you how strong the current stock you are looking at is compared to the S&P 500 which almost everyone uses as a relative strength comparison. Feel free to change the default lengths if you would like as these were just the settings that I liked the best overall. Let me know if you find any good combos that works for most stocks in general. I have included strong buy and sell signals in addition to normal ones so strong signals are darker in color and normal signals are lighter in color. Buy when the line turns green and sell when it turns red.
Let me know if there are any other indicators or scripts you would like to see me publish!

Swing ComparatorHere I bring you an array of methods to compare the swings and consistency between assets.
This indicator is excellent for swing traders and scalpers looking to maximize their profits by examining which of two closely related pairs provides greater price fluctuation during given period.
This indicator works against two assets, which are to be configured in settings.
This indicator has 5 particular plots for you to examine, each which can be considered for you to contemplate which pair for you to next perform a trade on.
First off, let's start with the blue.
The blue is simply a pearson correlation coefficient, thankfully now included in tradingview. This provides a value of 1 as values show to be close correlation, 0 showing no correlation, and -1 showing negative correlation - meaning an increase in one pair correlates to a decrease in another pair. This will turn green when greater than 0.975, showing a very strong relationship between the two pairs, and red when below -0.975. This is the only plot to be interpreted on a scale from -1 to +1.
Next, we have the purple and yellow background plots, followed by the white and green moving averages. Though similar, these are all slightly different.
For each of these 4 plots, a value greater than 0 indicates greater price swings for your Symbol #1, while a value less than 0 indicates greater price swings for Symbol #2.
These calculations are performed on a per bar basis, meaning you're likely going to be examining bars longer than what you'll normally be trading on. Use confluence, as well as your own judgement for this.
For example, if symbol #1 provides a bar with an open value 1% greater or less than close, providing a 1% swing on a given bar, but symbol #2 provides 2%, the indicator will fall down toward the negative, as Symbol #2 had the greater swing.
First, yellow focuses on only open/close bar values, and thus the body of the candlestick.
Purple, on the other hand, focuses on the wicks of the candle - thus, the high/low values. I've opted to make these two different values as a wick focuses on the embodiment within the time period, and body focuses on the open/close instant.
Next, the green is an extended EMA of the purple - High/Low ratio. This is important to examine trend overtime, and reduce unneeded noise.
Lastly, the white is simply difference in the standard deviation of the particular bars, between the two symbols you have selected. The tends to usually tie up with the green pretty well.
Considering this is going to by nature be very noisy datasets, I have included in settings the option to extend an EMA for everything. They have their default settings, but if you'd like to examine the trend without an EMA, feel free to set it to 1 to eliminate its effects.
I have additionally added the ability to introduce clipping, as well as scale the correlation coefficient to remain visible when examining very short term time scales. In the future, I hope to properly normalize all plots to remain within a -1 to +1 basis. Please be patient as I have multiple projects ongoing.
Suggestions and constructive criticism are very well encouraged.
Anyone is welcome to utilize this in their code, as well, i just ask you provide credit.
As you reduce to time frames less than a day, you will likely have to reduce the coefficient min/max closer to 0.025, or just hide it entirely.
TODO:
Make it look better. Sorry, folks.
Introduce latency between pairs.
Examine significance of a coefficient of determination
Remove static weights and introduce z-score and linear normalization.
Consider adding room for a 3rd pair. This could get ugly, however.

ROC vs BTCThis is a modification of my Rate of Change Percentile script, used to compare the current ticker (e.g. Altcoins) to BTC.
Essentially we are looking at (Current Ticker ROC percentile) vs (Bitcoin ROC percentile).
In other words, we are using the ROC value of both the current ticker and BTC, and ranking each based on their previous ROC.
We compare the rankings to gauge the relative overperformance or underperformance of the current ticker vs BTC.
The blue line is BTC, the columns are the current ticker.
Green columns above the blue line indicate positive ROC and current ticker has higher ROC ranking than BTC.
Red columns below the blue line indicate negative ROC and current ticker has a higher ROC ranking than BTC.
*** PLEASE LEAVE A LIKE AND FOLLOW IF YOU ENJOY THE SCRIPT ***
Any questions, comments or feedback I'd love to hear from you below!

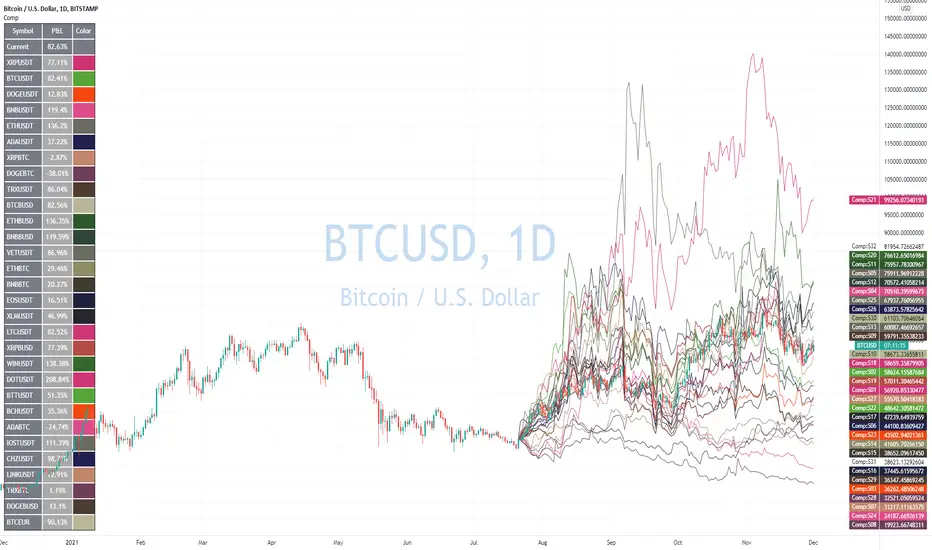
Advanced Comparison ToolWith the new Pine Script features you can build pretty interesting scripts.
Here is my try to expand functionality of basic comparison tool you have in TradingView.
When you apply it on your chart you can select a bar when do you want to start comparing your instrument from.
In parameters you can specify up to 32 symbols to compare. You can also disable symbols and change color for them as well.
As a result you'll see a table with summary and line for every instrument you selected as if it started from the close of the selected bar.
Disclaimer.
Please remember that past performance may not be indicative of future results.
Due to various factors, including changing market conditions, the strategy may no longer perform as well as in historical backtesting.
This post and the script don’t provide any financial advice
Volatility IndexThis indicator is based on Historical Volatility (HV) built-in indicator with minor tweaks to match the Bitcoin Volatility Index (from Bybt).
Also, you can select a symbol to compare its volatility with the volatility of the currently selected symbol.

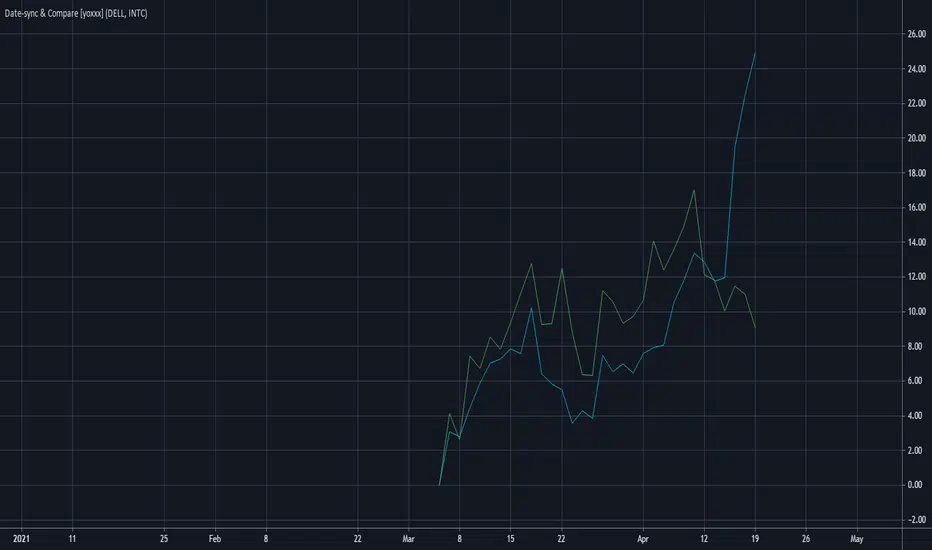
Date-selected Synch and Compare Script Module [yoxxx]This Script is a Convenience Script Module for calculations based or started on a fix time / date.
(In difference to bar_index-based where the reference point is shifting from bar to bar, thus is dynamic).
Purpose examples:
- Comparison by start date
- Time driven studies or strategies
- Measuring from Date of Interest
The script also contains a date input box with the feature of auto-converting the default time to local user time (a newer feature of Tradingview which too me a lot of research to find; so here integrated).
Last not least it the module gives you a ready to go example for multi security comparison on percentage scale with a free selectable start date.
Enjoy
Yoxxx
P.S:. For further notes look at the script code.
They are concerning usage and how avoiding some strange display issues.
Comparison (Malaysia Index & Sector)This is just a simple tool for convenient to compare and showing a clear image of all sector and index in Malaysia. They are just in one indicator. From this indicator, you can predict momentum of each sector in Malaysia, which is currently in bull or bear trend.
STRUCTURE
In the setting, the first line with the option of the following index (Malaysia Index) :
1. FBMKLCI
2. FTSEMYX:FBMSCAP
3. FTSEMYX:FBMACE
4. FTSEMYX:FBM70
5. FTSEMYX:FBMT100
6. FTSEMYX:FBMFLG
7. FTSEMYX:FBMEMAS
8. FTSEMYX:FA40
9. FTSEMYX:FBMMSCS
10. FTSEMYX:FBMAPMYR
11. FTSEMYX:FBMMSCAP
The rest of lines is all of the following sector (Malaysia Sector):
1. Technology
2. Telecommunication
3. Health
4. Consumer Product
5. Industrial Product
6. Construction
7. Property
8. Plantation
9. Utilities
10. Transportation
11. Energy
12. REIT
13. Finance
The last line (Line 15) is provided for other stock/index which is not available in option to manually fill.
All sector and index price are smoothen by Moving Average (MA). The default moving average is Relative Moving Average (RMA) which is used in Relative Strength Index ( RSI ) Oscillator. But the range is different from RSI , it is from -100 to 100 instead of 0 to 100. In the end, result and interpretation are just the same as RSI . Green area indicates oversold area, while red area is overbought.
Other choice of Moving Averages are available to change.
The problem of putting all together is the script may take longer to process. It is just for convenient use.
Bottom-Up or Top-Down Invest?

Performance ComparatorThis indicator allows to compare the performance (% change) of a given symbol with the larger market ( AMEX:SPY ) and/or with a custom symbol, which defaults to AMEX:XLK (an ETF tracking technology companies from the S&P 500).
The performance for the current symbol is displayed as a blue histogram, while performance for the AMEX:SPY and the custom symbol are respectively displayed as orange and white lines, making it easy to spot when the symbol outperformed the market.
Features:
Configurable time resolution (default: same as chart)
Comparison using change percentage or its EMA/WMA/SMA (default: EMA)
Configurable moving average length
Optionally hide AMEX:SPY or the custom symbol from the chart

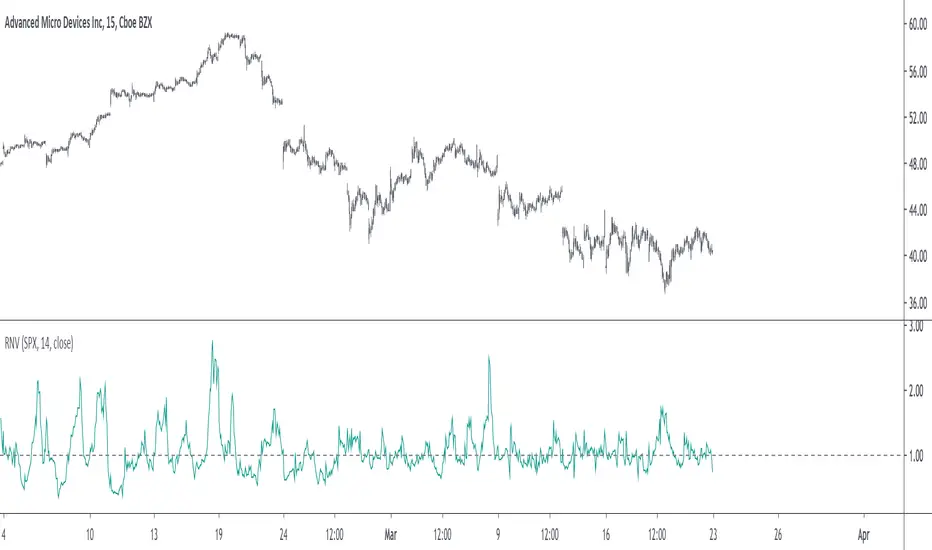
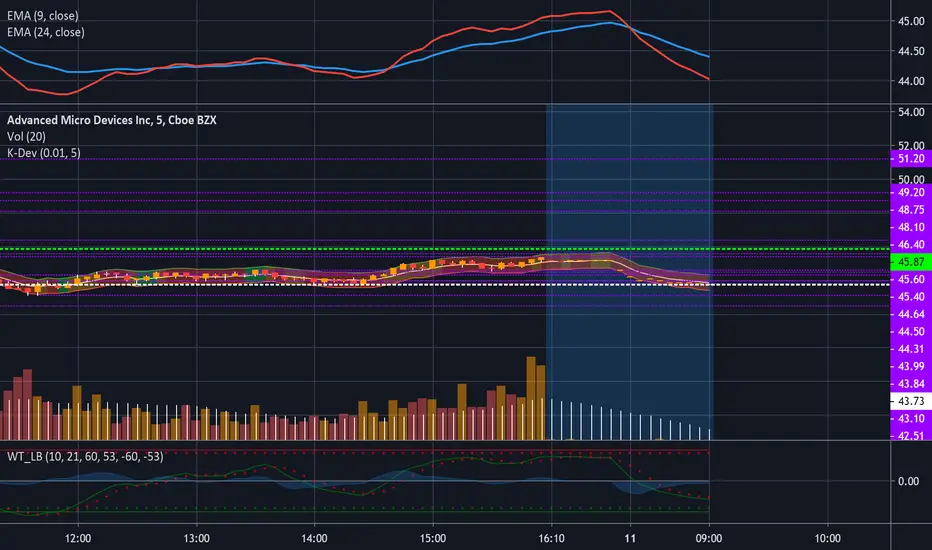
Relative Normalized VolatilityThere are plenty of indicators that aim to measure the volatility (degree of variation) in the price of an instrument, the most well known being the average true range and the rolling standard deviation. Volatility indicators form the key components of most bands and trailing stops indicators, but can also be used to normalize oscillators, they are therefore extremely versatile.
Today proposed indicator aim to compare the estimated volatility of two instruments in order to provide various informations to the user, especially about risk and profitability.
CALCULATION
The relative normalized volatility (RNV) indicator is the ratio between the moving average of the absolute normalized price changes value of two securities, that is:
SMA(|Δ(a)/σ(a)|)
―――――――――――
SMA(|Δ(b)/σ(b)|)
Where a and b are two different securities (note that notation "Δ(x)" refer to the 1st difference of x, and the "||" notation is used to indicate absolute value, for example "|x|" means absolute value of x) .
INTERPRETATION
The indicator aim tell us which security is more volatile between a and b , with a value of the indicator greater than 1 indicating that a is on average more volatile than b over the last length period, while a value lower than 1 indicating that the security b is more on average volatile than a .
The indicator use the current symbol as a , while the second security b must be defined in the setting window (by default the S&P500). Risk and profitability are closely related to volatility, as larger price variations could potentially mean larger losses (but also larger gains), therefore a value of the indicator greater than 1 can indicate that it could be more risked (and profitable) to trade security a .
RNV using AMD (top) volatility against Intel (bottom) volatility.
RNV using EURUSD (top) volatility against USDJPY (bottom) volatility.
Larger values of length will make the indicator fluctuate less often around 1. You can also plot the logarithm of the ratio instead in order to have the indicator centered around 0, it will also help make values originally below 1 have more importance in the scale.
POSSIBLE ERRORS
If you compare different types of markets the indicator might return NaN values, this is because one market might be closed, for example if you compare AMD against BTCUSD with the indicator you will get NaN values. If you really need to compare two markets then increase your time frame, else use an histogram or area plot in order to have a cleaner plot.
CONCLUSION
An original indicator comparing the volatility between two securities has been presented. The choice of posting a volatility indicator has been made by my twitter followers, so if you want to decide which type of indicator i should do next make sure to check my twitter to see if there are polls available (i should do one after every posted indicator).
KLemurs DeviationMarket: Stocks and ETF's
This overlay shows the deviation of the exponential moving average of the mid candle price of the currently loaded chart, away from the exponential moving average of the S&P and DOW combined and averaged mid candle price. The top and bottom lines also give a visual perspective of what a certain percentage (default 1%) looks like on the current charts window. This may help with making quick decisions for things like setting trailing stop trades with a percentage. This can be used for stocks, ETF's, and index's and It may be useful in finding potential stocks or ETF's if you are interested in these kinds of deviations. Defaults are set for a dark screen but can be edited to your taste. It's optimized to be an overlay on the current chart window as opposed to being a separate window.
Percentage Lines (editable)
This is three lines. The upper line (default green) plots the set percentage (default 1%) above the current chart’s ema. The middle line (default white) plots the current chart’s ema. The lower line (default red) plots the set percentage (default 1%) below the current chart’s ema.
Deviation Band (editable)
This is the colored band on the overlay between the upper and lower percentage lines. The band’s fill color indicates the deviation of the current charts ema from the ema of the combined S&P and DOW’s ema as follows:
- Red (default) = Current Chart’s ema is descending and the S&P/DOW ema is descending OR the Current Chart’s ema is below (underperforming) the S&P/DOW ema.
- Orange (default) = The Current Chart and S&P/DOW ema’s are both either ascending or descending together.
- Green (default) = The Current Chart’s ema is ascending but the S&P/DOW ema is descending.
To Set Line Colors
BY default, the upper line color uses the same colors as the ascending band color and the lower line uses the same color as the descending band color. To set the line colors, see "plotColor", "plotColorUp", or" plotColorDown" in variable settings within the script or use the “Central Plot Line”, “Upper Plot Line, or “Lower Plot Line” in the input dialogue to change this.
To Set Band Colors
To set the band colors, see "plotColor", "plotColorUp", or "plotColorDown" in variable settings within the script or use the “Color0”, “Color1", or “Color2” in the input dialogue to change this.
To Set EMA Lookback Period
The ema lookback period defaults to 5. This is the number of candles back that the script will use to determine the ema. See “CCemaN” in variable settings within the script or use the “EMA Period” in the input dialogue to change this.
To Set Percentage
To set the percentage that plots the upper and lower lines, see "CCP" in variable settings within the script or use “Upper/Lower Bands Percentage” in the input dialogue to change this. The default is .01 (or 1%).
Any Security vs. Any Security Change Comparison [BigBitsIO]This script allows you to compare the percentage-based change in the price of any two securities on any given (and supported) timeframe on the chart. This can give you a very simple way to compare any two securities against one another.
Ex: If your base security gained 5%, and the other security gained 3% in a single day, the change comparison would show a green bar of 2% because your base security outgained your other security by 2%.
Features:
- 2 securities to compare. A base and other.
- Shortlist of default securities to choose from.
- Ability to override the default securities list and use any security supported by TradingView. You must use the correct security string to do so.
- Resolution is tied to whatever the current chart is using. This way the view of the indicator always reflects the correct resolution of the chart.
- If either market has a 0% change, it is considered likely closed during that period and will result in a change of 0%, as they shouldn't be compared at that time.

Current vs. Average price performance (daily and weekly)This indicator is to be used only by the values it gives back, don't use the lines .
In "current week days" choose number of days that already BEGAN this week (ex. on Wednesday type 3)
Green1 - Current Daily Range
Orange1 - Average Daily Range
Green2 - Current Weekly Range
Red1 - Average Weekly Range
Orange2 - Today's price movement compared to the average daily price movement (in percentage)
Red2 - This week price movement compared to the average weekly price movement (in percentage)
By these values you can check how price performed today and this week in comparison to the average daily and weekly values - you can check with some probability if the movement is already exhausted or price can do some more action.

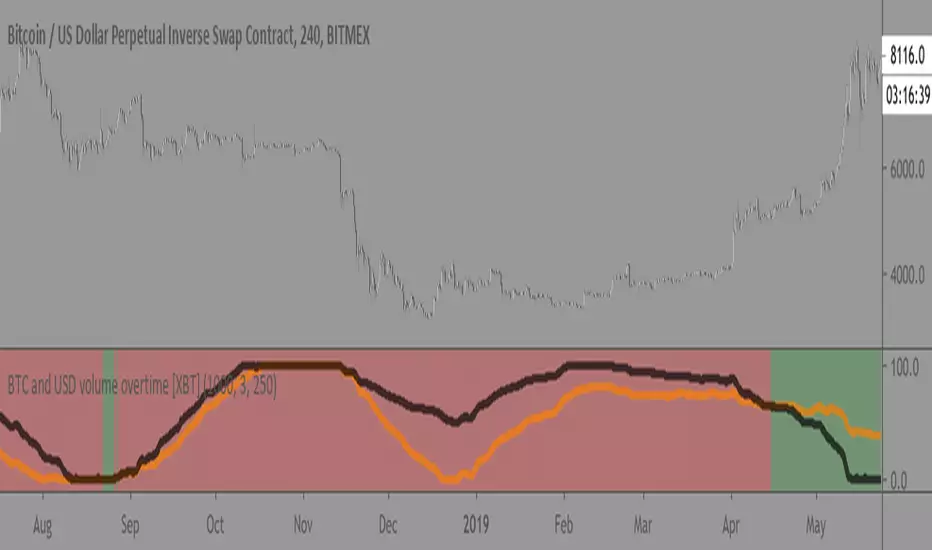
BTC and USD volume overtime [XBT]Compares BTC volume vs USD volume overtime
Best used on 4hr timeframe. Not really some crazy alpha but good overview/statistic to keep track of.
(make sure to use on XBTUSD pair since it isnt using security calls to call the data)
Enjoy!
Percentage Change Comparison [BVCC]This script allows you to input 2 different coins and plot % changes against each other.
Look Back is adjustable to account for different time frame windows. Default is 1, so each line will be graphed on a 1:1 ratio with the candle period selected on the chart. raising this number to 24 will plot the change across every 24 candles and so on. It's pretty interesting to move the input dialogue window out of the way and change this number, watching how the % gain comparisons change in real time.
Default coins to compare are set to BTCUSD and ETHUSD @ coinbase.

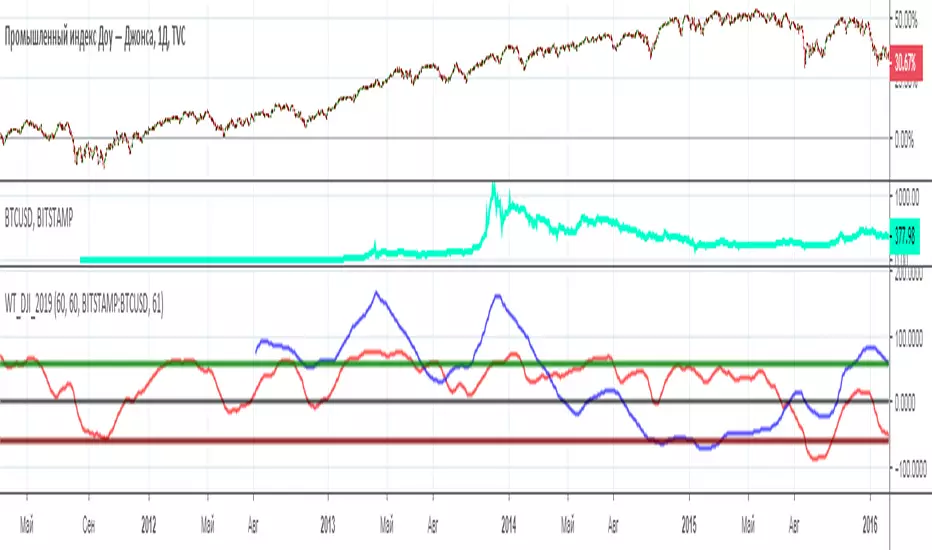
WT_BTC_Dow Jones_2019[wozdux]Comparison of two trading instruments using the indicator. Visual comparison often does not provide complete information. The scale and amplitude of the fluctuations of the two trading pairs are very different. Therefore, it is better to compare indicators from these pairs. I have used for this purpose, the speed indicator of price movement wt. The red line is the wt indicator from the trading instrument that is in the main window. The blue line is an indicator from the pair, which is written in the indicator settings. In addition, the calculation periods for each pair can be taken as the same or different. Often, trading pairs do not fluctuate synchronously, so it is necessary to select the periods of calculation of the wt indicator individually. In this example, Dow Jones and bitcoin were used.
-----------------------
Сравнение двух торговых инструментов с помощью индикатора. Визуальное сравнение часто не дает полной информации. Масштаб и амплитуда колебаний двух торговых пар бывают сильно различаются. Поэтому сравнивать лучше индикаторы от данных пар. Я использовала для этой цели индикатор скорости движения цены wt. Красная линия это индикатор wt от того торгового инструмента, который находится в главном окне. Синяя линия это индикатор от пары, которая прописывается в настройках индикатора. Кроме того, периоды вычислений для каждой пары можно брать как одинаковые, так и разные. Часто торговые пары колеблются не синхронно, поэтому стоит подбирать периоды вычислений индикатора WT индивидуально. В данном примере использовался Доу Джонс и биткоин.
Range: OHLC vs Previous OHLCThis will plot your choice of OHLC (or any of the averaging choices) of the current candle compared to the previous candle.
For example if you choose "high" for the input and set the chart to daily, you'll see the currently daily high vs the previous daily high.
Green candle represent a higher high and the length of the candle represents how much higher.
Red candles represent a lower high than the previous day and the length is by how much lower.
This indicator is pretty straight forward, look for me to build on this with something a little more elaborate in the near future.

Bestest MA. Compare 2 x 7 MA's at different resolutionAdjust time, length, visibility, colour.
SMA and EMA can use different time resolution.
This is version 1 aka work in progress.


FM RSI Vs StochEasy to use RSI and Stoch
Setting Menu has an option to toggle the RSI and Stoch ON and OFF for your own preference.
Great for reducing clutter when comparing oscillators, while giving the ease of use to just click the toggle option instead of having to find and reset your indicator settings.
Colour schemes adjustable in Settings Menu for personal taste.
Kendall Rank Correlation CoefficientKendall Rank Correlation Coefficient script.
This way to measure the ordinal association between two measured quantities described by Maurice Kendall (1938, Biometrika, 30 (1–2): 81–89, "A New Measure of Rank Correlation").
In this script I compare Kendall Coefficient and Pearson Coefficient (using built-in "correlation" function).

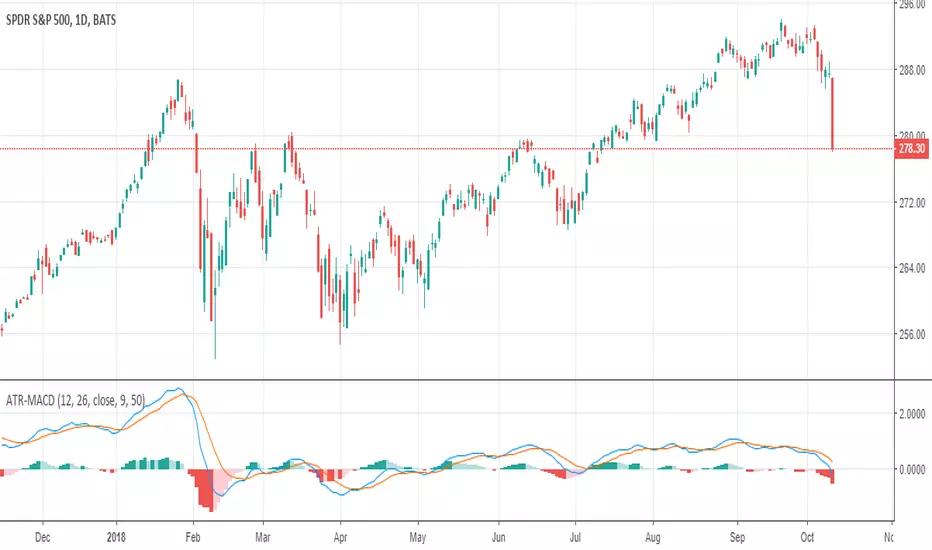
ATR adjusted MACDWhen running MACD, it can be useful to compare the value of the MA difference to other values. In other words, is a particular stock or futures contract at a more extreme MACD value than another. This can be done by dividing by the price, however, that doesn't adjust for volatility differences. Using ATR, one can adjust for price and volatility at the same time, allowing comparisons between securities more easily.