INVITE-ONLY SCRIPT
Fibonacci and Ema Trend + Pullback alerts
업데이트됨
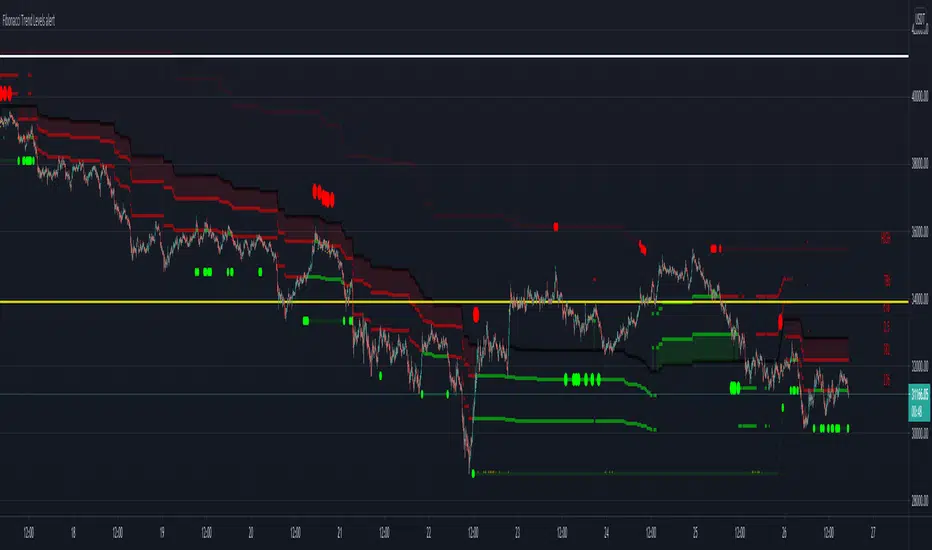
This indicator tells you what to do with supports and resistances based on fibonacci with signs and alarms
and Ema 200 with buy or sell fast pullback alarms
When 0.5 is bear the price will seek to break the lower supports
sell from 0.5 to bear zone and obtain profits below the supports
stop loss above resistence
When 0.5 is bull the price will seek to break the highest resistances
buy from 0.5 to bull zone and profit above the resistances
stop loss below support
you can edit the indicator to have slower or faster levels if you want

The alarms that the indicator has :
Resistence down
Resistence up
Bull zone UP
Buy 0.5 Bull
Sell 0.5 Bear
Bear zone DOWN
Bear zone UP sell to 5.0 bear
Bull zone DOWN Buy to 0.5 bull
Support zone DOWN
Support zone UP
ema 200 pullback alerts
when price is going up active the buy fast pullback alarm
stop loss below ema 200 or support
when price is going Down active the sell fast pullback alarm
stop loss above ema 200 or resistence


and Ema 200 with buy or sell fast pullback alarms
When 0.5 is bear the price will seek to break the lower supports
sell from 0.5 to bear zone and obtain profits below the supports
stop loss above resistence
When 0.5 is bull the price will seek to break the highest resistances
buy from 0.5 to bull zone and profit above the resistances
stop loss below support
you can edit the indicator to have slower or faster levels if you want
The alarms that the indicator has :
Resistence down
Resistence up
Bull zone UP
Buy 0.5 Bull
Sell 0.5 Bear
Bear zone DOWN
Bear zone UP sell to 5.0 bear
Bull zone DOWN Buy to 0.5 bull
Support zone DOWN
Support zone UP
ema 200 pullback alerts
when price is going up active the buy fast pullback alarm
stop loss below ema 200 or support
when price is going Down active the sell fast pullback alarm
stop loss above ema 200 or resistence
릴리즈 노트
fixed pullback circles릴리즈 노트
change the area of supports and resistances. change of colors, and the names of the signs easier to understand릴리즈 노트
alarms for cross up or down each levelremoved ema 200 with pullback alerts. will upload a new indicator for emas
초대 전용 스크립트
이 스크립트에 대한 접근은 작성자가 승인한 사용자로 제한되며, 일반적으로 지불이 필요합니다. 즐겨찾기에 추가할 수 있지만 권한을 요청하고 작성자에게 권한을 받은 후에만 사용할 수 있습니다. 자세한 내용은 ElPablo18에게 문의하거나 아래의 작성자의 지시사항을 따르십시오.
트레이딩뷰는 스크립트 작성자를 100% 신뢰하고 스크립트 작동 원리를 이해하지 않는 한 스크립트 비용을 지불하고 사용하는 것을 권장하지 않습니다. 대부분의 경우 커뮤니티 스크립트에서 무료로 좋은 오픈소스 대안을 찾을 수 있습니다.
작성자 지시 사항
″send me a telegram to have access
https://t.me/ElPabl0
차트에 이 스크립트를 사용하시겠습니까?
경고: 액세스를 요청하기 전에 읽어 보시기 바랍니다.
면책사항
이 정보와 게시물은 TradingView에서 제공하거나 보증하는 금융, 투자, 거래 또는 기타 유형의 조언이나 권고 사항을 의미하거나 구성하지 않습니다. 자세한 내용은 이용 약관을 참고하세요.