INVITE-ONLY SCRIPT
SPY Checker

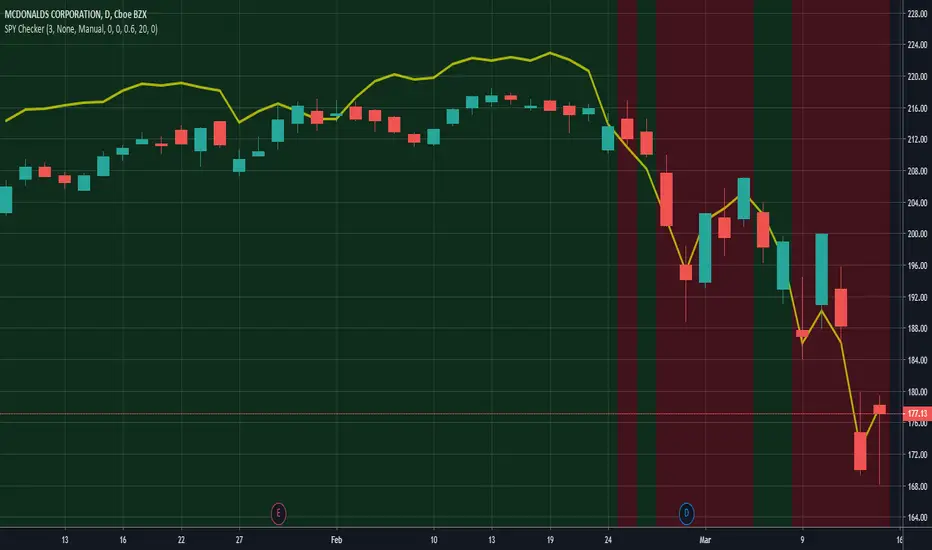
Using this indicator allows you to check the SPY for large gaps and candles (e.g. >1%) directly in your stock chart at first glance.
It is now also possible to use this indicator for all stock charts and to get the SPY indication on them visible without opening the SPY chart explicitly.
You are able to display the SPY trendline in the current chart as an overlay (yellow line) and configure the SPY trendline adjustment in the indicator settings. This will allow you to determine if the current stock chart is following the SPY or not. And you can also select a trading stop for several days in the indicator settings, which is visible through the green and red background color.
Hope this helps many of you to be more efficient in your SPY verification - have fun!
초대 전용 스크립트
이 스크립트는 작성자가 승인한 사용자만 접근할 수 있습니다. 사용하려면 요청 후 승인을 받아야 하며, 일반적으로 결제 후에 허가가 부여됩니다. 자세한 내용은 아래 작성자의 안내를 따르거나 ATS-TRADING에게 직접 문의하세요.
트레이딩뷰는 스크립트의 작동 방식을 충분히 이해하고 작성자를 완전히 신뢰하지 않는 이상, 해당 스크립트에 비용을 지불하거나 사용하는 것을 권장하지 않습니다. 커뮤니티 스크립트에서 무료 오픈소스 대안을 찾아보실 수도 있습니다.
작성자 지시 사항
면책사항
해당 정보와 게시물은 금융, 투자, 트레이딩 또는 기타 유형의 조언이나 권장 사항으로 간주되지 않으며, 트레이딩뷰에서 제공하거나 보증하는 것이 아닙니다. 자세한 내용은 이용 약관을 참조하세요.