INVITE-ONLY SCRIPT
RSI Levels
업데이트됨
RSI Levels
- The relative strength index ( RSI ) is a technical indicator used in the analysis of financial markets.
It is intended to chart the current and historical strength or weakness of a stock or market based on the closing prices of a recent trading period.
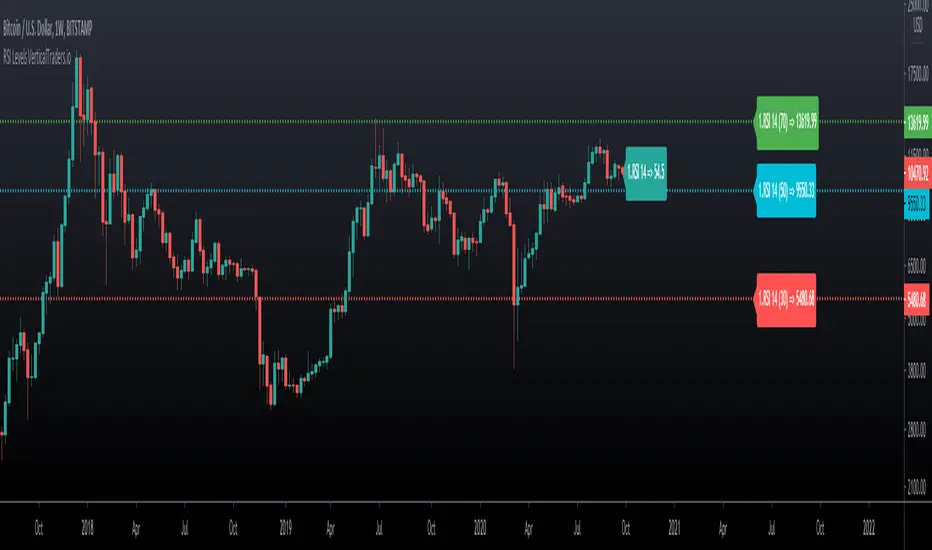
- This indicator allows us to visualize the levels of rsi in the chart, so that we can calculate take profit and stop points in a simple way,
knowing what position the price is currently in relation to these levels and how much space we have.
- We can also visualize the slope of the three levels of rsi , overbought, oversold and level 50, something that is not possible in the oscillator version.
- It allows you to display 2 rsi values at the same time.
- Allows to change the color of candlesticks based on rsi.

- The relative strength index ( RSI ) is a technical indicator used in the analysis of financial markets.
It is intended to chart the current and historical strength or weakness of a stock or market based on the closing prices of a recent trading period.
- This indicator allows us to visualize the levels of rsi in the chart, so that we can calculate take profit and stop points in a simple way,
knowing what position the price is currently in relation to these levels and how much space we have.
- We can also visualize the slope of the three levels of rsi , overbought, oversold and level 50, something that is not possible in the oscillator version.
- It allows you to display 2 rsi values at the same time.
- Allows to change the color of candlesticks based on rsi.
릴리즈 노트
V 2.0릴리즈 노트
V 2.1릴리즈 노트
V 2.2초대 전용 스크립트
이 스크립트에 대한 접근은 작성자가 승인한 사용자로 제한되며, 일반적으로 지불이 필요합니다. 즐겨찾기에 추가할 수 있지만 권한을 요청하고 작성자에게 권한을 받은 후에만 사용할 수 있습니다. 자세한 내용은 Vertical-X에게 문의하거나 아래의 작성자의 지시사항을 따르십시오.
TradingView does not suggest paying for a script and using it unless you 100% trust its author and understand how the script works. In many cases, you can find a good open-source alternative for free in our Community Scripts.
차트에 이 스크립트를 사용하시겠습니까?
경고: 액세스를 요청하기 전에 읽어 보시기 바랍니다.
🔰 The Best Trading Indicators: links.verticaltraders.io
면책사항
이 정보와 게시물은 TradingView에서 제공하거나 보증하는 금융, 투자, 거래 또는 기타 유형의 조언이나 권고 사항을 의미하거나 구성하지 않습니다. 자세한 내용은 이용 약관을 참고하세요.