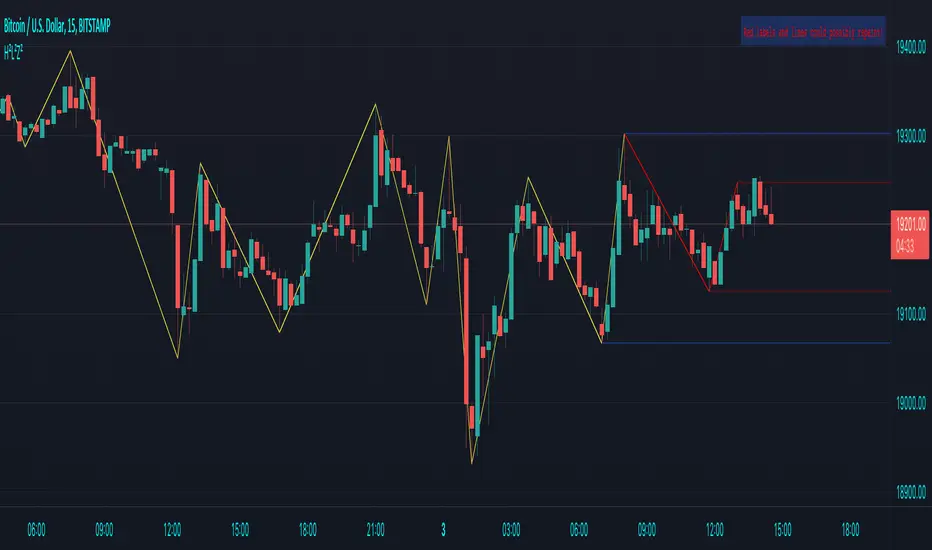
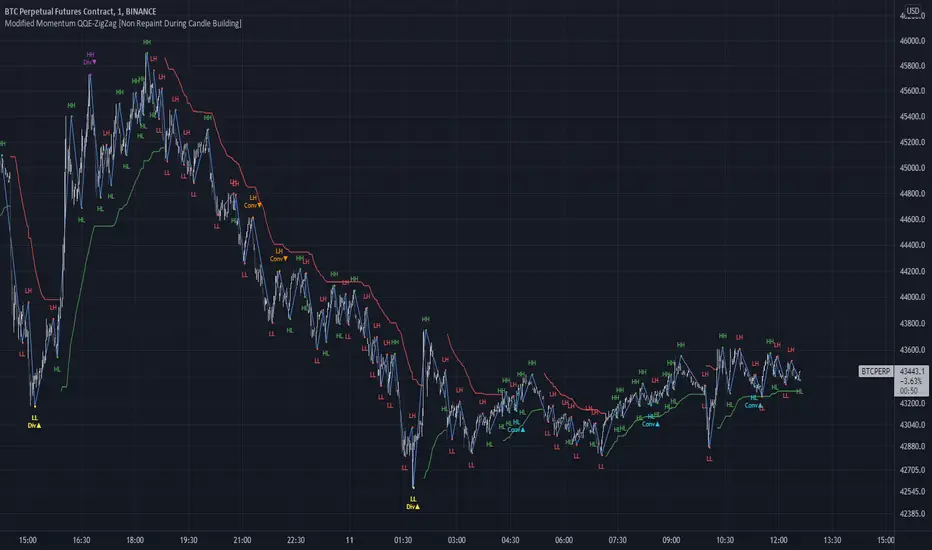
Divergence BacktesterThere is n number of possible ways in which we can backtest divergence and this is just a start :)
In this script, we are trying to count how many times the pivots made HH, HL, LH, LL after a particular divergence state.
An example of using data is as below:
The script keeps track of each pivot sentiment and resulting next pivot state. As mentioned in the chart snapshot, we can look at two of the previous pivot states and collect stats on how each of these state impacted price action.
As mentioned before, this is just tip of iceberg. Further combinations for which we can do backtest are:
1. m X n combinations of last pivot and last to last pivot divergence state
2. divergence combined with double divergence state.
Only issue to explore further is lack of space on the chart as tables can take up huge space.
PS: As you can see based on historical stats, probability of divergence impacting the change of trend is very low in most cases.
지그 재그 인디케이터

HH-LL ZZAnother ZigZag, yes...
I believe though this concerns another angle/principle, therefore I wanted to share
How does it work?
Given:
source for level breach -> close
X breaches -> 3
Let's say this is the latest found 'lower low' (LL - blue dot under bar):
This bar has been triggered because 3 bars closed under low of previous 'trigger bar' (TB )
The high and low of this new TB will act as triggers
(aqua blue lines, seen in image above)
Then there are 2 options:
- again 3 bars closes under the latest TB , in that case the TB moves to that new LL.
- 3 bars closes higher than the high of previous TB
The high and low of this new TB act again as trigger
If a new TB LL/HH is found, the script checks previous LL/HH
and searches the highest/lowest point in between.
If necessary, the temporary highest/lowest will be adjusted:
Another example:
The last 2 points can change (repaint).
Yellow coloured lines/labels are set and won't change anymore.
Concluded:
In case of these settings:
source for level breach -> close
X breaches -> 3
once a new TB is found, the high and low act as trigger lines
- when 3 bars closes under that low , a new LL is found, this will be the new TB
- when 3 bars closes above that high , a new HH is found, this will be the new TB
and so on...
Settings:
source for level breach -> close or high/low - H/L
X breaches -> 1 -> 10
line style -> solid, dotted, dashed
show level breaches -> new found TB (blue/lime coloured)
show Support/Resistance (lines at the right)
repaint warning can be removed
show labels / lines
This ZZ can be used for Harmonic patterns, Trend evaluation, support/resistance,...
In this script, I also used new features
- text_font_family = font.family_monospace -> link
- display=display.pane -> link
Cheers!
Micro ZigzagMicro zigzag is created based on similar concepts as that of zigzag but by using lower timeframe intra-bar data. The lines join candle's high/low points but also depict how the price movement within the candle happened. That is, if the high of the candle is reached first, pivot from previous candle join the high first and then low and vice versa.
The output can also be viewed as advanced line chart.
🎲 Process
🎯 For every bar identify whether high came first or low by using lower timeframe data.
🎯 If high came before low, add high as high pivot first and then low as low pivot. If otherwise, add low as lower pivot first and then high as higher pivot.
🎯 When adding pivot, check if the last pivot is in the same direction as the new one. If yes, replace existing pivot if the new one goes beyond it. Ignore otherwise.
🎯 If the last pivot is of different direction as that one new one, then simple add the new pivot.

Structured zigzag support&resistance [LM]Hello Traders,
I would like to introduce you Structured zigzag support&resistance. It is based on the ZigZag semafor script made by DevLucem so shout out to him
The indicator is used to spot future multi-level Supports and Resistance zones. It is also useful to spot HL or LL or HH or LH zones
I's the same zigzag indicator as my other zigzag indicator with highlight on diagonal lines(highs and lows are automatically classified and also new types of diagonal lines that connects low or highs and extends to right are drawn )
It has two settings:
Fist is to control horizontal lines and zigzag setting
Second is to control diagonal lines
I hope you will enjoy it as I enjoyed to write it.
Lukas

RSI Divergence Scanner by zdmreDivergence is when the price of an asset is moving in the opposite direction of a technical indicator, such as an oscillator, or is moving contrary to other data. Divergence warns that the current price trend may be weakening, and in some cases may lead to the price changing direction.
If the stock is rising and making new highs, ideally the RSI is reaching new highs as well. If the stock is making new highs, but the RSI starts making lower highs, this warns the price uptrend may be weakening. This is negative divergence.
Positive divergence is the opposite situation. Imagine the price of a stock is making new lows while the RSI makes higher lows with each swing in the stock price. Investors may conclude that the lower lows in the stock price are losing their downward momentum and a trend reversal may soon follow.
Divergence is one of the common uses of many technical indicators, primarily the oscillators.
Use it at your own risk

Support and Resistance Multiperiod (Zig Zag Based)Support and Resistance Multiperiod (Zig Zag Based)
What is the indicator?
• The indicator is a multi period (up to 5 lengths) Support and Resistance indicator calculated based on Zig Zag.
Who can use?
Scalpers to Long term investors
What timeframe to use?
• Any timeframe
What are the lines?
• Green lines are Support levels.
• Orange lines are Resistance levels.
How to use?
• Buy Low and Sell High.
• Brighter zones means strong Support or Resistance.
• Weaker zones appear lighter.
• Brighter zones are formed by overlapping of lines from multiple levels of support or resistance.
Indicator Menu
• The indicator can input 5 different Lengths.
• The default settings uses 13, 21, 52, 100 & 200.
• Every option are customizable.

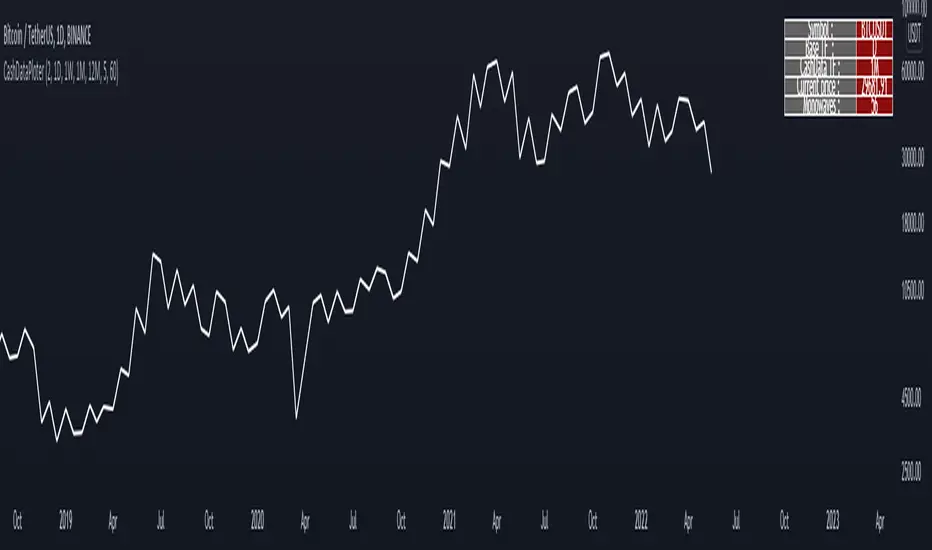
CashDataPloter Tihs indicator is able to draw cash data for :
• Annual timeframe
• Monthly, 3month, 6 month timeframe
• weekly, 2 week timeframe
• daily, 2 day, 3 day timeframe
• 6 hour, 12 hour timeframe
• 4 hour, 8 hour timeframe
• 1 hour, 2 hour, 3 hour timeframe
• 5 minute, 10 minute, 15 minute, 30 minute timeframe
other options :
• displaying information table of cash data
• choosing of cash data thickness
• choosing of bulish Monowaves color
• choosing of bearish Monowaves color
• choosing of connecting Monowaves color
Zigzag MatrixNothing fancy. Just converted the new matrix library of zigzags ( mZigzag ) into indicator as I sensed it can be useful as indicator.
On top of the standard zigzag, the indicator also tracks given oscillators, moving average and volume indicators on each pivots. More indicators can be added programmatically - but it will take up space in chart. Hence, so far I have only added option to add one per each type (moving average, oscillator and volume)
Settings are as below

Wedge and Flag Finder (Multi - zigzag)Here is a small attempt to automatically identify wedges and flags.
Tradingview standard wedge checks for only 4 pivots. In this version, I have considered 5 pivots instead - which can help reduce noise as 4 pivots forming wedge can be quite common. In future, will also try to add more pivots in pattern recognition to make the signal more accurate.
If wedge comes with a tail, then it is marked as flag :)
Settings are quite simple and they are as shown below

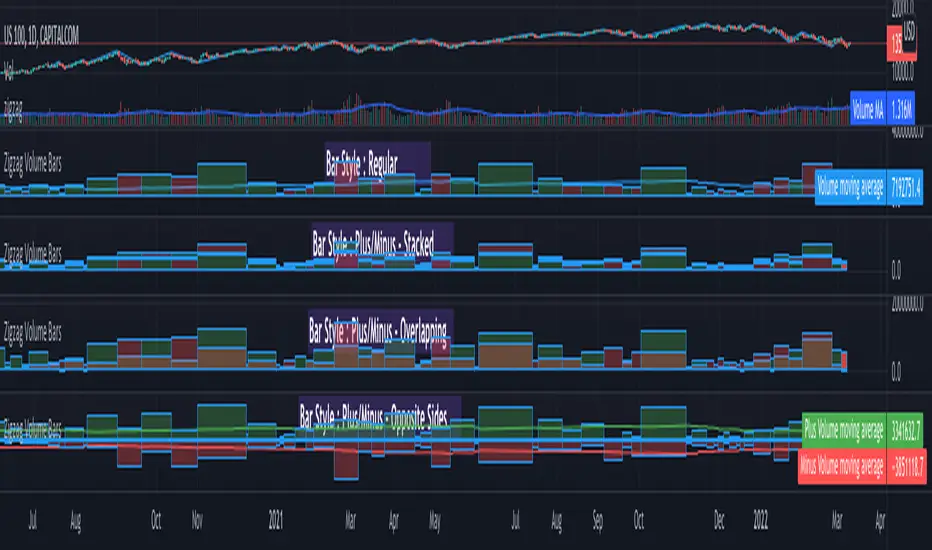
Zigzag Volume BarsBack to my favourite topic - Zigzags.
Here is an indicator which can help you visualise volume data on Zigzag swing highs and lows.
Settings are pretty simple and provides variety of display options
Display options are as demonstrated in the chart has following main types.
Regular
Plus/Minus - Stacked
Plus/Minus - Overlapping
Plus/Minus - Opposite Sides
Apart from the main display types, stacked display has several sub-types which determine whether to place green bar below red or the other way around.
Snapshot below shows example of each type.
Zig Zag(auto Horizon lines)A guy who automatically draws a horizon from the top of the zigzag
*Gray horizon may be repainted
The horizon of the characteristic price in the past reacts well, so it is used for contrarian
ジグザクの頂点から、自動で水平線を引く奴です
※灰色の水平線はリペイントする可能性があります
過去の特徴的な価格の水平線はよく反応するので、逆張りするとかが用途です

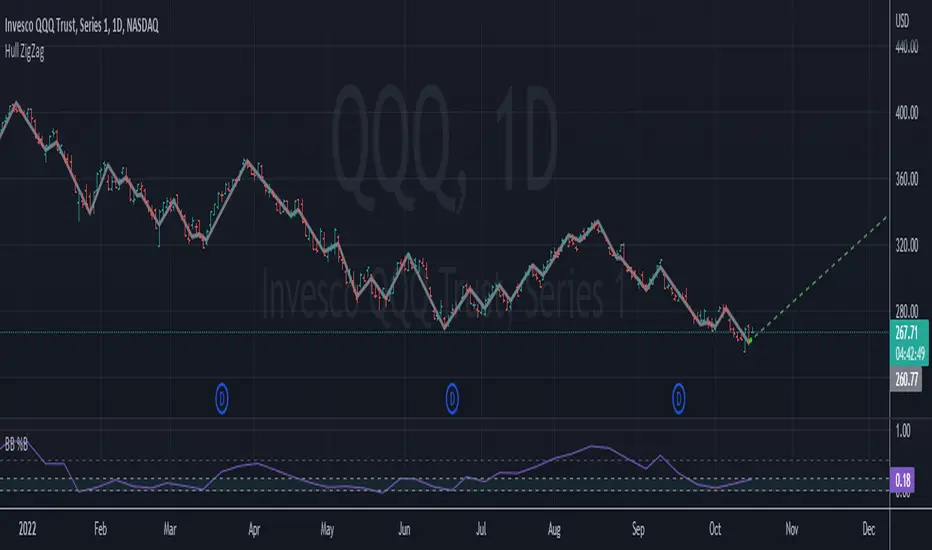
Hull ZigZagA simple indicator I use to filter out noise. it tracks reversals of a Hull Moving Average, which ultimately highlights short term trends and potential chart patterns. I've also included an option to project the most recent trend forward, if that is something you would like to tinker with.
Modified QQE-ZigZag [Non Repaint During Candle Building]V V V V V V V Please Read V V V V V V V
I ask Peter and he is fine, that im published this script
Tell me if you have some ideas or criticism about that sricpt
>>>>>>>>>> This is a modified Version of Peter_O's Momentum Based ZigZag <<<<<<<<<<<
This is only a test, and i want to share it with the community
It works like other ZigZags
Because Peters_O's original Version is only non repaint on closed historical Data ,
during a Candle building process it can still repaint (signal appears / 21 seconds later signal disapears / 42 seconds later signal appears again in the same candle / etc.),
but that isnt important for backtesting, its only important for realtime PivotPoints during a candle.
My goal for this zigzag was to make it absolute non repaint neither during a candle building process (current candle),
so once the signal is shown there is no chance that it disapers and shown a few seconds later again on that same candle, it can only show up one time per candle an thats it,
and that makes it absolute non repaint in all time frames.
Credits to:
==> Thanks to @glaz , for bringing the QQE to Tradingview <3
==> Thanks to @Peter_O , for sharing his idea to use the QQE as base for a Zigzag
and for sharing his MTF RSI with the Community <3
Changes:
- I changed the MTF RSI a little bit, you can choose between two version
- I changed the QQE a little bit, its now using the MTF RSI , and its using High and Low values as Source to make it absolute non repaint during a candle is building
- I added a little Divergence Calculation beween price and the MTF RSI that is used for the ZigZag
Colors :
- Green for HH / HL Continuation
- Red for LL / LH Continuation
- Yellow for Positive Divergence
- Purple for Negative Divergence
Important:
It is not possible to backtest this script correctly with historical Data, its only possible in Realtime,
because the QQE is using crossunders with RSILowSource and the QQE Line to find the Tops and,
because the QQE is using crossovers with RSIHighSource and the QQE Line to find the Bottoms,
and that means it is not possible to find the correct Time/Moment when that crossovers / crossunders happens in historical Data
=============> So please be sure you understand the Calculation and Backtest it in Realtime when you want to use it,
because i didn't published this script for real trading
=============> Im not a financial advisor and youre using this script at your own risk
=============> Please do your own research
Manual Harmonic Patterns - With interactive inputsThis script is a drawing tool which allows users to draw XABCD on the chart and script will tell whether there is any harmonic patterns on the drawings made. The script is based on interactive inputs and requires users to chose XABCD points.
Please note
This is not a scanner and it will not scan historical bars for harmonic patterns. This needs to be used rather as drawing tool instead.
Script will not check if selected pivots are correct. It assumes users to know how to select the right XABCD based on pivot high/lows. Bullish pattern will have X, B and D as pivot lows and A,C as pivot highs. Similarly bearish patterns will have X, B, D as pivot highs and A, C as pivot lows.
Script will not check for overflow conditions. For example, if price crosses, XB or BD line, then pattern is considered to be invalid. But, this check cannot be made in this script and we require users to be aware of this condition and select input accordingly.
Order of inputs should be in ascending order. X pivot should come before A and then, B, C, D and F. This again is users responsibility to select pivots in right order.
What happens after selecting XABCD?
If selected pattern is valid harmonic pattern, it will
Draw XABCD lines and labels
Fill harmonic triangles
Show PRZ box which shoes the name of valid patterns.
If it is not valid harmonic pattern, then users will see blank XABCD line without any PRZ or filled harmonic triangles.
Example:
1. When it is valid pattern
2. When it is not valid pattern

Cyclic RSI High Low With Noise Filter█ OVERVIEW
This indicator displays Cyclic Relative Strength Index based on Decoding the Hidden Market Rhythm, Part 1 written by Lars von Thienen.
To determine true or false for Overbought / Oversold are unnecessary, therefore these should be either strong or weak.
Noise for weak Overbought / Oversold can be filtered, especially for smaller timeframe.
█ FEATURES
Display calculated Cyclic Relative Strength Index.
Zigzag high low based on Cyclic Relative Strength Index.
Able to filter noise for high low.
█ LEGENDS
◍ Weak Overbought / Oversold
OB ▼ = Strong Overbought
OS ▲ = Strong Oversold
█ USAGE / TIPS
Recommend to be used for Harmonic Patterns such as XABCD and ABCD.
Condition 1 (XABCD) : When ▼ and ▲ exist side by side, usually this outline XA, while the next two ◍ can be BC.
Condition 2 (ABCD) : When ▼ and ▲ exist side by side, usually this outline AB, while the next one ◍ can be BC, strong ABCD.
Condition 3 (ABCD) : When ▼ or ▲ exist at Point A, the next two ◍ can be Point B and Point C, medium ABCD.
Condition 4 (ABCD) : When ◍ exist at Point a, the next two ◍ can be Point b and Point c, weak ABCD usually used as lower case as abcd.
█ CREDITS
LoneSomeTheBlue
WhenToTrade

[KK] ZigZag Percent Reversal - Forecast - patterns - labels Zig Zag indicator plots points on the chart whenever prices reverse
by a percentage greater than a pre-chosen variable.
• Forecasts area based on zigzag statistics.
• Displays labels with detected patterns.

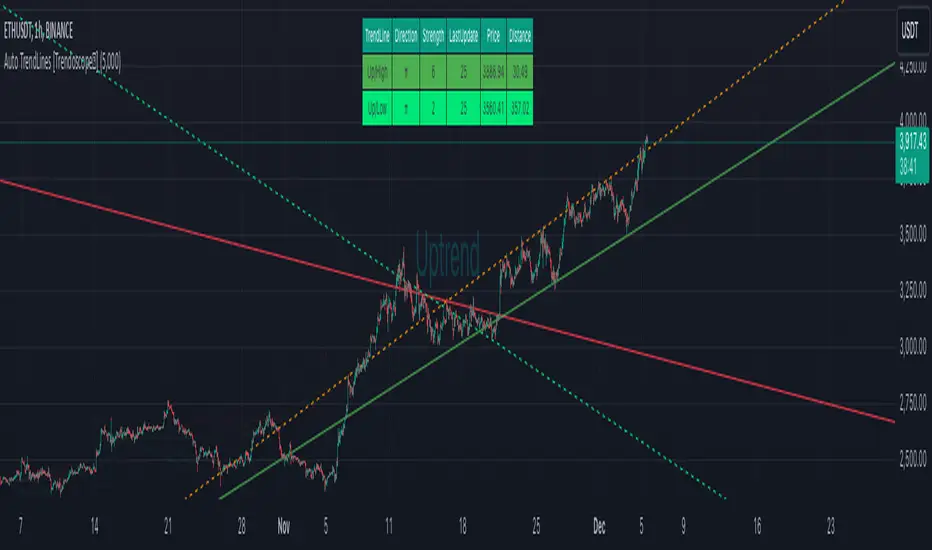
Auto TrendLines [HeWhoMustNotBeNamed]I started off with the intention of creating script to identify Wolfe wave projection. But, soon ran into problem with loops. Realized drawing wedge is more difficult than drawing converging triangle. Hence, took a step back and started working on wedges and triangle identification. Ended up with a messy output which looked like this.
Had to take another step back and hence decided to make Trendlines detection script and here we are :)
⬜ Process
▶ Scan pivots which are in trend. This means, series of pivot Highs or pivot lows either in ascending order or descending order.
▶ Draw trend line between each of the pivots in the trend series. For example, if there are 5 pivot high uptrend pivots, draw mXn lines between each of these points.
▶ Select the trend line which is more accurate or stronger. Accuracy is measured by number of candles/wicks touching the line and number of candles which fall outside the line. Stronger trendlines will touch more candles and pivots with less overflow.
▶ Remove all lines except the most accurate one for each direction.
At any point of time, you will see upto 4 trend lines in this script.
▶ Trendline joining pivot highs in uptrending condition
▶ Trendline joining pivot lows in uptrending condition
▶ Trendline joining pivot highs in downtrending condition
▶ Trendline joining pivot lows in downtrending conditions
The older line will remain until the new one comes through of same type. Hence, you will still be able to see uptrending high and low trend lines for downtrending instruments which are created way back!! Also, new trendlines replace old ones only if they are more stronger (connect to more pivots with less overflow)
⬜ Settings
Settings are simple.
User can select preferred Zigzag Length and Search Depth. Higher numbers for these two parameters will present longer term trends whereas lower numbers will display shorter ones.
Trend Lines controlls will allow users to enable/disable specific type of trend line, set color and line style to it.
⬜ Few Examples
▶ Uptrending Market : NASDAQ:NDX
▶ Downtrending Market : NYSE:BABA
▶ Ranging Market : NYSE:PLTR
RSI Linear Regression with ZigZag by zdmreBoth the RSI (Relative Strength Index) and the Linear Regression ( LR ) rank among the most popular momentum indicators used in trading. When used in combination with other technical indicators (ZigZag), both RSI, LR and ZigZag can offer value in validating trade opportunities to optimize your risk management practices.
Here’s a look at how to use RSI, LR and ZigZag (Can be used for divergence patterns.) as part of your trade analysis.
If you have new ideas to improve this indicator then let me know please.
***Use it at your own risk

Divergence-Support/ResistenceAnother script based on zigzag, divergence, and to yield support and resistence levels.
This idea started with below two concepts:
▶ Support and resistence are simply levels where price has rejected to go further down or up. Usually, we can derive this based on pivots. But, if we start looking at every pivot, there will be many of them and may be confusing to understand which one to consider.
▶ Lot of people asked about one of my previous script on divergence detector on how to use it. I believe divergence should be considered as area of support and resistence because, they only amount to temporary weakness in momentum and nothing more. As per my understanding
Trend > Hidden Divergence > Divergence > Oscillator Levels of Overbought and Oversold
⬜ Process
▶ Now combining the above two concepts - what we are trying to do here is draw support resistence lines only on pivots which has observed either divergence or hidden divergence. Continuation and indecision pivots are ignored.
▶ Input requires only few parameters.
Zigzag lengths and oscillator to be used. Oscillator periods are automatically calculated based on zigzag length. Hence no other information required. You can also chose custom oscillator via external source.
▶ Display include horizontal lines of support/resistence which are drawn from the candle from where divergence or hidden divergence is detected.
▶ Support resistence lines are colored based on divergence. Green shades for bullish divergence and bullish hidden divergence whereas red shades for bearish divervence and bearish hidden divergence. Please note, red and green lines does not mean they only provide resistence or support. Any lines which are below the price should be treated as support and any line which are above the price should be treated as resistence.
▶ Divergence symbols are also printed on the bar from where divergence/hidden divergence is detected.
↗ - Bullish Hidden Divergence
↘ - Bearish Hidden Divergence
⤴ - Bullish Divergence
⤵ - Bearish Divergence
▶ Script also demonstrates usage of libraries effectively. I have used following libraries in this code.
import HeWhoMustNotBeNamed/ zigzag /2 as zg
import HeWhoMustNotBeNamed/enhanced_ta/8 as eta
import HeWhoMustNotBeNamed/ supertrend /4 as st
Can be good combination to use it with harmonic patterns.

3rd WaveHello All,
In Elliott Wave Theory, 3rd wave is not the shortest one in the waves 1/3/5 and it's usually longest one. so if we can catch it then we may get good opportunities to trade. This script finds 3rd wave experimentally. it can be also the 3rd waves in the waves 1, 3, 5, A and C. the 3rd wave should have greater volume than other waves, the script can check its volume and compare with the volumes of the waves 1 and 2 optionally.
Pine Team released Pine version 5! This script was developed in v5 and it uses Library feature of Pine v5 for the zigzag functions. This script is also an example for the Pine developers who learn Pine v5 and Libraries.
Options:
Zigzag Period: is the length that is used to calculate highest/lowest and the zigzag waves
Min/Max Retracements: is the retracement rates to check the wave 2 according to wave 1. for example; if min/max values are 0.500-0.618 then wave 2 must be minimum 0.500 of wave 1 and maximum 0.618 of wave 1.
Check Volume Support: is an option to compare the volumes of1. 2. and . waves. if you enable this option then the script checks their volume and 3rd wave volume must be greater then 1 and 2
there are 4 options for the targets. you can enable/disable and change their levels. targets are calculated using length of wave 1.
Options to show breakout zone, zigzag, wave 1 and 2.
and some options for the colors.
The Library that is used in this script:
P.S. This is an experimental work and can be improved. So do not hesitate to drop your comments under the script ;)
Enjoy!

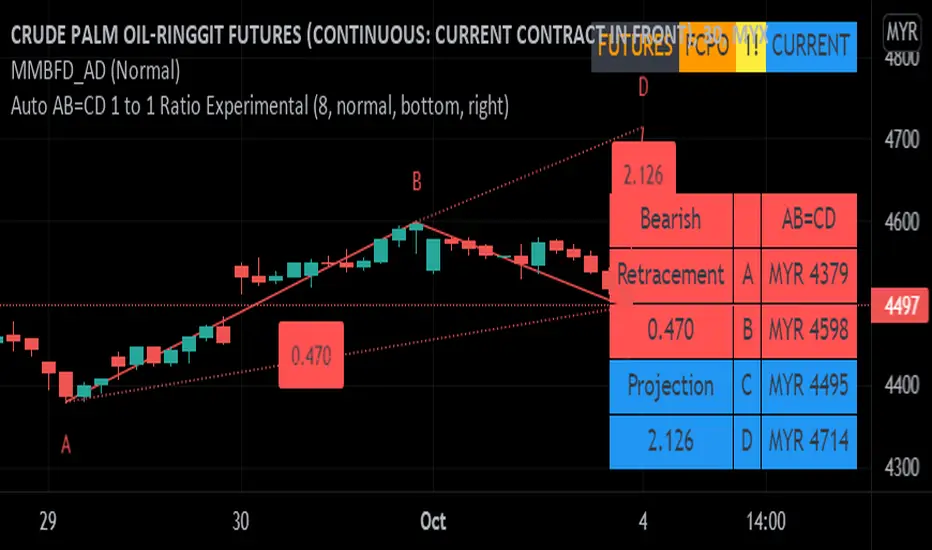
Auto AB=CD 1 to 1 Ratio ExperimentalThis indicator was experimental based AB=CD, shows last AB=CD either Standard AB=CD or Reciprocal AB=CD which uses time instead of bar_index.
This build is based upon educational materials (refer below resources).
ABCD are based on 1 to 1 Ratio for price and time.
Features / Pros:
1. Show last AB=CD points and lines including table value.
2. Customize table position and size.
3. For desktop display only, not for mobile.
Cons:
1. Time for point D less accurate for intraday timeframe (minute, hour, etc) which may including holidays and depends on price volatility.
2. Label ratio not shown properly depends on timeframe especially for intraday timeframe and maybe for Daily and Weekly timeframe.
3. Experimental code, use at your own risk.
FAQ
1. Credits
Scott M Carney, Harmonic Trading: Volume One and Two.
LonesomeTheBlue for zigzag array source code.
HeWhoMustNotBeNamed for some guidance and advice.
2. Previous Build / Resources
Link 1
Link 2
Link 3
Link 4
3. Code Usage
Free to use for personal usage.
Left : Bullish AB=CD, Right : Bullish Reciprocal AB=CD
Left : Bearish AB=CD, Right : Bearish Reciprocal AB=CD
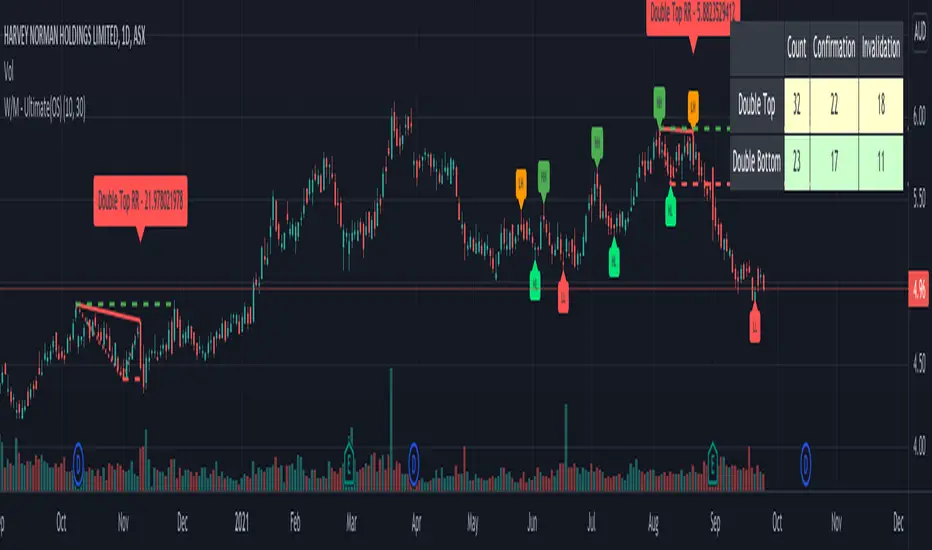
Double Top/Bottom - Ultimate (OS)This is zigzag based double top/bottom indicator. Code is same as : Double-Top-Bottom-Ultimate
But, republishing it to make it available open source.
Double Top:
Recognition - Checks on Zigzag if LH is followed by HH
Confirmation - When low crosses under last lower pivot point on zigzag
Invalidation - When high crosses over HH
Double Bottom:
Recognition - Checks on Zigzag if HL is followed by LL
Confirmation - When high crosses over last higher pivot point on zigzag
Invalidation - When low crosses under LL
Few input options:
Option to display risk per reward which defines how steep is the W-M triangle. This is simply the ratio of price difference between mid point to top most and bottom most points. In case of double top , downside is considered as reward and upside is considered as risk and with double bottom , downside is considered as risk and upside is considered as reward. Lower risk per reward signifies better trade.
Option to display stats which shows number of occurances of double top and bottom and how many times price crossed confirmation point and invalidation point (which are also marked with dashed lines) Stats are color coded. Higher confirmation rates are colored in shades of green, lower confirmation rates are colored in shades of orange whereas the neutral confirmation rates are coloed in light yellow.
Multi-ZigZag Multi-Oscillator Trend DetectorThis table is intended to give you snapshot of how price and oscillators are moving along with zigzag pivots.
This is done in the same lines of Zigzag-Trend-Divergence-Detector
But, here are the differences
Table shows multiple oscillator movements at a same time instead of one selected oscillator
Divergence is not calculated and also supertrend based trend. Trend can be calculated based on zigzag movements. However, lets keep this for future enhancements.
This system also uses multiple zigzags instead of just one.
⬜ Process
▶ Derive multiple zigzags - Code is taken from Multi-ZigZag
▶ Along with zigzags - also calculate different oscillators and attach it to zigzag pivot.
▶ Calculate directions of zigzag pivots and corresponding oscillators.
▶ Plot everything in the table on last bar.
⬜ Table components
Table contains following data:
Directional legends are:
⇈ - Higher High (Green)
⇊ - Lower Low (Red)
⭡- Lower High (Orange)
⭣ - Higher Low (Lime)
⬜ Input Parameters
▶ Source : Default is close. If Unchecked - uses high/low data for calculating pivots. Can also use external input such as OBV
▶ Stats : Gives option to select the depth of output (History) and also lets you chose text size and table position.
▶ Oscillators : Oscillator length is derived by multiplying multiplier to zigzag length. For example, for zigzag 5, with 4 as multiplier, all oscillators are calculated with length 20. But, same for zigzag 8 will be 32 and so on.
▶ Available oscillators :
CCI - Commodity Channel Index
CMO - Chande Momentum Oscillator
COG - Center Of Gravity
MFI - Money Flow Index (Shows only if volume is present)
MOM - Momentum oscillator
ROC - Rate Of Change
RSI - Relative Strength Index
TSI - Total Strength Index
WPR - William Percent R
BB - Bollinger Percent B
KC - Keltner Channel Percent K
DC - Donchian Channel Percent D
ADC - Adoptive Donchian Channel Percent D ( Adoptive-Donchian-Channel )
⬜ Challenges
There are 12 oscillators and each zigzag has different length. Which means, there are 48 combinations of the ocillators.
First challenge was generating these values without creating lots of static initialization. Also, note, if the functions are not called on each bar, then they will not yield correct result. This is achieved through initializer function which runs on every bar and stores the oscillator values in an array which emulates multi dimensional array oscillator X zigzag length.
Next challenge was getting these values within function when we need it. While doing so I realized that values stored in array also have historical series and calling array.get will actully get you the entire series and not just the value. This is an important takeaway for me and this can be used for further complex implementations.
Thanks to @LonesomeTheBlue and @LucF for some timely suggestions and interesting technical discussions :)
