Zig Zag High LowZig Zag script that uses local minimums and maximums as pivot points. It can be used as a source for pattern recognition.Pine Script® 인디케이터Tr0sT의4444 1.2 K
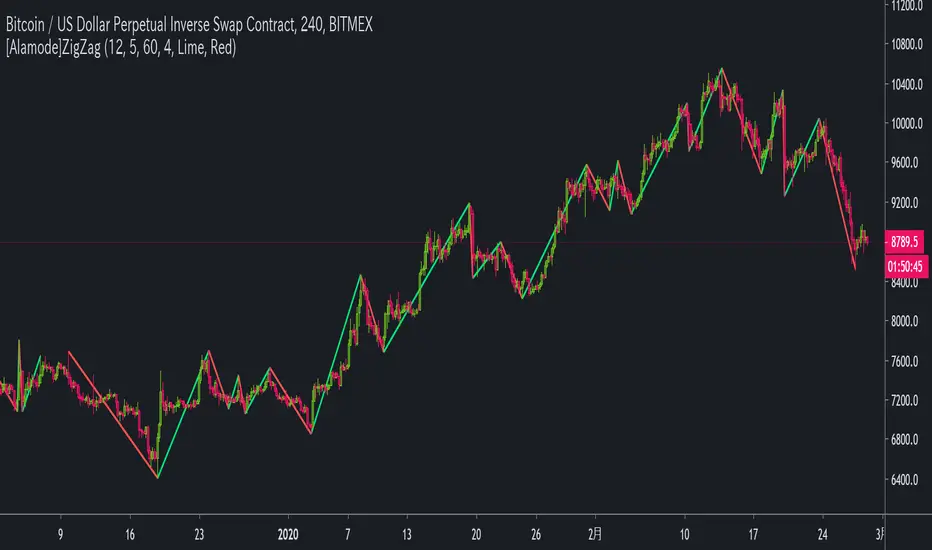
[Alamode]ZigZagOne of the Alamode series that allows you to visually judge trends. Helps you draw Fibonacci retracements and Fibonacci expansions.Pine Script® 인디케이터ChoixAlamode의559
Smart Indicator 28 - Swing Pivots (Higher Highs and Lower Lows)A simple way to find Higher Highs and Lower Lows (HH and LL) whit automatic Fibonacci Lines in the most common levels. In this indicator the Higher Highs only happens when a high value are rising from each other in the last "Length of Real Pivots" highs and the next same number of highs are falling in every single bar. The Lower Lows are inverted, LL only appears if a low is falling in every single bar in the last number of length and the lows price of the "n" bars next are rising. You can use this Indicator in any kind of market. Pine Script® 인디케이터RodrigoKazuma의업데이트됨 2020 1.7 K
Trend LinesHello Everyone! This is my new trend lines script (after beta version that was published almost one year ago) The idea is to find Pivot Highs (PH) and Pivot Lows(PL) first. Then, If current PH is smaller then previous PH (means no new higher high and possible downtrend) then draw trend line using them. and also it checks previous trend line (if exits) and if current angle is smaller then don't extend previous one. Same idea when using Pivot Lows, If current PL is higher then previous PL (means no new lower low and possible uptrend) then draw trend line using them. and also it checks previous trend line (if exits) and if current angle is smaller then don't extend previous one. Optionally style of old trend lines drawn as dashed. Hope you enjoy it!Pine Script® 인디케이터LonesomeTheBlue의업데이트됨 6565 8.7 K
AB=CD Pattern_ULTRA V1 [NXT2017] Autodrawing Harmonic PatternPrivate indicator. HI BIG PLAYERS AROUND THE WORLD, this script allows to draw automatically lines of AB=CD Pattern . The AB=CD Pattern is part of Harmonic Pattern . Parallel to the automatic drawing, the indicator can give signals as soon as the typically Fibonacci extension immediately reached or has been reached. This allows the indicator AB=CDPattern_ULTRA V1 to give early signals. In the default settings, the signals are displayed with a blue background on the chart. NO REPAINT As soon as the most points of the pattern are developed, the last point is a fix prediction without any repaints! AB=CDPattern_ULTRA V1 is offered for sale. More information can be found below in the signature. In the settings it is possible to change the degree of details. This is sometimes necessary because TradingView limited only 55 lines per indicator in Pinescript Version 4. Furthermore, you can set a range how much bars back you want go from current bar for the automatic drawings. As default is setting 2000 bars back. In extreme cases it is possible to change the settings to "lite" that the AB=CD Pattern represent waves only with 2 lines. This allows the indicator to detect far more AB=CD Pattern on the same chart. For more great indicators everyone is invited to follow me on TradingView. Kind regards NXT2017 Pine Script® 인디케이터NXT2017의업데이트됨 9191308
CypherPattern_ULTRA V1 [NXT2017] Autodrawing Harmonic PatternPrivate indicator. HI BIG PLAYERS AROUND THE WORLD, this script allows to draw automatically lines of Cypher Pattern . The Cypher Pattern is part of Harmonic Pattern . Parallel to the automatic drawing, the indicator can give signals as soon as the typically Fibonacci extension immediately reached or has been reached. This allows the indicator CypherPattern_ULTRA V1 to give early signals. In the default settings, the signals are displayed with a blue background on the chart. NO REPAINT As soon as the most points of the pattern are developed, the last point is a fix prediction without any repaints! CypherPattern_ULTRA V1 is offered for sale. More information can be found below in the signature. In the settings it is possible to change the degree of details. This is sometimes necessary because TradingView limited only 55 lines per indicator in Pinescript Version 4. In extreme cases it is possible to change the settings to "lite" that the Cypher Pattern represent waves only with 2 lines. This allows the indicator to detect far more Cypher Pattern on the same chart. For more great indicators everyone is invited to follow me on TradingView. Kind regards NXT2017 Pine Script® 인디케이터NXT2017의업데이트됨 3131184
5-0 Pattern ULTRA V1 [NXT2017] Autodrawing Harmonic PatternPrivate indicator. HI BIG PLAYERS AROUND THE WORLD, this script allows to draw automatically lines of 5-0 Pattern . The 5-0 Pattern is part of Harmonic Pattern . Parallel to the automatic drawing, the indicator can give signals as soon as the typically Fibonacci extension immediately reached or has been reached. This allows the indicator 5-0Pattern_ULTRA V1 to give early signals. In the default settings, the signals are displayed with a blue background on the chart. NO REPAINT As soon as the most points of the pattern are developed, the last point is a fix prediction without any repaints! 5-0Pattern_ULTRA V1 is offered for sale. More information can be found below in the signature. In the settings it is possible to change the degree of details. This is sometimes necessary because TradingView limited only 55 lines per indicator in Pinescript Version 4. In extreme cases it is possible to change the settings to "lite" that the 5-0 Pattern represent waves only with 2 lines. This allows the indicator to detect far more 5-0 Pattern on the same chart. For more great indicators everyone is invited to follow me on TradingView. Kind regards NXT2017 Pine Script® 인디케이터NXT2017의업데이트됨 222284
NenStar Pattern ULTRA V1 [NXT2017] Autodrawing Harmonic PatternPrivate indicator. HI BIG PLAYERS AROUND THE WORLD, this script allows to draw automatically lines of NenStar Pattern . The NenStar Pattern is part of Harmonic Pattern . Parallel to the automatic drawing, the indicator can give signals as soon as the typically Fibonacci extension immediately reached or has been reached. This allows the indicator NenStarPattern_ULTRA V1 to give early signals. In the default settings, the signals are displayed with a blue background on the chart. NO REPAINT As soon as the most points of the pattern are developed, the last point is a fix prediction without any repaints! NenStarPattern_ULTRA V1 is offered for sale. More information can be found below in the signature. In the settings it is possible to change the degree of details. This is sometimes necessary because TradingView limited only 55 lines per indicator in Pinescript Version 4. In extreme cases it is possible to change the settings to "lite" that the NenStar Pattern represent waves only with 2 lines. This allows the indicator to detect far more NenStar Pattern on the same chart. For more great indicators everyone is invited to follow me on TradingView. Kind regards NXT2017 Another example: Pine Script® 인디케이터NXT2017의업데이트됨 1172
[fikira] Harmonic Patterns 2This is "Harmonic Patterns", part 2 Open Source (in 2 parts, otherwise many lines are gone because the script is too large): - Crab - Bat (+ Alt) - Butterfly - Shark A "Pattern" is created by checking 5 consecutive ( pivot ) points, starting with X, A, B, C, and ending with point D. At point D all 5 points are compared, calculated and verified. When confirmed, a "Label" will be plotted at point D, together with the "Entry", "Take Profit" and "Stop Loss" price. The "Entry", "Take Profit" and "Stop Loss" lines will be plotted as well at point D. Lastly, a "Drawing" automatically will be displayed which makes the "Pattern" visible. Please do mind, the "Drawing" is calculated differently, the "Drawing" sometimes can be displayed incorrectly when prices are too close to each other (for example low Satoshi price changes). THE "ENTRY", "TAKE PROFIT", "STOP LOSS" PRICES AND LINES ARE NOT AFFECTED AT ALL BY THIS, THEY WILL SHOW CORRECTLY! - 1 "TP point" can be changed ("TP Level 0.618") - "Labels", "Lines", "Drawings" can be disabled/enabled - "Labels" can be made smaller or bigger ("Size Label") - "Labels" can be placed further or closer to the bar ("Distance TP Label" > higher = closer, lower = further) - "Lines" can be made thicker or thinner ("TP Linewidth") - "Drawings" can be made thicker or thinner ("Drawings Linewidth") - "Drawings" are created by comparing with 100 bars back in history (default), should it be (very rarely) a triangle is displayed flat on the left side, possibly the first point(s) is/are further than 100 bars ago, in this case increase "Period Drawings" above 100. - Animal symbols can be enabled/disabled - When several "Patterns" appear on the chart, the oldest ones won't be displayed anymore, first the "Drawings", then the "Lines" The last (present) ones will always be displayed in total without a problem! - If you want to see "Patterns" with less correct measurement, change "Error Marge" 0.9 - 1" and "Error Marge" 1 - 1.1"), this gives max. about 10% extra margin - Added more settings regarding "Drawing Lines" Thank you very much!Pine Script® 인디케이터fikira의업데이트됨 5555 1.4 K
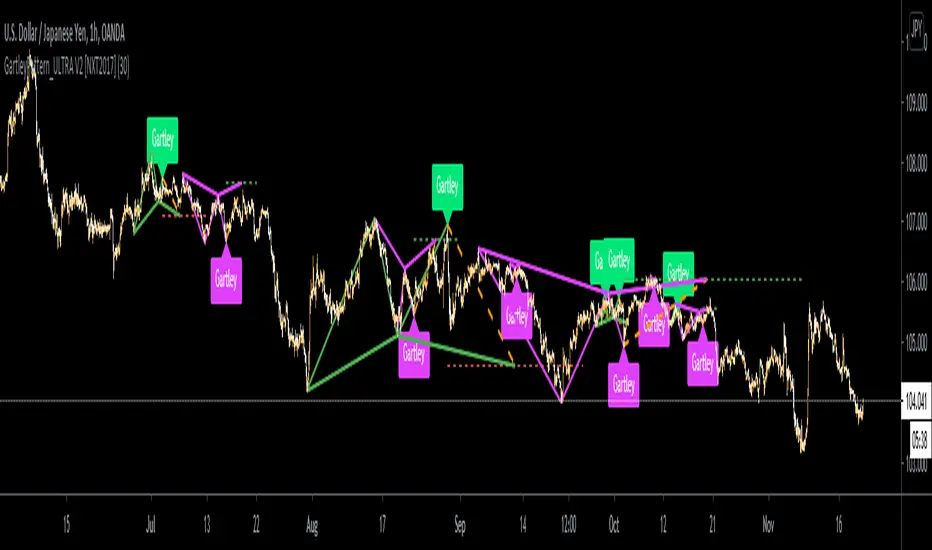
GartleyPattern_ULTRA V1 [NXT2017] Autodrawing Harmonic PatternPrivate indicator. HI BIG PLAYERS AROUND THE WORLD, this script allows to draw automatically lines of Gartley Pattern. The Gartley Pattern is part of Harmonic Pattern. Parallel to the automatic drawing, the indicator can give signals as soon as the typically Fibonacci extension immediately reached or has been reached. This allows the indicator GartleyPattern_ULTRA V1 to give early signals. In the default settings, the signals are displayed with a blue background on the chart. NO REPAINT As soon as the most points of the pattern are developed, the last point is a fix prediction without any repaints! GartleyPattern_ULTRA V1 is offered for sale. More information can be found below in the signature. In the settings it is possible to change the degree of details. This is sometimes necessary because TradingView limited only 55 lines per indicator in Pinescript Version 4. Furthermore, you can set a range how much bars back you want go from current bar for the automatic drawings. As default is setting 2000 bars back. In extreme cases it is possible to change the settings to "lite" that the Gartley Pattern represent waves only with 2 lines. This allows the indicator to detect far more Gartley Pattern on the same chart. For more great indicators everyone is invited to follow me on TradingView. Kind regards NXT2017 More Examples: Pine Script® 인디케이터NXT2017의업데이트됨 4646325
[fikira] Harmonic Patterns (Gartley)When using "Harmonic Patterns", always look at the bigger picture, please do not depend solely on the "Pattern". Use other indicators,... to confirm what you think is going on! That said, it is quite useful! Here we have "The Gartley", bullish and bearish. The "Pattern" is created by checking 5 consecutive (pivot) points, starting with X, A, B, C, and ending with point D. At point D all 5 points are compared, calculated and verified. When confirmed, a "Label" will be plotted at point D, together with the "Entry", "Take Profit" and "Stop Loss" price. The "Entry", "Take Profit" and "Stop Loss" lines will be plotted as well at point D. Lastly, a "Drawing" automatically will be displayed which makes the "Pattern" visible. Please do mind, the "Drawing" is calculated differently, the "Drawing" sometimes can be displayed incorrectly when prices are too close to each other (for example low Satoshi price changes). THE "ENTRY" , "TAKE PROFIT", "STOP LOSS" PRICES AND LINES ARE NOT AFFECTED AT ALL BY THIS, THEY WILL SHOW CORRECTLY! - 1 "TP point" can be changed ("TP Level 0.618") - "Labels", "Lines", "Drawings" can be disabled/enabled - "Labels" can be made smaller or bigger ("Size Label") - "Labels" can be placed further or closer to the bar ("Distance TP Label" > higher = closer, lower = further) - "Lines" can be made thicker or thinner ("TP Linewidth") - "Drawings" can be made thicker or thinner ("Drawings Linewidth") - "Drawings" are created by comparing with 100 bars back in history (default), should it be (very rarely) a triangle is displayed flat on the left side, possibly the first point(s) is/are further than 100 bars ago, in this case increase "Period Drawings" above 100. - When a lot (really a lot!) of "Patterns" appear on the chart, the first ones will not be displayed anymore, first the "Drawings", then the "Lines" The last (present) ones will always be displayed in total without a problem! - If you want to see "Patterns" with less correct measurement, change "Error Marge" 0.9 - 1" and "Error Marge" 1 - 1.1"), this gives max. about 10% extra margin Thank you very much!Pine Script® 인디케이터fikira의업데이트됨 1616 1.4 K
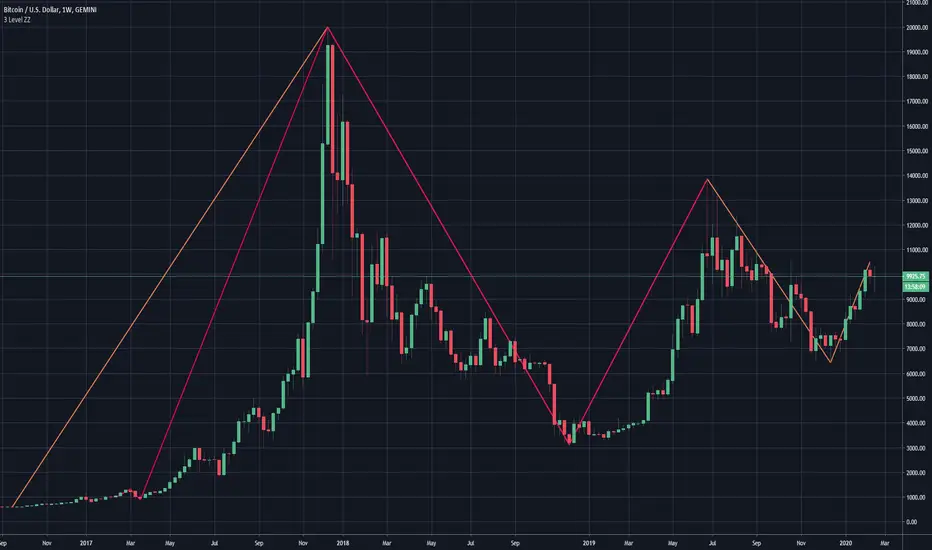
bee ZZBreakdown trading system ( TS ) based on the ZZ indicator ( zig-zag ) using SAR (stop and reverse). The system calculates the long level and short level, depending on the direction of the breakdown - we enter the long or short position. The strategy is always in position (in the market), the strategy being in the long side reverses the position at the short level, and accordingly, on the contrary, it is in short at the long level, thereby fixing profit / loss. The strategy has proved itself to be highly volatile. Strategy tested on BitMEX exchange. It is possible to get acquainted with the results of the strategy by running the script by history.Pine Script™ 전략beebot의1165
XABCD ScannerXABCD Scanner for TradingView These bullish and bearish 5-point patterns are based on various Fibonacci retracement levels and signify potential reversal zones (PRZ). As they become 80% complete, the dashed-line pattern will appear, displaying the PRZ and giving you time to prepare for a reversal. Different combinations of specific fib retracements and extensions result in different patterns, and each is named for identification. Bullish patterns signify a potential turn to the upside are colored green. Bearish patterns signify a potential turn to the downside are colored red. 9 popular patterns are currently recognized. XABCDs can be applied to all markets: crypto, forex, commodities, indices, etc. For access, please visit the link in our Signature below, or shoot us a PM. Pine Script® 인디케이터CoinObservatory의업데이트됨 7575509
Elliott Wave - AutoCounting [NXT2017] draws the Wave 3 and 5HI BIG PLAYERS, here's another indicator that I use pretty often. The waves of Elliott Wave theory are automatically detected and displayed. It makes it possible to count the Elliott waves almost always correctly and plausibly. However, the tool can only detect wave 3 as well as waves 5, A, B and C. The rest you have to draw yourself. Sometimes the waves 3 and 5/A/B/C overlap - so I only use the view with wave 3 myself. Kind regards NXT2017Pine Script® 인디케이터NXT2017의업데이트됨 360360 1 K
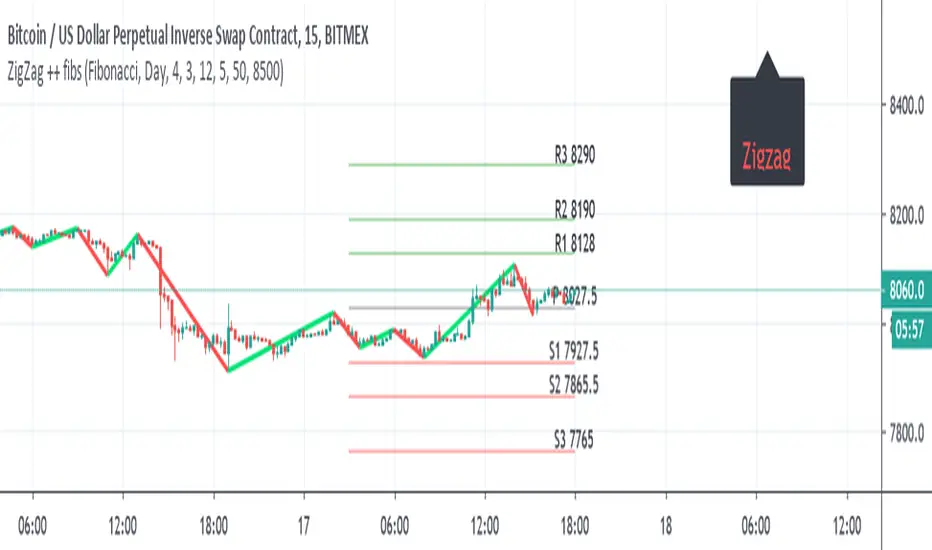
ZigZag ++ fibsI just put this as one user ask for me to do it. So it the zigzag++ and fibs ,and other pivots type the fibs can daily , monthly , year the info panel need to be adjusted by either offset =distance from or by putting a number , here its btc so I put about 500 above from close =8500 this important as otherwise it will look messy and not pretty so for each type of asset you use , you expect to adjust this two variables or the data of fibs (daily , weekly etc)Pine Script® 인디케이터RafaelZioni의77 1.1 K
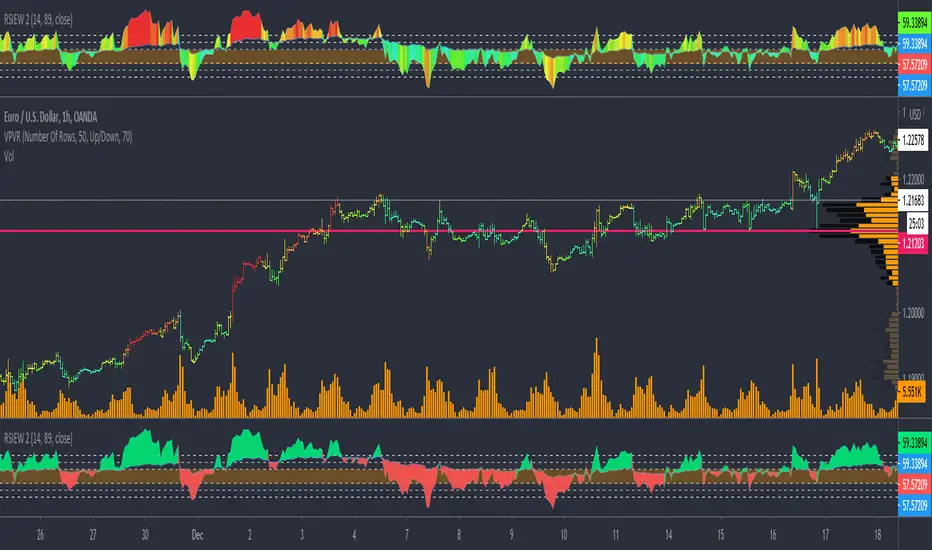
RSIEW V2 Thermal Falsecolor show Hot (Impulse) Cold (Correction)HI BIG PLAYER AROUND THE WORLD, here is my new creation of modified RSI Indikator. In order to the RSIEW Version 1 (look below this text) I build a thermal rainbow chart that shows the spectrum with all overbought and oversell phases. The colour spectrum can be compared with a thermal imaging camera. In one hand, the hottest candles (going into red) show the extrem points of the chart. In trend direction this is often wave 3 of Elliott Waves theory and in correction phase it show the bounce period. In other hand, the coldest candles (going into blue) show the weak points of the chart. In trend direction this is often a "cooling down" and in big correction phases it demonstrate frozen prices (really unattractive trading time). Have fun with this and give me a feedback. Of course, you are invited to follow me. KIND REGARDS NXT2017Pine Script® 인디케이터NXT2017의업데이트됨 1010585
ZigZag - lucemanb THIS CODE IS BASED FROM THE MT4 ZIGZAG INDICATOR THE ZIGZAG SETTINGS FOR THE MAIN ONE ON TRADINGVIEW DO NOT WORK THE SAME AS MT4 I HOPE U LOVE IT I have had tons of experience on the ZIGZAG indicator and thought this might help someone. Enjoy this code. Zigzag is a good indicator in many ways and people underestimate it because of its repainting Check out some work ave done with this script. This is some intense angle trading requested by someone Pine Script® 인디케이터DevLucem의업데이트됨 4444 1.5 K
Swing Wave Helper by 2tmHello Everyone. I'd inspired from Renko Chart and make to find Waves. As you know guys, the candle make Waves and the node of Waves make 3 Points. With those 3 Points we can find where these candle go. Up? or Down. With This script you can find easily those 3 Points easily. Thank you and have a nice day.Pine Script® 인디케이터Siyeon의1171
Zig Zag Test1I've got a new idea, and I think it's possible to make countless changes.Pine Script® 인디케이터Dr-Bull의161
TurnaroundTurnaround is showing you 2EMA and price. and does they crossover or crossunderPine Script® 인디케이터lsj0305의업데이트됨 11
UPIUPINDEX is showing you that the chart is increasing or decreasingPine Script® 인디케이터lsj0305의업데이트됨 9
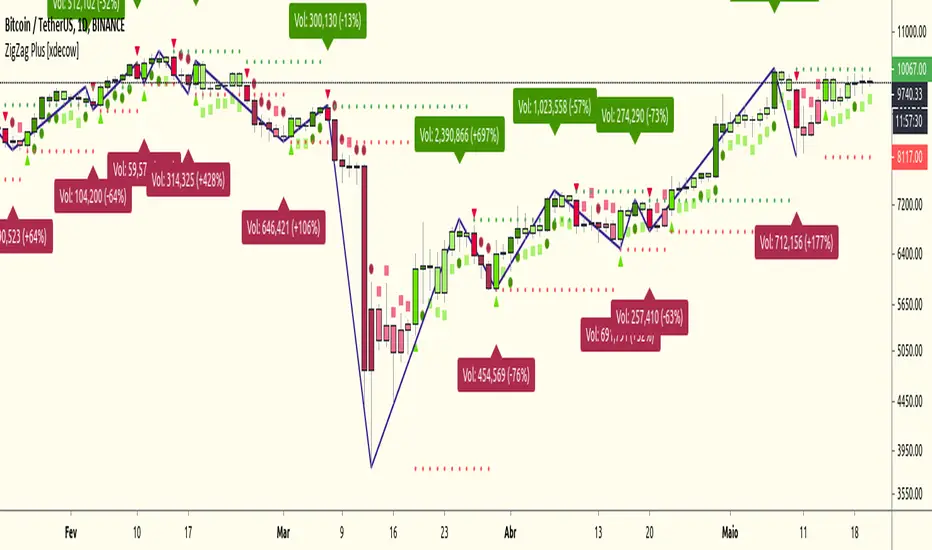
ZigZag Plus [xdecow]A ZigZag Like based on candle close. A lot of options that can be hide in options. Triangle/bright - reversal confirmation candle Circle/dark - higher/lower candle breakout Square/light - InsidebarPine Script® 인디케이터xdecow의업데이트됨 5252 3 K