INTRODUCTION:
Volatility enthusiasts, prepare for VICTORY on this day of July 4th, 2024! This is my "Vast Volatility Treasure Trove," intended mostly for educational purposes, yet these functions will also exhibit versatility when combined with other algorithms to garner statistical excellence. Once again, I am now ripping the lid off of Pandora's box... of...
About
This is a simple indicator that takes into account two types of realized volatility: Close-Close and High-Low (the latter is more useful for intraday trading).
The output of the indicator is two values / plots:
an average of High-Low volatility minus Close-Close volatility (10day period is used as a default)
the current value of the indicator
When...
The Squeeze Momentum Deluxe is a comprehensive trading toolkit built with features of momentum, volatility, and price action. This script offers a suite for both mean reversion and trend-following analysis. Developed based on the original TTM Squeeze implementation by @LazyBear, this indicator introduces several innovative components to enhance your trading...
Overview
This indicator calculates volatility using the Rule of Thumb bandwidth estimator and incorporating the standard deviations of returns to get historical volatility. There are two options: one for the original rule of thumb bandwidth estimator, and another for the modified rule of thumb estimator. This indicator comes with the bandwidth , which is shown...
What are Bandwidth Bands?
This indicator uses Silverman Rule of Thumb Bandwidth to estimate the width of bands around the rolling moving average which takes in the log transformation of price to remove most of price skewness for the rest of the volatility calculations and then a exp() function is performed to convert it back to a right skewed distribution. These...
The GARCH (Generalized Autoregressive Conditional Heteroskedasticity) model is a statistical model used to forecast the volatility of a financial asset. This model takes into account the fluctuations in volatility over time, recognizing that volatility can vary in a heteroskedastic (i.e., non-constant variance) manner and can be influenced by past events.
The...
Introduction:
💡The Squeeze & Release by AlgoAlpha is an innovative tool designed to capture price volatility dynamics using a combination of EMA-based calculations and ATR principles. This script aims to provide traders with clear visual cues to spot potential market squeezes and release scenarios. Hence it is important to note that this indicator shows...
The SuperTrend Toolkit (Super Kit) introduces a versatile approach to trend analysis by extending the application of the SuperTrend indicator to a wide array of @TradingView's built-in or Community Scripts . This tool facilitates the integration of the SuperTrend algorithm with various indicators, including oscillators, moving averages, overlays, and channels.
...
The Vix Fix indicator was created by Larry Williams and is one of my giant backlog of unpublished scripts which I'm going to start publishing more of. This indicator is a great synthetic version of the classic Volatility Index and can be useful in combination with other indicators to determine when to enter or exit a trade due to the current volatility. The...
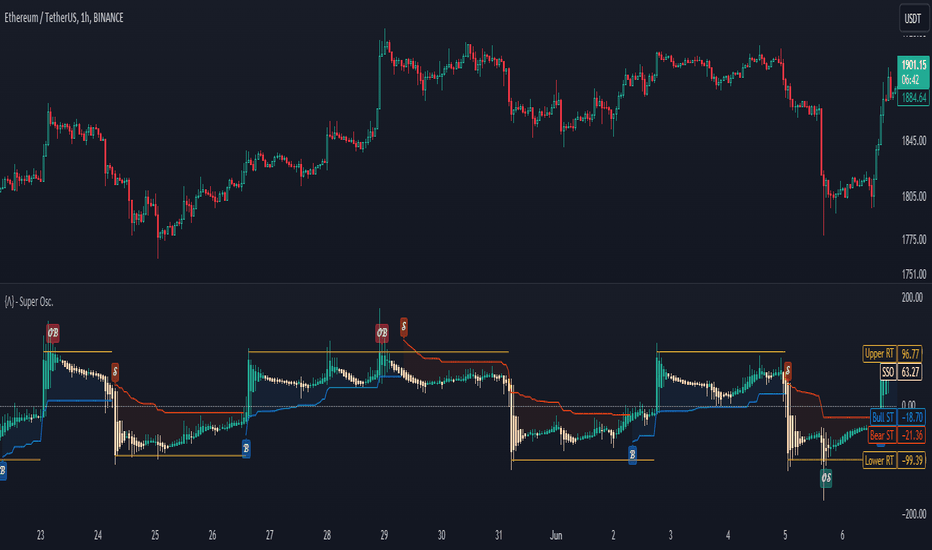
The Standardized SuperTrend Oscillator (SSO) is a versatile tool that transforms the SuperTrend indicator into an oscillator, offering both trend-following and mean reversion capabilities. It provides deeper insights into trends by standardizing the SuperTrend with respect to its upper and lower bounds, allowing traders to identify potential reversals and...
Script is designed to analize volatility in real-time.
Once added to chart, script starting to collect 2 things:
Ticks count (tc)
Price changing ticks count (pctc)
The pctc/tc ratio may be interpret as a volatility measure.
Label above real-time bar shows:
Ticks count
Price changing ticks count
Ratio between (2) and (1) in percents
Using this...
The Intraday Volatility Bands aims to provide a better alternative to ATR in the calculation of targets or reversal points.
How are they different from ATR based bands?
While ATR and other measures of volatility base their calculations on the previous bars on the chart (for example bars 1954 to 1968). The volatility used in these bands measure expected...
█ Overview
The TrendCylinder is a dynamic trading indicator designed to capture trends and volatility in an asset's price. It provides a visualization of the current trend direction and upper and lower bands that adapt to volatility changes. By using this indicator, traders can identify potential breakouts or support and resistance levels. While also gauging...
The "VWMA/SMA Delta Volatility (Statistical Anomaly Detector)" indicator is a tool designed to detect and visualize volatility in a financial market's price data. The indicator calculates the difference (delta) between two moving averages (VWMA/SMA) and uses statistical analysis to identify anomalies or extreme price movements. Here's a breakdown of its...
█ Overview
The Grid by Volatility is designed to provide a dynamic grid overlay on your price chart. This grid is calculated based on the volatility and adjusts in real-time as market conditions change. The indicator uses Standard Deviation to determine volatility and is useful for traders looking to understand price volatility patterns, determine potential...
This script produce a volatility histrogram by bar with the current volatility overlayed.
The histogram shows cumulative average volatility over n days.
And the dots are todays cumulative volatility.
In other words, it calculates the True Range of each bar and adds it to todays value.
This script is build for intraday timeframes between one and 1440 minutes...
The Bollinger Band Percentile Suite (𝐵𝐵𝒫𝒸𝓉 𝒮𝓊𝒾𝓉𝑒) is a comprehensive and customizable toolkit built upon the foundation of the %B indicator. The methodology behind this toolkit remains consistent with the original %B indicator, while introducing a host of powerful features to enhance its functionality and adaptability.
Key Features and Customization:
The 𝐵𝐵𝒫𝒸𝓉...
The ATR Delta indicator is based on the concept of Average True Range (ATR), which reflects the average price range over a specified period. By calculating the difference between current and previous ATR values, the ATR Delta provides valuable insights into volatility shifts in the market. This information can help traders identify periods of heightened or...
![SPX: [Pandora] Vast Volatility Treasure Trove](https://s3.tradingview.com/9/94GZ1QY4_mid.png "[Pandora] Vast Volatility Treasure Trove")


![GBPUSD: Squeeze & Release [AlgoAlpha]](https://s3.tradingview.com/2/2rpsjnzA_mid.png "Squeeze & Release [AlgoAlpha]")


![DIA: Williams Vix Fix [CC]](https://s3.tradingview.com/v/VpKGerjz_mid.png "Williams Vix Fix [CC]")



![EURUSD: Intraday Volatility Bands [Honestcowboy]](https://s3.tradingview.com/m/mO5Ky5mC_mid.png "Intraday Volatility Bands [Honestcowboy]")


