Vwap Stop lossThe VWAP Stop Loss indicator is a technical analysis tool that helps traders determine where to set their stop loss levels based on the Volume-Weighted Average Price ( VWAP ).
This indicator calculates the VWAP based on a specified length and multiplies it by a factor, which helps determine the distance for the stop loss levels.
When using this indicator, the red line represents the short stop loss level and the teal line represents the long stop loss level.
The lines will adjust automatically with the changing price action to ensure they always remain at the appropriate distance from the VWAP .
This indicator can be used on any time frame and for any market, making it a versatile tool for traders.
It can help you manage your risk by providing an objective method for setting stop loss levels, which can help increase the chances of successful trades.
Additionally, this indicator can also be used in combination with other technical indicators to help make more informed trading decisions.
Stoploss

Trail Blaze - (Multi Function Trailing Stop Loss) - [mutantdog]Shorter version:
As the title states, this is a 'Trailing Stop' type indicator, albeit one with a whole bunch of additional functionality, making it far more versatile and customisable than a standard trailing stop.
The main set of features includes:
Three independent trailing types each with their own +/- multipliers:
- Standard % change
- ATR (aka Supertrend)
- IQR (inter-quartile range)
These can be used in isolation or summed together. A subsequent pair of direction specific multipliers are also included.
Two separate custom source inputs are available, both feature the standard options alongside a selection of 'weighted inputs' and the option to use another indicator (selected via 'AUX'):
- 'Centre' determines the value about which the trailing sum will be added to define the stop level.
- 'Trigger' determines the value used for crossing of stops, initiating trend changes and triggering alerts.
A selection of optional filters and moving averages are available for both.
Furthermore there are various useful visualisation options available, including the underlying bands that govern the stop levels. Preset alerts for trend reversals are also included.
This is not really an 'out-of-the-box' indicator. Depending upon the market and timeframe some adjustments will be necessary for it to function in a useful manner, these can be as simple or complex as the feature-set allows. Basic settings are easy to dial in however and the default state is intended as a good starting point. Alternatively with some experimentation, a plethora of unique and creative configurations are possible, making this a great tool for tweaking. Below is a more detailed overview followed by a bunch of simple example settings.
------------------------
Lengthy Version :
DESIGN & CONCEPT
Before we start breaking this down, a little background. This started off as an attempt to improve upon the ever-popular Supertrend indicator. Of course there are many excellent user created variants available utilising some interesting methods to overcome the drawbacks of the basic version. To that end, rather than copying the work of others, the direction here shifted towards a hybrid trailing stop loss with a bunch of additional user customisation options. At some point, a completely different project involving IQR got morphed into this one. After sitting through months of sideways chop (where this proved to be of limited use), at the time of publication the market has began to form some near term trend direction and it appears to be performing well in many different timeframes.
And so with that out of the way...
INPUTS
The standard Supertrend (and most other variants) includes a single source input, as default set to 'hl2' (candle mid-range). This is the centre around which the atr bands are added/subtracted to govern the stop levels. This is not however the value which is used to trigger the trend reversal, that is usually hard-coded to 'close'. For this version both source values are adjustable: labelled 'centre' and 'trigger' respectively.
Each has custom input selectors including the usual options, a selection of 'weighted inputs' and the option to use another indicator (selected from the Aux input). The 'weighted inputs' are those introduced in Weight Gain 4000, for more details please refer to that listing. These should be treated as experimental, however may prove useful in certain configurations. In this case 'hl-oc2' can be considered an estimate of the candle median and may be a good alternative to the default 'centre' setting of 'hl2', in contrast 'cc-ohlc4' can tend to favour the extremes in the trend direction so could be useful as a faster 'trigger' than the default 'close'.
To cap them off both come with a selection of moving average filters (SMA, EMA, WMA, RMA, HMA, VWMA and a simple VWEMA - note: not elastic) aswell as median and mid-range. 'Centre' can also be set to the output of 'trigger' post-filter which can be useful if working with fast/slow crosses as the basis.
DYNAMICS
This is the main section, comprised of three separate factors: 'TSL', 'ATR' and 'IQR'. The first two should be fairly obvious, 'TSL' (trailing stop loss) is simply a percentage of the 'centre' value while 'ATR' (average true range) is the standard RMA-based version as used in Supertrend, Volatility Stop etc.
The third factor is less common however: 'IQR' (inter-quartile range). In case you are unfamiliar the principle here is, for a given dataset, the greatest 25% and smallest 25% of samples are removed. The remainder is then treated as a set and the range is calculated by highest - lowest. This is a commonly used method in statistical analysis, by removing the extremes it is less prone to influence by outliers and gives a good representation of the main dispersion around the median. In practise i have found it can be a good alternative to ATR, translating better across multiple time-frames due to it representing a fraction of the total range rather than an average of per-candle range like ATR. Used in combination with the others it can also add a factor more representative of longer-term/higher-timeframe trend. By discarding outliers it also benefits from not being impacted by brief pumps/volatility, instead responding only to more sustained changes in trend, such as rallies and parabolic moves. In order to give an accurate result the IQR is calculated using a dataset of high, low and hlcc4 values for all bars within the lookback length. Once calculated this value is then halved which, strictly speaking, makes it a semi-interquartile range.
All three of these components can be used individually or summed together to create a hybrid dynamics factor. Furthermore each multiplier can be set to both positive and negative values allowing for some interesting and creative possibilities. An optional smoothing filter can be applied to the sum, this is a basic SWMA-4 which is can reduce the impact of sudden changes but does incur a noticeable lag. Finally, a basic limiter condition has been hard-coded here to prevent the sum total from ever going below zero.
Capping off this section is a pair of direction multipliers. These simply take the prior dynamics sum and allow for further multiplication applied only to one side (uptrend/lo-stop and downtrend/hi-stop). To see why this is useful consider that markets often behave differently in each direction, we've all seen prices steadily climb over several weeks and then abruptly dump in the process of a day or two, shorter time frames are no stranger to this either. A lack of downside liquidity, a panicked market, aggressive shorts. All these things contribute to significant differences in downward price action. This function allows for tighter stops in one direction compared to the other to reflect this imbalance.
VISUALISATIONS
With all of these options and possibilities, some visual aids are useful. Beneath the dynamics' section are several visual options including both sources post-filter and the actual 'bands' created by the dynamics. These are what govern the stop levels and seeing them in full can help to better understand what our various configurations actually do. We can even hide the stop levels altogether and just use the bands, making this a kind of expanded Keltner Channel. Here we can also find colour and opacity settings for everything we've discussed.
EXAMPLES
The obvious first example here is the standard %-change trailing stop loss which, from my experience, tends to be the best suited for lower time frames. Filtering should probably minimal here. In both charts here we use the default config for source inputs, the top is a standard bi-directional setup with 1.5% tsl while the bottom uses a 2.5% tsl with the histop multiplier reduced to 0 resulting in an uptrend only stoploss.
Shown here in grey is the standard Supertrend which uses 'hl2' as centre and 'close' as trigger, ATR(10) multiplied by 3. On top we have the default filtered source config with ATR(8) multiplied by 2 which gives a different yet functionally similar result, below is the same source config instead using IQR(12) multiplied by 2. Notice here the more 'stepped' response from IQR following the central rally, holding back for a while before closing in on price and ultimately initiating reversal much sooner. Unlike ATR, the length parameter for IQR is absolute and can more significantly affect its responsiveness.
Next we focus on the visualisation options, on top we have the default source config with ATR(8) multiplied by 2 and IQR(12) multiplied by 1. Here we have activated the switch to show 'bands', from this we can see the actual summed dynamics and how it influences the stop levels. Below that we have an altogether different config utilising the included filters which are now visible. In this example we have created a basic 8/21 EMA cross and set a 1% TSL, notice the brief fakeout in the middle which ordinarily might indicate a buy signal. Here the TSL functions as an additional requirement which in this case is not met and thus no buy signal is given.
Finally we have a couple of more 'experimental' examples. On top we have Lazybear's 'Variable Moving Average' in white which has been assigned via 'aux' as the centre with no additional filtering, the default config for trigger is used here and a basic TSL of 1.5% added. It's a simple example but it shows how this can be applied to other indicators. At the bottom we return to the default source config, combining a TSL of 8% with IQR(24) multiplied by -2. Note here the negative IQR with greater length which causes the stop to close in on price following significant deviations while otherwise remaining fairly wide. Combining positive and negative multiples of each factor can yield mixed results, some more useful than others depending upon suitable market conditions.
Since this has been quite lengthy, i shall leave it there. Suffice to say that there are plenty more ways to use this besides these examples. Please feel free to share any of your own ideas in the comments below. Enjoy.

cankardesler stoploss v2This stoploss allows to filter high volatility fake trends;
But how we are made it; we are calculating the last spikes value average and calculating the standart deviation, after we added to the standart stoploss formula price+2atr and voila!!
Your stop loss is ready.
The idea behind this formula: what is explosing our stops? fake-out spikes.
We think if we get the last spikes average and calculate the standart deviation on it and after add it to the original stop formula, its gonna help for bypassing the spikes.
Thanks a lot @ocankardes for helping me to developing this formula

MATHR3E RAMP-MA█ OVERVIEW
MATHR3E RAMP-MA (R-MA) is a trend following indicator.
█ CONCEPTS
Disclaimer:
MATHR3E RAMP-MA indicator is intended for advanced traders and may fit your profile, whether you are a day trader or a long-term investor.
It was originally developed by a renowned market analyst and documented in numerous books. Among them is the author Jason Perl.
It is recommended to have read the trading techniques mentioned in the books covering this indicator beforehand.
How to use:
MATHR3E RAMP-MA is useful for determining if a market is trending and when so, to procure entry points to initiate a trade in line with the expected directional move.
It can be applied to markets as a stop-loss, as well as a low-risk entry qualifier in conjunction with other indicators of the same author.
Moving Average (R-MA I):
Only displayed when market is trending
• Bull trend: Green (moving avg Lows/Period)
• Bear trend: Red (moving avg Highs/Period)
Moving Average (R-MA II):
Always displayed
• Bullish outlook on the market: the 3-day moving average must be positioned above the 34-day moving average
• Bearish outlook on the market: the 3-day moving average must be positioned below the 34-day moving average
█ FEATURES & BENEFITS
Versatile:
This indicator is based on relative price action, so you can apply it to any market or time frame without having to change the default settings.
Rate of Change:
The ROC is calculated for the fast and slow periods of the R-MA (II).
R-MA (II) is colored blue when its rate of change is advancing and maroon when it is declining.
Breakout Qualifier:
A close above/below the moving average R-MA (I) that is confirmed by the following price bar's opening price
Materialized on chart with Flags:
• Green when bear trend ends
• Red when bull trend ends
Alerts
Get notified on:
• UpTrend breakout
• DnTrend breakout
• Any breakout Signal

Trend Movement S1-TMIdea:
This script combines: Moving Average (MA), Directional Movement (DMI), MACD
When condition of long or short position from all mentioned indicator are met script opens position. Once trend changes, it closes the position.
Then add some filter conditions to avoid noise.
Concept:
(Note that we take the close to get the closing price)
-Using only cross up down with MA will give a reversal point, but the downside is that it can be noisy.
-MACD will show the current trend detected by cross point.
-Then the +DI , -DI , ADX values are taken into account to confirm the price direction and movement strength.
-This strategy solves this problem by combining 2 more moving averages called 2 trend lines 1 long and 1 short. When the short line crosses up, it will show that the price trend is increasing (at this time the background between these 2 lines will be green) and vice versa (red). To determine if the current trend is bullish or bearish . This will avoid buying when price tend to go down.
-However, there will be many points where some more complex logic is needed. It will add conditions and calculate the probabilities before triggering the signals (You can see them through the item symbols B1, B2, ... ).
How it works:
1. The thin line is stand for short term moving average, and the thick line is stand for long term moving average.
If thin lines cross the thick lines, their color and background will turn green, the price is tend to go up (Uptrend).
If thin lines cross down thick lines, their color and background will turn red, the price is tend to go down (Downtrend).
2. Ability to check the checkbox in setting to show the Golden/De*ath cross.
The yellow symbol "+" is the Golden cross.
The black symbol "+" is the De*th cross.
3. Buy and Sell are show clearly on strategy as the buy and sell point. The default source from bar is CLOSE
4. Setting "Buy only" it using for spot market.
5. When "Not buy in down trend" is checked, it will not trigger buy when in down trend (thin lines cross down thick lines like description in 1.)
6. Setting High spread will call Close buy when it match the High spread bar with the High spread % value
7. It provides setting "Back test From date/To date" for backtest feature. You can set "BacktestFrom date" as the begin of test period. If check box "Using To Date" is check: "Backtest To Date" will be the end of test period.
Suitable time frames:
4h, 1D, 1W
* Please note that this logic does not attempt to predict future prices or 100% accurate signal; Strategy Tester are available to test the profitability of this strategy.
(INVITE ONLY indicator. Please direct message or visit website to try it out)
Hope you guys enjoy!
Examples:
BTCUSD 4H
TSLA 4H

kaptanFantastik[Take Profit and Stop Loss Finder]Hello all,
It's ATR based active take profit & stop loss finder.
You can set multipliers for taking profit and stop losing and you can change the price source for the calculation. Also, you can change the ATR level.
Defaults are my best settings. 2.2x for taking profit and 1.5x for stop losing. Open price is the source. Also, I think 5 ATR is the best for day and swing trade.
Levels are determined according to the open prices (This is because we can enter the position after our other indicators give the signal following the close price. Yet, you can change it). Since it's active and based on my calculation with ATR values, percentages for the taking profits and stop losing may change. Because of this, you need to note the take profit and stop lose prices after your entry price level is determined by the other indicators for the best success rates.
It can be used in any time frame with the other indicators to determine the best entry points. For example, 3 EMA levels with 5,8 and 13 is good option for the entry. You can enter the position when 5 crosses up 8 and both are above the 13. You can also use custom more advanced buy/sell indicators with this one for entry points.
It can be used with any asset from cryptocurrency to the stocks, from forex to gold etc.
Hint: You can set your levels lower than the take profit prices to maximize the success rate.
Note: Market should be open for the positions.
Example trade on the 5-minute timeline.
The below chart has both my custom indicator and the 3 EMAs mentioned above.
Trade 1: Entry price: 19191, Take Profit: 19276. Profit 0.44%
Trade 2: Entry price: 19189, Take Profit: 193009. Profit 0.625%
Türkçe bilen kullanıcılar için açıklama
Herkese merhabalar,
ATR tabanlı aktif kar al ve zararı durdur bulucu.
Kar almak ve zararı kesmek için çarpanlar belirleyebilir ve hesaplama için fiyat kaynağı değiştirebilirsiniz. Ayrıca, ATR seviyesini de değiştirebilirsiniz.
Varsayılanlar benim en iyi ayarlarım. Kar almak için 2,2 kat ve zararı durdurmak için 1,5 kat. Açılış, fiyat kaynağıdır. Ayrıca, 5 ATR'nin günlük ve kısa vade (swing trade) için en iyisi olduğunu düşünüyorum.
Seviyeler açılış fiyatına göre belirlenir (Çünkü diğer göstergelerimiz kapanış fiyatının ardından sinyal verdikten sonra pozisyona girebiliyoruz. Yine de bunu değiştirebilirsiniz). Aktif olduğu için ve ATR değerleri ile yaptığım hesaplamaya göre kar alma ve zarar kes yüzdeleri değişebilir. Bu nedenle, en iyi başarı oranları için; giriş fiyat seviyeniz diğer göstergeler tarafından belirlendikten sonra kar al ve zararı durdur fiyatlarını not etmeniz gerekir.
En iyi giriş noktalarını belirlemek için diğer göstergelerle herhangi bir zaman diliminde kullanılabilir. Örneğin, 5,8 ve 13 ile 3 EMA seviyesi giriş için iyi bir seçenektir. 5, 8'i geçtiğinde ve her ikisi de 13'ün üzerinde olduğunda pozisyona girebilirsiniz. Giriş noktaları için bununla birlikte daha gelişmiş özel al/sat göstergelerini de kullanabilirsiniz.
Kripto paradan hisse senetlerine, forexten altına vb. her türlü varlıkla kullanılabilir.
İpucu: Başarı oranını en üst düzeye çıkarmak için seviyelerinizi kar alma fiyatlarından daha düşük ayarlayabilirsiniz.
Not: Pozisyonlar için piyasa açık olmalıdır.
5 dakikalık zaman çizilgesinde örnek işlem.
Yukarıdaki örnek grafikte hem özel indikatörüm hem de yukrıda belirtilen 3 EMA var.
İşlem 1: Giriş fiyatı: 19191, Kazanç Al: 19276. Kar %0.44
İşlem 2: Giriş fiyatı: 19189, Kazanç Al: 193009. Kar %0.625

Average Range @coldbrewroshTaking the average daily range from low to high or high to low isn't the "best" way to get an idea of how much to set targets. So, I made this indicator to make the system better.
This indicator calculates the daily range from Open to High on Bullish Days & Open to Low on Bearish Days .
Nobody can catch the absolute low of the day on bullish days and get out at the high but one can enter at a reasonable price around the open ( 17:00 EST ) .
To complement the Average Range, another table shows the movement in the opposite direction.
For Instance: On Bullish Days how much it moved from Open to Low so that we have an idea of where to put the stop loss and vice versa. The time ranges calculated are the last 5 days, last 1 month, last 3 months & last 1 year.
Note #1: Even though the date range is predefined, it has a different meaning. For Instance: date range of last 5 days means "calculation of the range of last 5 bullish daily candles & not last 5 days" .
Note #2: Exclusive to Forex at the time of posting this.

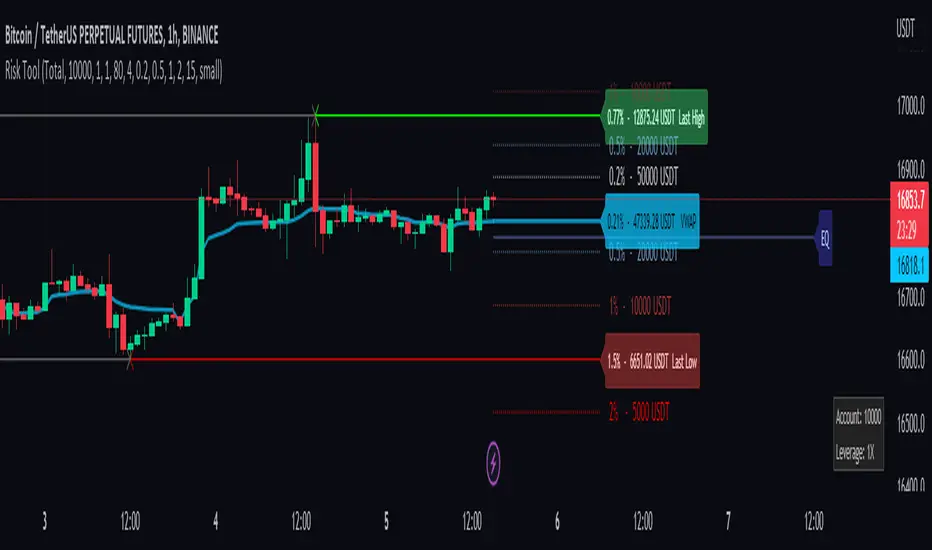
Risk Management ToolThis tool is a good way to get quick position sizing. No need to use your calculator and find that your price asset is already out of your range.
It works best with Cryptocurrencies Exchange way to manage position size calculation.
Really useful when scalping. This tool tracks the last high and low following your custom lookback bars number. It also follows the VWAP level.
You also have 4 custom ranges around the current price with the calculated position size. You set the desired percentage distance from the current price and you get the position size you need.
1. You choose the type of order
2. Account balance
3. Leverage if you use the cost base orders type
4. Amount to risk
and you get real-time risk management.
Lines and Table for risk managementABOUT THIS INDICATOR
This is a simple indicator that can help you manage the risk when you are trading, and especially if you are leverage trading. The indicator can also be used to help visualize and to find trades within a suitable or predefined trading range.
This script calculates and draws six “profit and risk lines” (levels) that show the change in percentage from the current price. The values are also shown in a table, to help you get a quick overview of risk before you trade.
ABOUT THE LINES/VALUES
This indicator draws seven percentage-lines, where the dotted line in the middle represents the current price. The other three lines on top of and below the middle line shows the different levels of change in percentage from current price (dotted line). The values are also shown in a table.
DEFAULT VALUES AND SETTINGS
By default the indicator draw lines 0.5%, 1.0%, and 1.5% from current price (step size = 0.5).
The default setting for leverage in this indicator = 1 (i.e. no leverage).
The line closest to dotted line (current price) is calculated by step size (%) * leverage (x) = % from price.
Pay attention to the %-values in the table, they represent the distance from the current price (dotted line) to where the lines are drawn.
* Be aware! If you change the leverage, the distance from the closest lines to the dotted line showing the current price increase.
SETTINGS
1. Leverage: set the leverage for what you are planning to trade on (1 = no leverage, 2 = 2 x leverage, 5 = 5 x leverage...).
2. Stepsize is used to set the distance between the lines and price.
EXAMPLES WITH DIFFERENT SETTINGS
1) Leverage = 1 (no leverage, default setting) and step size 0.5 (%). Lines plotted at (0.5%, 1%, 1.5%, and –0.5%, –1%, –1,5%) from the current price.
2) Leverage = 3 and stepsize 0.5(%). Lines plotted at (1.5%, 3.0%, 4.5%, and –1.5%, –3.0%, –4.5%) from the current price.
3) Leverage = 3 and stepsize 1(%). Lines plotted at (3%, 6%, 9%, and –3%, –6%, –9%) from the current price.
The distance to the nearest line from the current price is always calculated by the formula: Leverage * step size (%) = % to the nearest line from the current price.

TrailingStopsLibrary "TrailingStops"
This library contains functions to output trailing stop lines.
f_marketStructureStop(_restartMode, _flipMode, _restartLowIn, _restartHighIn)
Parameters:
_restartMode - Defines how the stop lines persist. Allowed values are:
"Always On" - The stop lines are always present and they just reset when they're crossed.
"Flip" - The stop lines flip when they're crossed.
"Manual" - The stop lines turn off when they're crossed, and turn back on again when _restartLowIn or _restartHighIn are passed into the function as true.
_flipMode - Defines whether the stop lines are broken by wicks or closes. Allowed values are "Wick", and "Close".
_restartLowIn - If _restartMode is "Manual", passing this parameter as true restarts the Low stop line.
_restartHighIn - If _restartMode is "Manual", passing this parameter as true restarts the High stop line.
@returns - floats for the Low and High stop line.

[-_-] Volatility Calibrated ATRDescription:
An indicator based on ATR adjusted for volatility of the market. It uses Heikin Ashi data to find short and long opportunities and displays a dynamic stop loss level. Additionally, it has alerts for when the trend changes (which is an entry signal).
How it works:
It works by dynamically calculating the Period for ATR which depends on current volatility level that is calculated by a function that uses Standard Deviation of price. ATR is then smoothed by Weighted Moving Average and multiplied by ATR Factor, resulting in a plot that changes its colour to red when we're in a downtrend and green when in an uptrend. This plot should be used as a dynamic Stop Loss level. Trend change is determined by price crossing the dynamic Stop Loss level. The squared red and green labels appear when the trend changes, and should be used as Entry signals.
Parameters:
- Source -> data used for calculations
- ATR Factor -> higher values produce less noise and longer trends, lower values give more signals

Position Size and PNL CalculatorPosition Size and PNL Calculator is a Tool indicator which will help trader determine Trading's Position Size base on many risk management method such is Risk Per Trade, Fix Position Size, Fix Initial cost. The stoploss of the order will be set after ATR Stoploss method like my lasted Indicator ATR Stop Loss and Take Profit Finder .
This Tool is using the concept of
- ATR ( Average True Range )
- Risk Reward Ratio (Money Management method)
- Leverage Position Size Calculation
- Leverage PNL Calculation
- Risk Per Trade money management for calculating the size of position base on Account Balance and Risk
How Position Size and PNL Calculator working?
1) The tool will let user Input time and price that trader are entering the order. Then trader have to select the direction of trade, weather it is long position or short position
2) Next It will use entry price to Calculate the Stoploss price buy Calculating its ATR according to the setting then, then The entry price will be plus/mins by ATR*Multiply to get a Stoploss price
3) then we will * Risk Reward Ratio to the distance of stoploss in order to create Takeprofit price
4) After then the tool will simulate and calculate Initial cost/Initial position size base on your setting, and will display Stoploss Price, Take Profit Price, PNL% of Loss if Stoploss is trigger, PNL% of Gain if Take profit is Trigger and current RR/ PNL%
5) User can adjust the leverage and other setting in Indicator setting
How to use Position Size and PNL Calculator
As it was mention, Position Size and PNL Calculator is just a tool that help trader determine Trading's Position Size, PNL and risk management. Trader must use this tool only as a Position Tracking after you help entry order with your our trading strategy

Entry helperHello traders,
This is a script I use daily as a scalper and it helps me a lot, maybe it can help you, this is why I am sharing it!
PART 1 - DESCRIPTION
This program is specifically designed to help scalpers but can be used for all types of trading but won't be as useful.
This script is what I call an entry helper as it calculates dynamically the position size, stop loss and take profit levels and more.
When scalping and placing market entry orders, the price can move significantely while you are calculating your position size according to your stop loss, capital, risk and especially close price that changes very quickly, this results in a risk that is not ideally controlled and personally was a source of frustration and stress. I wanted to enter my quantity and stop loss values as fast as possible and make the process easier.
This script automates the calculation of the position size, stop loss and take profit levels according the the users input and prints the data visibly on the screen so it is easy to copy by the trader. It allows the trader to be confident that his risk is as controlled as possible.
The script is easy to use and set up, this guide will help you if you have any difficulies or questions.
PART 2 - HOW TO USE THE SCRIPT
- SET THE CAPITAL SETTINGS
1 - Set your capital value in $
- SET THE TRADE SETTINGS
2 - Set your trade side (BUY or SELL)
3 - Set you desired risk in % of your capital
- ENTRY SETTINGS
4 - Set your entry from 2 different options
|MARKET| (default option)
This option will place the entry level at the last available price
|LIMIT|
This option allows you to input a fixed price level for the entry
- STOP LOSS SETTINGS
5 - Select your stop loss placement from 4 different options
|EXTREMA STOP LOSS| (default option)
This option will place the stop loss at the highest/lowest (extrema) price level within the last N candles
|ATR EXTREMA|
This option uses the same price level as the EXTREMA STOP LOSS but will add/soustract the last ATR value (calculated on the N last candles) multiplied by a coefficient that you input
|TICKS EXTREMA|
This option uses the same price level as the EXTREMA STOP LOSS but will add/soustract a number of ticks that you input
|PRICE LEVEL|
This option allows you to input a fixed price level for the stop loss
- TAKE PROFIT SETTINGS
6 - Select your take profit from 3 different options
|NONE| (default option)
This option will not display any take profit level, I have added this option as I don't have take profit targets
|RR|
This option uses a risk to reward ratio (reward/risk) that you input, it will automatically calculate the take profit level that corresponds
|PRICE LEVEL|
This option allows you to input a fixed price level for the take profit
- QUANTITY AND FEE SETTINGS
7 - Set the quantity settings, it represents the quantity in a lot (usually 100 000 in forex, 100 in stocks 1 for crypto currencies)
8 - Set the fee per quantity (turning lot)
- VISUAL SETTINGS
9 - Show or remove the tab
- TAB SETTINGS
10 - Select the data that you want to display in the tab (the tab will adapt automatically)
NOTES:
The vertical dashed line shows what candle has been used for the calculation of the stop loss, it allows you to visualize what candle the script has selected in case of an EXTREMA stop loss option.
I hope this helps you out! Any suggestions are welcome and I hope that the guide is clear enough.
Happy trading!

Bollinger Band strategy with split, limit, stopEntering a short position after breaking the upper Bollinger Band, entering a long position when entering after breaking the lower Bollinger Band
Provides templates for how to display position average price, stop loss, and profit price using the plot function on the chart, and how to buy splits
After entering the position, if the price crosses the mid-band line, the stop loss is adjusted to the mid-band line.

Interactive SAR Stop-Loss [TANHEF]This indicator is "Interactive" which means some inputs can are manually added through the first click after adding the indicator to the chart (SAR Trailing Stop-loss start point).
Unlike the normal Parabolic SAR, this indicator allows for the modification of the start point of the Parabolic SAR’s first bar calculation. Normally, the Parabolic SAR automatically has a start point after the first bar of an asset’s historical price that will then switch between trailing above and below price respectively. It must be noted that due to how the first position of the Parabolic SAR is calculated, on occasion the Parabolic SAR will immediately flip on the next bar to the opposite side relative to price that it was just located. Modifying the setting “⭐Initial Interactive SAR Position Source”, then selecting either 'Clicked' or 'ATR' level as the vertical start position will prevent this. See images below for more explanation.
Why use a trailing stop-loss?
A trailing stop-loss provides an exit when price moves against you but also enables you to move the exit point further into profit when price is moving in the desired direction of a trade. The Parabolic SAR ( stop and reverse ) which is used to determine price direction as well as when price direction is changing, is very effective at functioning as a trailing stop loss.
Indicator Explanation
Initially when this indicator is added to the chart, you will be prompted to select where to begin the SAR Trailing Stop-loss.
For a long stop-loss, select below price.
For a short stop-loss, select above price.
After this indicator is placed, it can be modified via dragging or from within the settings by modifying the time and the price input. Or simply re-add the indicator to the chart. Another option is to have this Parabolic SAR begin directly on the price that was initially ‘Clicked’ or the ‘ATR’ level, which requires selecting the option in settings labeled “⭐Initial Interactive SAR Position Source”
The SAR Stop Loss plotted. Note that the calculation that occurs on this first bar of the ‘Interactive SAR’ is as if the prior bar was the oldest historical bar of the asset. Due to the SAR’s calculations, if the ‘Normal SAR’ were to also flip sides over to the position that has been manually set for the ‘Interactive SAR’, they won’t necessarily have the same result.
An optional fixed profit target can be added within the settings. This profit target will only actively be plotted when the SAR Trailing Stop-loss has not be hit yet or until the profit target has been hit.
Here shows that the profit target was hit, then later on the SAR Trailing Stop-loss was hit.
Note, trailing stop-loss will continue to be plotted until it has been hit regardless of the profit target being hit or not.
Here is an example of when the Parabolic SAR will immediately flip on the next bar to the opposite side relative to price that it was just first located. This is due to how the Parabolic SAR is calculated and will also occur with the traditional Parabolic SAR that is not interactively (manually) given a start location. To prevent this, either relocate this time in which this SAR beings or consider modifying the SAR’s (start, increment, max) settings specifically.
Here instead of using the SAR’s calculation for an initial bar, the ‘ATR’ was selected as the start point within the setting “⭐Initial Interactive SAR Position Source”.
Alerts
1. 'Check' alerts to use within indicator settings (trailing stop hit and/or profit target hit).
2. Select 'Create Alert'
3. Set the condition to 'Interactive SAR''
4. Select create.

FFT Strategy Bi-Directional Stop/Profit/Trailing + VMA + AroonThis strategy uses the Fast Fourier Transform inspired from the source code of @tbiktag for the Fast Fourier Transform & @lazybear for the VMA filter.
If you are not familiar with the Fast Fourier transform it is a variation of the Discrete Fourier Transform. Veritasium on youtube has a great video on it with a follow up recommendation from 3brown1blue. In short it will extract all the frequencies from a set of data. @tbiktag laid the groundwork for creating the indicator which will allow you to isolate only those signals which are the most relevant and remove the noise. I recommend having @tbiktag's FFT Transform indicator side by side with this to understand what my variation is doing by setting similar settings .
Using this idea, you can then optimize a strategy to the frequencies that are best. The main entry signal is when the FFT Signal crosses above or below the 0 line .
Included with this strategy is the ability to optionally bi-directionally set:
Stop Loss
Trailing Stop Loss
Take Profit
Trailing Take Profit
Entries are optionally further filtered by use of the VMA using the algorithm from LazyBear which allows you to adjust a variable moving average with 3 market trend detections. Green represents upwards momentum; Blue sideways trading and Red downwards momentum. The idea being to filter out buy or sell entries unless the market is moving in that direction, and this makes a big difference as you can see for yourself when you turn it off or on. Turning it off will change the color of the FFT signal to orange instead of the green, blue, red colors .
I have added 2 custom stop loss types as well for experimentation:
1. VMA Filter stop loss to exit the trade if the VMA detects a market trend direction change matching the rules you have set. I have set this to off by default, but it is there so you can see what affect it may have on other tickers. It can increase the profit factor but usually at a cost of net profit.
2. The Aroon Filter stop loss with different lengths for the short or long direction. For the Aroon strategy (which is a trend change detector) it is considered bullish if the upper line (green in my code) is above 70 and the lower line (red in my code) is below 30 and the opposite for the bearish case. With this in mind, I have set it to filter by default only the extreme ends (99 and 1) to increase profit factor and net profit but I encourage you to try different settings and see how it affects things. Turning this off yields much higher net profit but at the cost of the profit factor and drawdown . To disable this just uncheck the 'Use Aroon Filter Long' (or short) and it will also hide the aroon graphics and crosses on the plot.
I will be adding more features in an attempt to lower the drawdown on this strategy but I hope you enjoy what I have so far!

Anti-trap Trailing Stop Loss by KalyanBetaAnti-trap Trailing Stop Loss by KalyanBeta or ATSL
ATSL changes color when there it identifies price manipulation/ SL Hunting / Traps by Smart Money.
Change in color may be an exit signal for your trade in current direction.
This is a very simple indicator which can be used to predict Traps or Stop-loss hunting.
This can help in Trailing Stop-loss and in Exit decisions along with your own strategy.
ATSL may be used in all timeframes.
Please back-test it along with your strategy and then use it for Trailing the Stop-loss without getting trapped by operators and stop-loss hunters.
All the best.
Do post your feedback in comments below. Thank you.
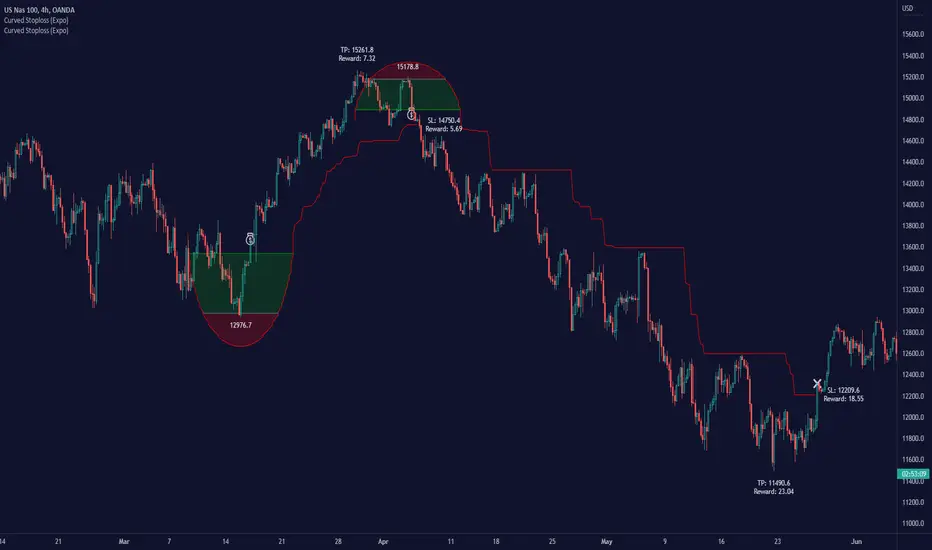
Curved Stop Loss (Expo)█ Overview
Curved Stop Loss (Expo) automatically calculates the best stop-loss distance based on real-time momentum and volatility. Once the algorithm has analyzed the current market characteristics, a curved stop loss is placed on the chart. As a result, the trader can be confident that the stop loss is based on data insights. One of the key elements of a curved stop loss is that it ensures that the trade can either be stopped with a profit or only with a minor loss without compromising the profit potential. Hence, using the Curved Stop Loss makes a massive difference in the overall results.
█ Why is this tool needed?
Risk management is a key concept to grasp and use in your trading, and it's one of the most critical aspects that will determine your long-term success in this industry. The market is uncertain, and it's impossible to know what the future holds. The only way to take control of the unknown is to have a proper risk management system that ensures you don't blow your account in one trade. Therefore, all traders need to understand the importance of using a risk- and money-management tool that calculates and provides stop-loss and take-profit levels in real-time. This way, you will always know where to take your stop loss and secure profit.
█ How to use
This Curved Stop Loss helps traders set a stop loss based on current momentum and volatility. It can be used to minimize your risk and maximize your profit potential.
-----------------
Disclaimer
The information contained in my Scripts/Indicators/Ideas/Algos/Systems does not constitute financial advice or a solicitation to buy or sell any securities of any type. I will not accept liability for any loss or damage, including without limitation any loss of profit, which may arise directly or indirectly from the use of or reliance on such information.
All investments involve risk, and the past performance of a security, industry, sector, market, financial product, trading strategy, backtest, or individual's trading does not guarantee future results or returns. Investors are fully responsible for any investment decisions they make. Such decisions should be based solely on an evaluation of their financial circumstances, investment objectives, risk tolerance, and liquidity needs.
My Scripts/Indicators/Ideas/Algos/Systems are only for educational purposes!
Interactive ATR Stop-Loss [TANHEF]This indicator is "Interactive" which means some inputs can are manually added through the first click after adding the indicator to the chart (ATR Trailing Stop-loss start point). See images below for more explanation.
Why use a trailing stop-loss?
A trailing stop-loss provides an exit when price moves against you but also enables you to move the exit point further into profit when price is moving in the desired direction of a trade. The ATR (Average True Range) which is used to measure volatility, is very effective at functioning as a trailing stop loss.
Indicator Explanation
Initially when this indicator is added to the chart, you will be prompted to select where to begin the ATR Trailing Stop-loss.
For a long stop-loss, select below price.
For a short stop-loss, select above price.
After this indicator is placed, it can be modified via dragging or from within the settings by modifying the time and the price input. Or simply re-add the indicator to the chart.
The ATR Stop Loss plotted. Note that the trailing value that is considered as the stop loss value is the value of the ATR from the prior candle. The settings for the ATR calculation can be modified within the settings.
An optional fixed profit target can be added within the settings. This profit target will only actively be plotted when the ATR Trailing Stop-loss has not be hit hit yet or until the profit target has been hit.
Here shows that the profit target was hit, then later on the ATR Trailing Stop-loss was hit.
Note, trailing stop-loss will continue to be plotted until it has been hit regardless of the profit target being hit or not.
Alerts
1. 'Check' alerts to use within indicator settings (trailing stop hit and/or profit target hit).
2. Select 'Create Alert'
3. Set the condition to 'Interactive ATR''
4. Select create.

[D] Dudu 95 Strategy Template ver.1.1.Hello Guys! Nice to meet you all!
This is my Second script after changing My Profile Name!
I updated my strategy template before - I added some filter conditions (EMA, ADX, DMI).
If there's something to update, I will update this script!
Thank you!
-----
I made this based on the open source strategies by jason5480, kevinmck100, myncrypto.
Thank you All!
### Filter
1. Can Choose whether to use filter.
2. Filters Based on ATR, EMA, ADX, and DMI are ready to use.
### StopLoss
1. Can Choose Stop Loss Type: Percent, ATR, Previous Low / High.
2. Can Chosse inputs of each Stop Loss Type.
### Take Profit
1. Can set Risk Reward Ratio for Take Profit.
- To simplify backtest, I erased all other options except RR Ratio.
- You can add Take Profit Logic by adding options in the code.
2. Can set Take Profit Quantity.
### Risk Manangement
1. Can choose whether to use Risk Manangement Logic.
- This controls the Quantity of the Entry.
- e.g. If you want to take 3% risk per trade and stop loss price is 6% below the long entry price,
then 50% of your equity will be used for trade.
2. Can choose How much risk you would take per trade.
### Plot
1. Added Labels to check the data of entry / exit positions.
2. Changed and Added color different from the original one. (green: #02732A, red: #D92332, yellow: #F2E313)

[fpemehd] Strategy TemplateHello Guys! Nice to meet you all!
This is my fourth script!
This is the Strategy Template for traders who wants to make their own strategy.
I made this based on the open source strategies by jason5480, kevinmck100, myncrypto. Thank you All!
### StopLoss
1. Can Choose Stop Loss Type: Percent, ATR, Previous Low / High.
2. Can Chosse inputs of each Stop Loss Type.
### Take Profit
1. Can set Risk Reward Ratio for Take Profit.
- To simplify backtest, I erased all other options except RR Ratio.
- You can add Take Profit Logic by adding options in the code.
2. Can set Take Profit Quantity.
### Risk Manangement
1. Can choose whether to use Risk Manangement Logic.
- This controls the Quantity of the Entry.
- e.g. If you want to take 3% risk per trade and stop loss price is 6% below the long entry price,
then 50% of your equity will be used for trade.
2. Can choose How much risk you would take per trade.
### Plot
1. Added Labels to check the data of entry / exit positions.
2. Changed and Added color different from the original one. (green: #02732A, red: #D92332, yellow: #F2E313)

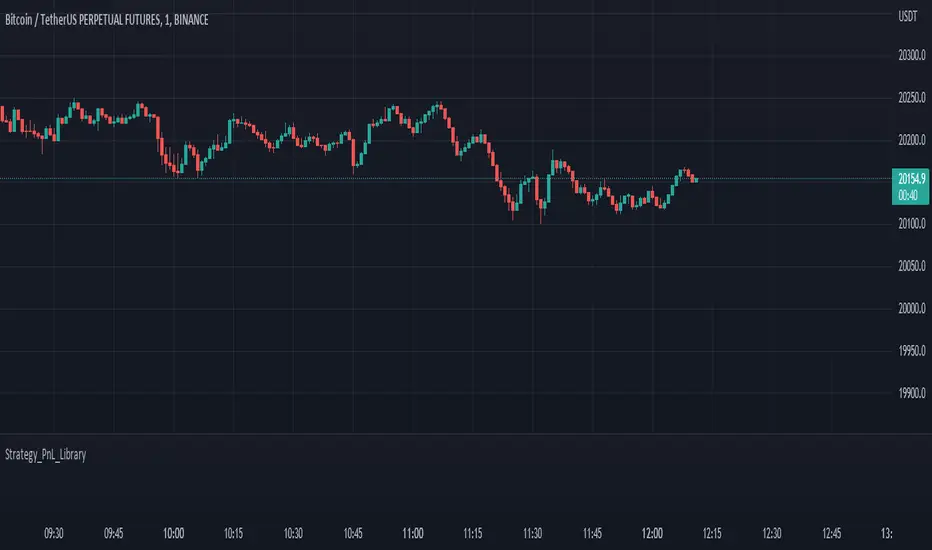
Strategy PnL LibraryLibrary "Strategy_PnL_Library"
TODO: This is a library that helps you learn current pnl of open position and use it to create your own dynamic take profit or stop loss rules based on current level of your profit. It should only be used with strategies.
inTrade()
inTrade: Checks if a position is currently open.
Returns: bool: true for yes, false for no.
notInTrade()
inTrade: Checks if a position is currently open. Interchangeable with inTrade but just here for simple semantics.
Returns: bool: true for yes, false for no.
pnl()
pnl: Calculates current profit or loss of position after the commission. If the strategy is not in trade it will always return na.
Returns: float: Current Profit or Loss of position, positive values for profit, negative values for loss.
entryBars()
entryBars: Checks how many bars it's been since the entry of the position.
Returns: int: Returns a int of strategy entry bars back. Minimum value is always corrected to 1 to avoid lookback errors.
pnlvelocity()
pnlvelocity: Calculates the velocity of pnl by following the change in open profit compared to previous bar. If the strategy is not in trade it will always return na.
Returns: float: Returns a float value of pnl velocity.
pnlacc()
pnlacc: Calculates the acceleration of pnl by following the change in profit velocity compared to previous bar. If the strategy is not in trade it will always return na.
Returns: float: Returns a float value of pnl acceleration.
pnljerk()
pnljerk: Calculates the jerk of pnl by following the change in profit acceleration compared to previous bar. If the strategy is not in trade it will always return na.
Returns: float: Returns a float value of pnl jerk.
pnlhigh()
pnlhigh: Calculates the highest value the pnl has reached since the start of the current position. If the strategy is not in trade it will always return na.
Returns: float: Returns a float highest value the pnl has reached.
pnllow()
pnllow: Calculates the lowest value the pnl has reached since the start of the current position. If the strategy is not in trade it will always return na.
Returns: float: Returns a float lowest value the pnl has reached.
pnldev()
pnldev: Calculates the deviance of the pnl since the start of the current position. If the strategy is not in trade it will always return na.
Returns: float: Returns a float deviance value of the pnl.
pnlvar()
pnlvar: Calculates the variance value of the pnl since the start of the current position. If the strategy is not in trade it will always return na.
Returns: float: Returns a float variance value of the pnl.
pnlstdev()
pnlstdev: Calculates the stdev value of the pnl since the start of the current position. If the strategy is not in trade it will always return na.
Returns: float: Returns a float stdev value of the pnl.
pnlmedian()
pnlmedian: Calculates the median value of the pnl since the start of the current position. If the strategy is not in trade it will always return na.
Returns: float: Returns a float median value of the pnl.
Moving Grid Trader - With AlertsThis script used a grid system that is set when a "buy" signal is sent to generate profits inside of a range. This script used macd to weed out bad buys and then sells once the price either reaches the grid - or hits the stoploss. This works best in bullish and ranging markets.
