ZVOL — Z-Score Volume Heatmapⓩ ZVOL transforms raw volume into a statistically calibrated heatmap using Z-score thresholds. Unlike classic volume indicators that rely on fixed MA comparisons, ZVOL calculates how many standard deviations each volume bar deviates from its mean. This makes the reading adaptive across timeframes and assets, in order to distinguish meaningful crowd behavior from random volatility.
📊 The core display is a five-zone histogram, each encoded by color and statistical depth. Optional background shading mirrors these zones across the entire pane, revealing subtle compression or structural rhythm shifts across time. By grounding the volume reading in volatility-adjusted context, ZVOL inhibits impulsive trading tactics by compelling the structure, not the sentiment, to dictate the signal.
🥵 Heatmap Coloration:
🌚 Suppressed volume — congestion, coiling phases
🩱 Stable flow — early trend or resting volume
🏀 High activity — emerging pressure
💔 Extreme — possible climax or institutional print
🎗️ A dynamic Fibonacci-based 21:34-period EMA ribbon overlays the histogram. The fill area inverts color on crossover, providing a real-time read on tempo, expansion, or divergence between price structure and crowd effort.
💡 LTF Usage Suggestions:
• Confirm breakout legs when orange or red zones align with range exits
• Fade overextended moves when red bars appear into resistance
• Watch for rising EMAs and orange volume to front-run impulsive moves
• Combine with volatility suppression (e.g. ATR) to catch compression → expansion transitions
🥂 Ideal Pairings:
• OBVX Conviction Bias — to confirm directional intent behind volume shifts
• SUPeR TReND 2.718 — for directional filters
• ATR Turbulence Ribbon — to detect compression phases
👥 The OBVX Conviction Bias adds a second dimension to ZVOL by revealing whether crowd effort is aligning with price direction or diverging beneath the surface. While ZVOL identifies statistical anomalies in raw volume, OBVX tracks directional commitment using cumulative volume and moving average cross logic. Use them together to spot fake-outs, anticipate structure-confirmed breakouts, or time pullbacks with volume-based conviction.
🔬 ZVOL isn’t just a volume filter — it’s a structural lens. It reveals when crowd effort is meaningful, when it's fading, and when something is about to shift. Designed for structure-aware traders who care about context, not noise.
Standard

STANDARD DEVIATION INDICATOR BY WISE TRADERWISE TRADER STANDARD DEVIATION SETUP: The Ultimate Volatility and Trend Analysis Tool
Unlock the power of STANDARD DEVIATIONS like never before with the this indicator, a versatile and comprehensive tool designed for traders who seek deeper insights into market volatility, trend strength, and price action. This advanced indicator simultaneously plots three sets of customizable Deviations, each with unique settings for moving average types, standard deviations, and periods. Whether you’re a swing trader, day trader, or long-term investor, the STANDARD DEVIATION indicator provides a dynamic way to spot potential reversals, breakouts, and trend-following opportunities.
Key Features:
STANDARD DEVIATIONS Configuration : Monitor three different Bollinger Bands at the same time, allowing for multi-timeframe analysis within a single chart.
Customizable Moving Average Types: Choose from SMA, EMA, SMMA (RMA), WMA, and VWMA to calculate the basis of each band according to your preferred method.
Dynamic Standard Deviations: Set different standard deviation multipliers for each band to fine-tune sensitivity for various market conditions.
Visual Clarity: Color-coded bands with adjustable thicknesses provide a clear view of upper and lower boundaries, along with fill backgrounds to highlight price ranges effectively.
Enhanced Trend Detection: Identify potential trend continuation, consolidation, or reversal zones based on the position and interaction of price with the three bands.
Offset Adjustment: Shift the bands forward or backward to analyze future or past price movements more effectively.
Why Use Triple STANDARD DEVIATIONS ?
STANDARD DEVIATIONS are a popular choice among traders for measuring volatility and anticipating potential price movements. This indicator takes STANDARD DEVIATIONS to the next level by allowing you to customize and analyze three distinct bands simultaneously, providing an unparalleled view of market dynamics. Use it to:
Spot Volatility Expansion and Contraction: Track periods of high and low volatility as prices move toward or away from the bands.
Identify Overbought or Oversold Conditions: Monitor when prices reach extreme levels compared to historical volatility to gauge potential reversal points.
Validate Breakouts: Confirm the strength of a breakout when prices move beyond the outer bands.
Optimize Risk Management: Enhance your strategy's risk-reward ratio by dynamically adjusting stop-loss and take-profit levels based on band positions.
Ideal For:
Forex, Stocks, Cryptocurrencies, and Commodities Traders looking to enhance their technical analysis.
Scalpers and Day Traders who need rapid insights into market conditions.
Swing Traders and Long-Term Investors seeking to confirm entry and exit points.
Trend Followers and Mean Reversion Traders interested in combining both strategies for maximum profitability.
Harness the full potential of STANDARD DEVIATIONS with this multi-dimensional approach. The "STANDARD DEVIATIONS " indicator by WISE TRADER will become an essential part of your trading arsenal, helping you make more informed decisions, reduce risks, and seize profitable opportunities.
Who is WISE TRADER ?
Wise Trader is a highly skilled trader who launched his channel in 2020 during the COVID-19 pandemic, quickly building a loyal following. With thousands of paid subscribed members and over 70,000 YouTube subscribers, Wise Trader has become a trusted authority in the trading world. He is known for his ability to navigate significant events, such as the Indian elections and stock market crashes, providing his audience with valuable insights into market movements and volatility. With a deep understanding of macroeconomics and its correlation to global stock markets, Wise Trader shares informed strategies that help traders make better decisions. His content covers technical analysis, trading setups, economic indicators, and market trends, offering a comprehensive approach to understanding financial markets. The channel serves as a go-to resource for traders who want to enhance their skills and stay informed about key market developments.

Range Deviations @joshuuuThis indicator is able to show ranges, the equlibrium (50%) and range deviations.
It has four pre-defined options and one custom version.
Asia (2000-0000) ny time
CBDR(1400-2000) ny time
Flout(1400-0000) ny time
ONS (OverNightSession)(0400-0800) chicago time
Custom (you can choose the times)
ICT (Inner Circle Traders) teaches, that those range deviations of asia,cbdr,flout can be used to find the daily high/low.
TCM (The Currency Merchant) teaches, that a move out of the range often is a false move to trap traders into the wrong direction.

Click VWAP Anchored with Standard Devation BandsSimply use it by clicking on your chart on the places you find important to determine whether you entries or exits look strong or weak.

Probability Cloud BASIC [@AndorraInvestor]🔮☁️
This is the BASIC version of the PROBABILITY CLOUD indicator.
It is an evolution beyond traditional standard deviation probabilistic indicators only using bands or channels.
The new PROBABILITY CLOUD graphic representation with customizable transparent layers is based on -2 / +2 standard deviation calculated using 20 fixed predetermined time periods, and is available in several calculation MODES:
SMA , EMA , WMA , VWMA , VWMA & VAWMA
The indicator is designed to let the trader visually understand the probabilistic depth of past, present and future price action, and its evolution over time.
Looking forward to your comments and feedback to guide me on future updates!
🙏 Big THANKS @Electrified for letting me use his work on Deviation Bands/ as a starting point for my first script.

Standard deviation channel of linear regression distance [AbAh]The indicator calculates the distance between linear regression line and the data point (price) as a percentage , then calculates the standard deviation for the linear regression distance , then draw the channel of two lines depending on the values of standard deviation .
///////// How to use ////////////////
1 - for Best result , indicator should be used on 2H frame Time of less : like 1H or 30 min
2 - The upper line and the lower line, both play a role as a support and resistance area, when the price bounces from the upper zone or lower zone, there is a high probability that it will move to the other line.
3 - The price breakout of one of the lower or upper lines may indicate a major price movement coming in the direction of the breakout
/////////////////////////////////////
Weighted Standard Deviation BandsLinearly weighted standard deviations over linearly weighted mean.
The rationale of the study can be deduced from my latest publications where I go deeper into explaining the benefits of linear weighting, but in short, I can remind that by using linear weighting we are able to increase the information gain by communicating the sequential nature of time series to the calculations via linear weighting.
Note, that multiplier parameters can take both negative and positive values resulting in ability to have, for example, 1st and 6th weighted standard deviations higher than the weighted mean.
Despite the modification of the classic standard deviation formula, I assume that mathematical qualities of standard deviation will hold due to the fact we can alternately weight the window itself, and then apply the classic standard deviation over the weighted window. In both cases, the results will be the same.
Aight that was too formal, but your short strangles should be happy
Here is it, for you

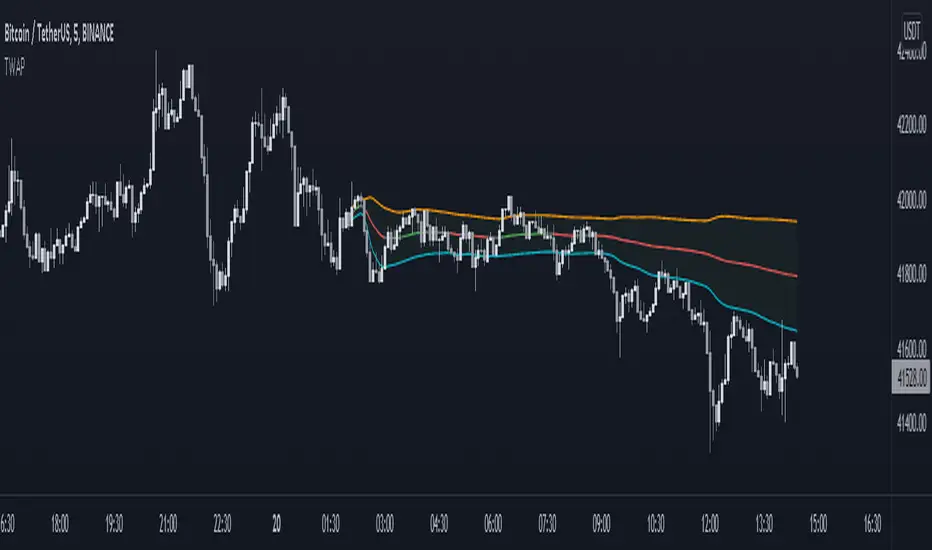
Anchored TWAP with StDev Bands [MrShadow]TWAP with:
- Anchoring: Custom, Day, Week, Month, Quarter, Year (custom anchoring can be selected by dragging a vertical line through the chart)
- Standard Devation Bands
- Auto-coloring depending on the trend
Probability ConesA probability cone is an indicator that forecasts a statistical distribution from a set point in time into the future.
Features
Forecast a Standard or Laplace distribution.
Change the how many bars the cones will lookback and sample in their calculations.
Set how many bars to forecast the cones.
Let the cones follow price from a set number of bars back.
Anchor the cones and they will not update from their last location.
Show or hide any set of cones.
Change the deviation used of any cone's upper or lower line.
Change any line's color, style, or width.
Change or toggle the fill colors between any two cone lines.
Basic Interpretations
First, there is an assumption that the distribution starting from the cone's origin, based on the number of historical bars sampled, is likely to represent the distribution of future price.
Price typically hangs around the mean.
About 68% of price stays within the first deviation cones.
About 95% of price stays within the second deviation cones.
About 99.7% of price stays within the third deviation cones.
When price is between the first and second deviation cones, there is a higher probability for a reversal.
However, strong momentum while above or below the first deviation can indicate a trend where price maintains itself past the first deviation. For this reason it's recommended to use a momentum indicator alongside the cones.
There is no mean reversion assumption when price deviates. Price can continue to stay deviated.
It's recommended that the cones are placed at the beginning of calendar periods. Like the month, week, or day.
Be mindful when using the cones on various timeframes. As the lookback setting, which selects the number of bars back to load from the cone's origin, will load the number of bars back based on the current timeframe.
Second Deviation Strategy
How to react when price goes beyond the second deviation is contingent on your trading position.
If you are holding a losing trade and price has moved past the second deviation, it could be time to stop trading and exit.
If you are holding a winning trade and price has moved past the second deviation, it would be best to look at exit strategies to capitalize on the outperformance.
If price has moved beyond the second deviation and you hold no position, then do not open any new trades.

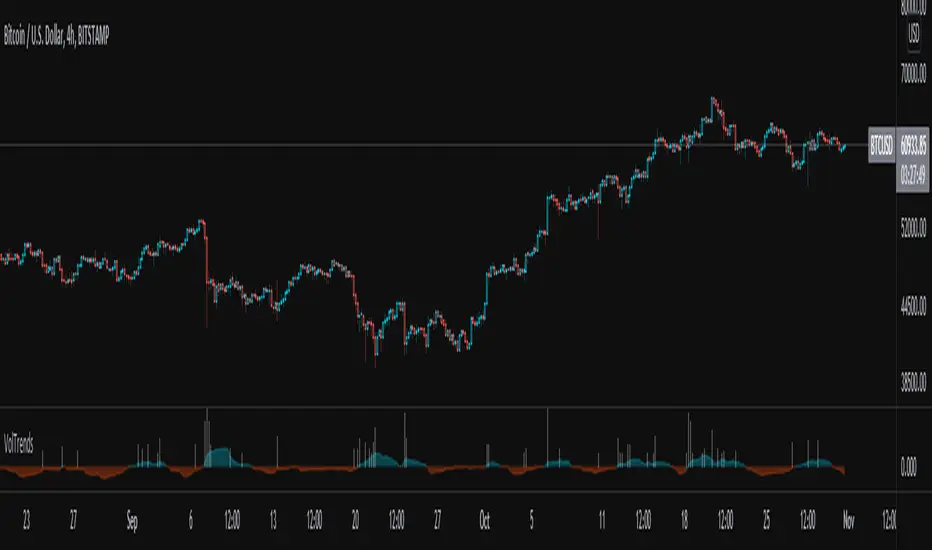
Volume TrendsThis script provides clear volume trends on any time frame. You set a long term volume trend moving average (ex 100 periods). A shorter term MA of your choice (10 in this example) will oscillate above and below based on the standard deviations of its current value relative to the long term #.
Similarly, large volume bars are plotted in terms of st dev above the long term MA.
Very useful in spotting capitulation bottoms and/or blow-off tops.
Tradingview ToolkitA new trader's biggest barrier to entry is lack of understanding where they are in terms of time and price and with tradingview free they are often limited to just 1 or 2 extra indicators as many new traders slap on RSI and MACD as 2/3 free ones. While these indicators are fine for trend analysis, its important to know where the price is in relation to time. Thus, this all-in-one script is meant to have a lot of customizable utility to save on indicator spots and act as a hotspot for many common needs.
-2 Sets of VWAP line w/ standard deviation bands with customizable timeframes.
-1 more customizable timeframe VWAP line (no std dev bands) to use as a long time frame reference
-Ability to plot previous VWAP close prices over current timeframe on all VWAP lines w/ basic color changing if price closes above/below
-2 Sets of Bollinger Bands with customizable source length and MA type
-3 customizable moving averages with custom timeframe/resolutions
-Inside candle barcolor repainter to easily notice if a candle was inside the range of the previous candle (price contraction)
Not meant to have everything on at once, but simply a place to enable and disable different things and save spots for more important things

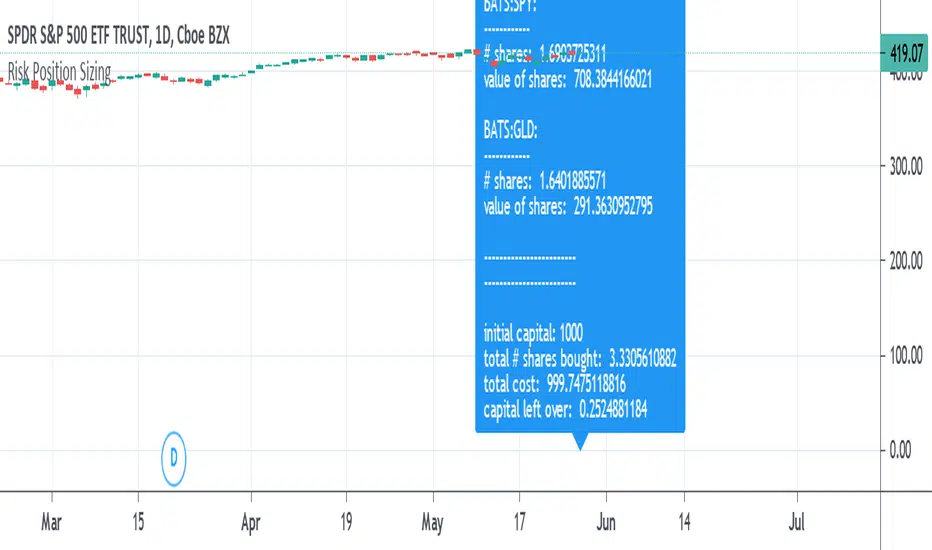
Risk Position Sizing tool using Coefficient of VariationA way to manage portfolio risk using relative standard deviation, also known as coefficient of variation. This tool tells you how much of each stock in shares and in value to buy adjusted for their volatility risk for a given starting account capital. A problem many people have is how to diversify an account and adjusting it for the risk involved in each equity. Many would put in an equal amount of capital value into each share but is it really equal if some equities have more risk than others? A solution is to adjust the portfolio by giving less weight to those that are more volatile or risky. It's done by using a starting percent of the account, preferably a small percent of it, and buying up shares with that same amount for each equity. Each equity will also be divided by the COV to risk adjust the portfolio by giving less weight to the more volatile stocks. This is done until as much of the initial capital in the account as possible is spent.
COV is how far away the price is from the mean or average. The further the price is from the mean the more risk or volatility there is. It uses standard deviation in its calculation. The problem with SD and ATR is that they are not relative to the past or to other equities to compare to. An application where COV can be used is risk portfolio management formulas. This does not take into account correlation or other equation parts in some portfolio management formulas but only the risk or volatility, the default volatility length is mostly arbitrary, and the lower risk stocks may end up being the slowest in performance.
The text label will show how many shares will be bought and how much value each equity will have. At the end it will show the initial capital that was started off with, the total shares bought, the total value of all the shares, and the amount of capital left over. If the sources are not blank then they will be used, to blank them you will need to reset the settings to default otherwise they might still be read. If you want to add more than the given 10 equity spaces to the portfolio then you will need to add in the code manually and add it to the chart. The denominator is perhaps the important part in these types of risk position sizing tools, you can change to other things such as risk-reward ratio instead of volatility or change the volatility type, etc.
Pinescript - Standard Array Functions Library by RRBStandard Array Functions Library by RagingRocketBull 2021
Version 1.0
This script provides a library of every standard Pinescript array function for live testing with all supported array types.
You can find the full list of supported standard array functions below.
There are several libraries:
- Common String Functions Library
- Common Array Functions Library
- Standard Array Functions Library
Features:
- Supports all standard array functions (30+) with all possible array types* (* - except array.new* functions and label, line array types)
- Live Output for all/selected functions based on User Input. Test any function for possible errors you may encounter before using in script.
- Output filters: show errors, hide all excluded and show only allowed functions using a list of function names
- Console customization options: set custom text size, color, page length, line spacing
Notes:
- uses Pinescript v3 Compatibility Framework
- uses Common String Functions Library
- has to be a separate script to reduce the number of local scopes in Common Array Function Library, there's no way to merge these scripts into a single library.
- lets you live test all standard array functions for errors. If you see an error - change params in UI
- array types that are not supported by certain functions and producing a compilation error were disabled with "error" showing up as result
- if you see "Loop too long" error - hide/unhide or reattach the script
- doesn't use pagination, a single str contains all output
- for most array functions to work (except push), an array must be defined with at least 1 pre-existing dummy element 0.
- array.slice and array.fill require from_index < to_index otherwise error
- array.join only supports string arrays, and delimiter must be a const string, can't be var/input. Use join_any_array to join any array type into string. You can also use tostring() to join int, float arrays.
- array.sort only supports int, float arrays. Use sort_any_array from the Common Array Function Library to sort any array type.
- array.sort only sorts values, doesn't preserve indexes. Use sort_any_array from the Common Array Function Library to sort any array while preserving indexes.
- array.concat appends string arrays in reverse order, other array types are appended correctly
- array.covariance requires 2 int, float arrays of the same size
- tostring(flag) works only for internal bool vars, flag expression can't depend on any inputs of any type, use bool_to_str instead
- you can't create an if/function that returns var type value/array - compiler uses strict types and doesn't allow that
- however you can assign array of any type to another array of any type creating an arr pointer of invalid type that must be reassigned to a matching array type before used in any expression to prevent error
- source_array and create_any_array2 use this loophole to return an int_arr pointer of a var type array
- this works for all array types defined with/without var keyword. This doesn't work for string arrays defined with var keyword for some reason
- you can't do this with var type vars, this can be done only with var type arrays because they are pointers passed by reference, while vars are the actual values passed by value.
- wrapper functions solve the problem of returning var array types. This is the only way of doing it when the top level arr type is undefined.
- you can only pass a var type value/array param to a function if all functions inside support every type - otherwise error
- alternatively values of every type must be passed simultaneously and processed separately by corresponding if branches/functions supporting these particular types returning a common single result type
- get_var_types solves this problem by generating a list of dummy values of every possible type including the source type, allowing a single valid branch to execute without error
- examples of functions supporting all array types: array.size, array.get, array.push. Examples of functions with limited type support: array.sort, array.join, array.max, tostring
- unlike var params/global vars, you can modify array params and global arrays directly from inside functions using standard array functions, but you can't use := (it only works for local arrays)
- inside function always work with array.copy to prevent accidental array modification
- you can't compare arrays
- there's no na equivalent for arrays, na(arr) doesn't work
P.S. A wide array of skills calls for an even wider array of responsibilities
List of functions:
- array.avg(arr)
- array.clear(arr)
- array.concat(arr1, arr2)
- array.copy(arr)
- array.covariance(arr1, arr2)
- array.fill(arr, value, index_from, index_to)
- array.get(arr, index)
- array.includes(arr, value)
- array.indexof(arr, value)
- array.insert(arr, index, value)
- array.join(arr, delimiter)
- array.lastindexof(arr, value)
- array.max(arr)
- array.median(arr)
- array.min(arr)
- array.mode(arr)
- array.pop(arr)
- array.push(arr, value)
- array.range(arr)
- array.remove(arr, index)
- array.reverse(arr)
- array.set(arr, index, value)
- array.shift(arr)
- array.size(arr)
- array.slice(arr, index_from, index_to)
- array.sort(arr, order)
- array.standardize()
- array.stdev(arr)
- array.sum(arr)
- array.unshift(arr, value)
- array.variance(arr)

Volume Weighted DeviationsVolume !weighted!
deviations.
Important: I don't really know how people generally compute deviations from VWAP/VWMA, but smth tells me generally it's just a Av Dev/St Dev based on mean, not on appropriate basis, like volume weighted mean in our case. This version is mathematically correct, it first calculates weighted mean, than utilizes this weighted in mean in AvDev & StDef functions modified to take into account weights.

VAMA Volume Adjusted Moving Average BandsThis indicator is standard deviation bands using a live analysis adaptation of Richard Arms' Volume Adjusted Moving Average as their basis. VAMA utilizes a period length that is based on volume increments rather than time.
• SampleN - N volume bars used as sample to calculate average volume , 0 equals all bars.
• VAMA Source - Price used for volume weighted calculations.
• VAMA Length - Specified number of volume ratio buckets to be reached.
• VAMA VI Fct - Size of volume ratio buckets.
• VAMA Strict - Must meet desired volume requirements, even if number of bars has to exceed VAMA Length to do it.
• STDV Factor - Standard Deviation multiplier.
• STDV Length - Standard Deviation period.
• Brightness - Color opaqueness for the band fills.
Please see previous published example here for more details on VAMA's usage and inability to redraw the past on time based charts.
NOTICE: This is an example script and not meant to be used as an actual strategy. By using this script or any portion thereof, you acknowledge that you have read and understood that this is for research purposes only and I am not responsible for any financial losses you may incur by using this script!

Chonky Pivot Pointsstandard pivot points re-written with circle plots.
Only shows the current pivot points. P, R1/R2, S1/S2
I don't use R3, R4 etc. so I didnt include them but feel free to modify the code.
You can change the resolution in indicator settings, default is set to Monthly.
Also to change the size of the circles all at once, you can input a number 1-4 in the inputs section.

Standard Deviation Measurement ToolIf you like the script please come back and leave me a comment or find me on the interwebs. I get notified you "liked" it... but I have no idea if you actually use it. So, let me know =)
The script uses the open price as the mean and calculates the standard deviation from the open price on a per candle basis
- Goal: -
To establish a mean based on the Open Price and calculate the standard deviation.
The reason for this is if the Open is the mean, then the Standard deviation implies a standardized distance a given candle can be expected to travel
from the open price
- Edge: -
If you know that there is a 68%/95%/99.7% probability that price will NOT move more than
One Standard Deviation/Two Standard Deviations/Three Standard Deviations from the open price respectively
you can set reasonable price targets that relate to those probabilities in a given timeframe.
e.g. if you're on a 1h chart and your target is 3.5% from the open price, but 1 standard deviation of the hourly candle is equal to 0.78%.
You can make assumptions on either:
- The reasonableness of your target
or
- The holding period likely required for the trade.
Also, Standard Deviation is a function of volatility and this tool provides a unique mechanism for measuring volatility as well on a candle by candle basis
- Customization Options-
- Set 3 independent upper and lower standard deviations.
- Each set of standard deviations are on a switch so you can show 1, 2, or 3 sets of standard deviations
- You can set the distribution width
- Though it's not recommended, you can change the mean source.
- There is a switch to show the standard deviation on only the real-time bar or real-time and historical bars.
- How I Think About This Script -
This strategy is predicated the same principle as Bollinger Bands: the reality that 68% of all data points will fall within one standard deviation of the mean, 96% of all data points will fall within two standard deviations, and 98% of al data points will fall within 3 standard deviations. By understanding the standard deviation, you can possibly infer an edge by understanding the probabilistic range price will be bound to the limits of standard deviation rules according to their probabilistic outcomes for the single candle on any given timeframe. Bollinger Bands are designed to provide this information with the mean being a 20-period moving average and this indicator.
This indicator is designed to provide standard deviation information with the mean being based on the distance price travels away from the open of individual candles in the lookback period.
If you use a strategy where you enter on major candle closes, this can be useful to set targets for those entries based on the intended hold period or at least add/remove validity to other target metrics.
Example:
Your target is at the 1.618 Fibonacci level and your confirmation triggers on the 4h candle close (H4 if that's your thing lol). You set up the indicator based on the standard deviation of price movement in 4h candles over the last week.
Let's say the indicator shows that the 1.618 Fibonacci level is 3 standard deviations away.
This being the case this statistically indicates that within the next 4 hours, you have a very low probability of achieving your target (>2%). This doesn't invalidate your target, but it does indicate a low probability of achieving it in the next 4hrs. With this information, you can infer that you are either going to be (a) really lucky (b) in this trade for a lot longer than 4hrs or (c) your target is unrealistic given your intended hold period.
You can develop a more probabilistically favorable hold period calculation by looking at the standard deviation on a higher time frame (e.g. 1d-1w).
Bonus feature: You'll find that the 2 and 3 standard deviations will often "cluster" and these clusters often provide future S/R levels. That's a pretty sweet feature no one things to look for. But, try it. Find a cluster of 2nd and 3rd stdevs that are in somewhat of a horizontal pattern (usually the result of a range) and you'll find that to be a good s/r area. Even better if you use the 3.2 standard deviation, you'll find that is a fantastic breakout signal!
Summary
So, you can use it for target setting, a confluence test, a reasonableness test, or just a measurement tool.
This was the first TV script I ever wrong.. Got taken down. But, I've re-released it because there are other TV scripts that attempt to do this but are completely wrong.
Please be careful about using other people's scripts. Always validate the math of the script before you use it if possible.
Stay safe out there and I hope all your dreams come true.

Dual Thrust Trading Algorithm (ps4)This is an PS4 update to the popular Dual Thrust trading algorithm posted by me some time ago (). It has been commonly used in futures, Forex and equity markets. The idea of Dual Thrust is similar to a typical breakout system, however dual thrust uses the historical price to construct update the look back period - theoretically making it more stable in any given period.
See: www.quantconnect.com

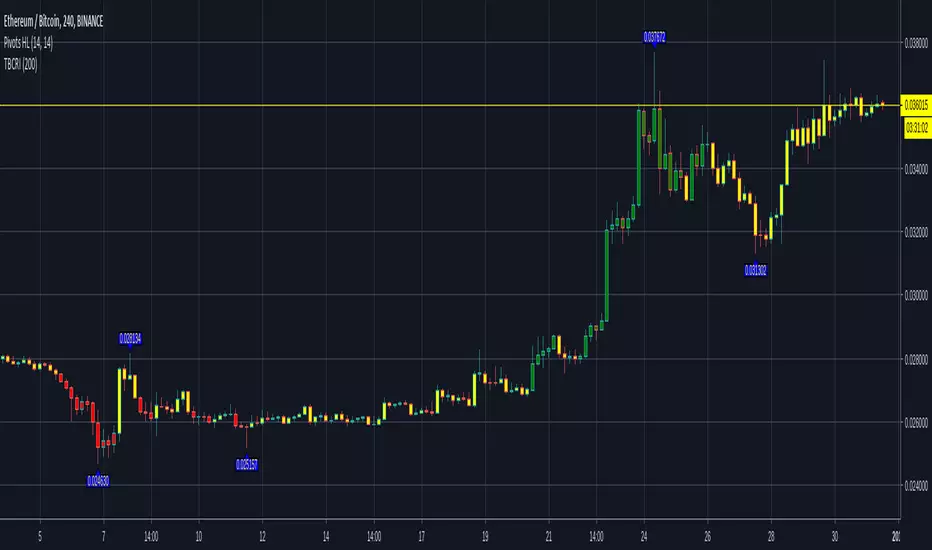
TBCRI - Trend Bar Color Reversal IndicatorAn idea I had today morning so I had to write. It seems to detect trends well. It has three phases like a semaphor, painting the chart bars of green, yellow or red.
=== Bar Color Meaning ===
Green: uptrend
Yellow: don't care
Red: downtrend
I think it can be useful!
Thanks!
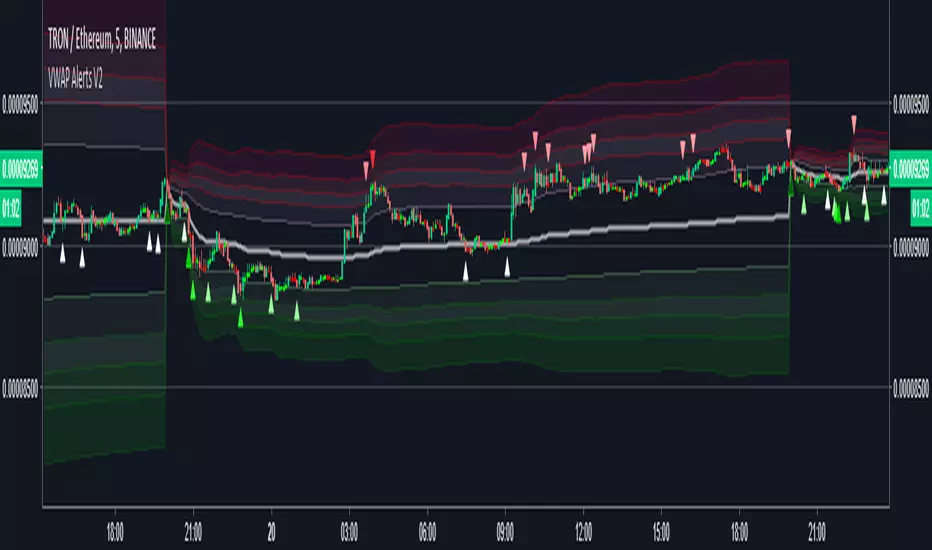
VWAP Alerts V2Alerts added to "VWAP Stdev Bands v2" by SandroTurriate
Changes
-Adjusted trigger conditions for higher signal sensitivity
-Color change on bands and signals for better readability and ease on the eyes
-Alerts added for up to 4 deviations up and down
-Re-enabled deviations 4 and 5
-Re-enabled previous close