EMA,SMA,VWAPSMA EMA and VWAP all in one for you free accounters out there! The ultimate chart inspired by RizeSenpai created by Bitcorns-trader aka FACE aka ( ͡° ͜ʖ ͡°)
Sma

SMMA 5-13 crossCrossing the Smoothed Moving Averages with settings 5 & 13 give you confident signal for selling or buying.
IMPORTANT: Signal is always late.
SELL : Short SMMA (5) cross the Long SMMA (13) from top
BUY : Short SMMA (5) cross the Long SMMA (13) from down

ALMA Function [FN] - Arnaud Legoux Moving AverageThis hasn't been done before. People know the ALMA moving average, TradingView, of course, has a built-in function for the ALMA = alma(). But, when you use built-in functions, you can't have a series as a length. Pinecoders put out a bunch of functions for various routines wherein the built-in doesn't allow for a series as a length. I got some help from @everget (awesome dude) to do the dev() function as well... can't find the ALMA anywhere. So, here it is. It seems to match the built-in indicator. To double-check me, just put the ALMA built-in over this and they should match. Let me know if you find an issue.
That's it. ALMA is cool. I'm going to use it as the average for the CCI. Good day.

GMS: Keltner ChannelsBasically I wanted to make this into one indicator instead of three while adding in some extra options as well... So this is just a Keltner Channel with three channels, all of which have the same length. I have also added in an option to select the moving average for the channel, the original is based on the EMA.
The source code should be open so take a look around and enjoy!
Andre

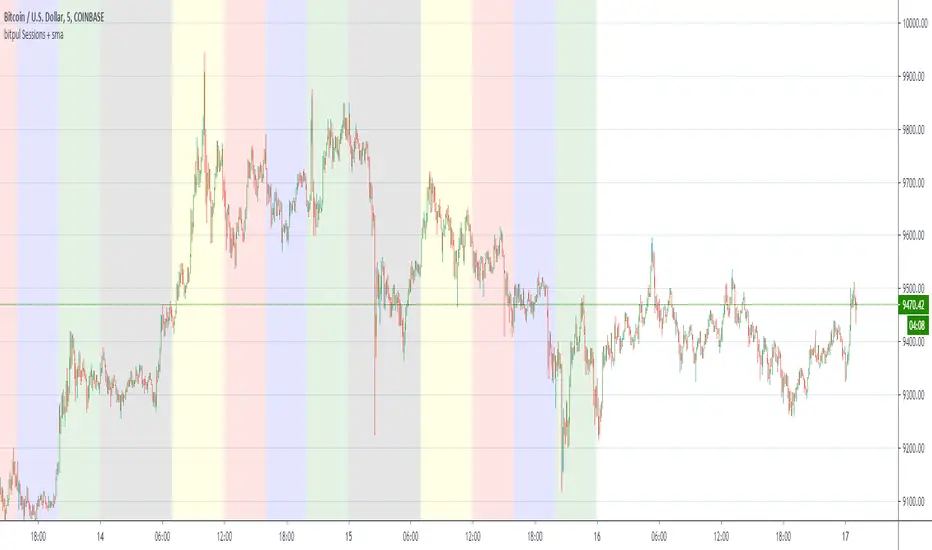
bitpul Sessions + sma [MHMK]Background colors that show open-close of the major market sessions ( Tokyo, London, joint time, New York, free time).
I added two sma to get more confirmation for the reversal - You can hide smas
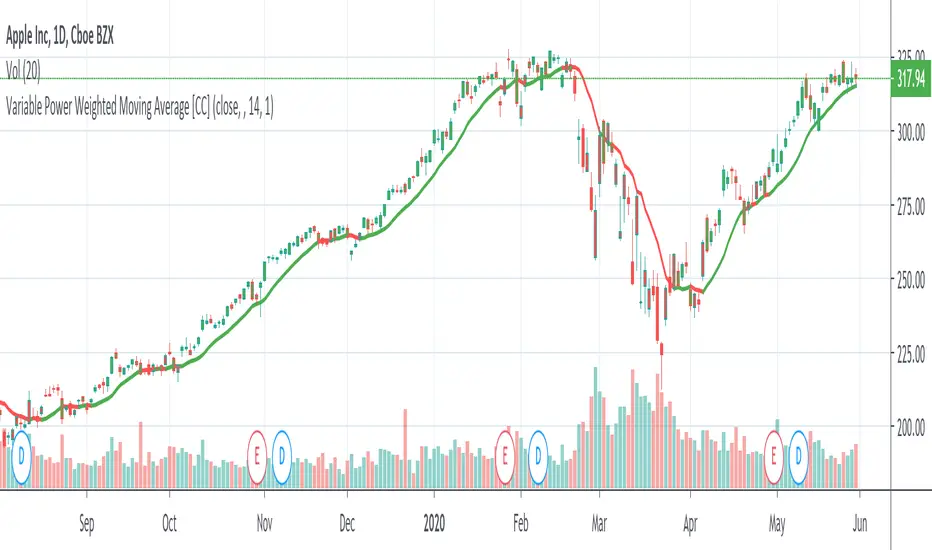
Variable Power Weighted Moving AverageThe Variable Power Weighted Moving Average was created by RedKTrader so make sure you follow them! This is a very handy indicator where you can change the weights of the weighted moving average yourself!
For an easy guide here are common values to use to convert this indicator into other indicators:
Power = 0 = Simple Moving Average
Power = 0.5 = Square Root Weighted Moving Average
Power = 1 = Weighted Moving Average
Power = 2 = Squared Weighted Moving Average
Try it out and let me know what you think!
Let me know if you have other ideas for me or if you want something custom done!
CBG PaintBarsUses a linear regression of averages to paint bars.
Average types include SMA, EMA, Weighted, Hull, Symmetrical, Volume Weighted, Wilder, and Linear Regression.
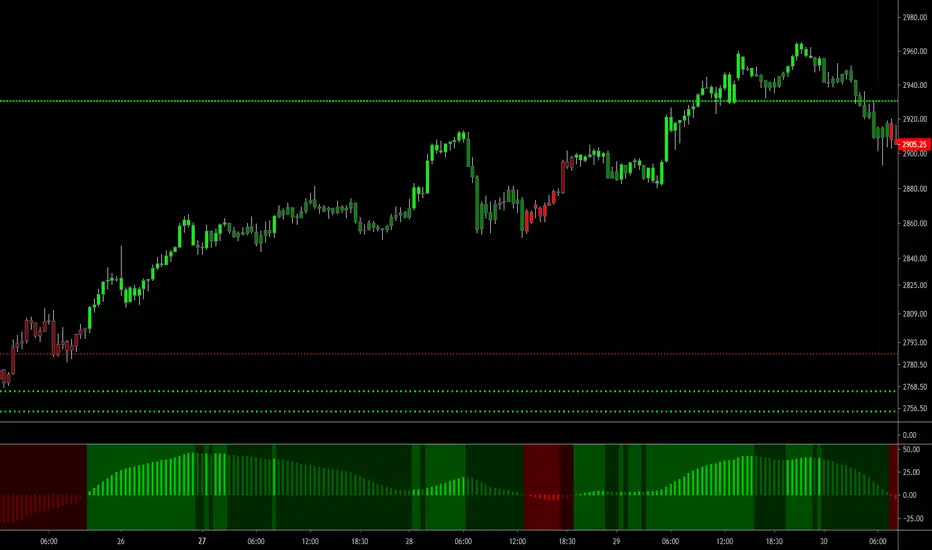
Trend Analysis IndicatorThe Trend Analysis Indicator was created by Adam White (Stocks & Commodities V. 10:8 (358-360)) and this is not to be confused with the Trend Analysis Index which was also created by Adam White. The stock is trending when it is above the signal and loses steam when it falls below the signal. Generally you should buy when it is above it's signal and sell when it goes below the signal.
Let me know if you would like me to write more scripts!

MA * Fibo levels (auto)A few updates to the previous post.
In order to catch more exact points of TP and SL, the scrypt takes "high" as the source of SMA if the percentage is greater than 0 ( > 0), and "low" as the source when the given percentage is less than 0 ( < 0).
So there are two basic SMA line ( one with "high", the other one with "low"), and the other lines would be results of multiplying either the higher base or the lower one.
Good luck in trading!
If the scrypt was useful let me know!
Any feedbacks and ideas are welcomed!

CBG Keltner ChannelsKeltner Channel with the following Moving Average types: SMA, EMA, Weighted, Hull, Symmetrical, Volume Weighted, Wilder and Linear Regression. Plus 2 bands with full color shading.
The picture shows the Keltner channels with the Wilder MA, my favorite. See how easy it would have been to stay in the move down? Excellent indicator.

Variable Length Moving AverageThe Variable Length Moving Average was created by George R. Arrington Ph.D. (Stocks & Commodities V. 9:6 (219-223)) and I'm really loving this indicator. It is a great moving average that hugs the price very closely and it is fully adjustable to your needs. It detects signals extremely well and I have color coded the moving average line to make it very easy to interpret.
This is not to be confused with the Variable Moving Average created by Tushar S. Chande and as of now I haven't seen any other script for this moving average out there yet.
Please let me know if you would like me to write any other scripts for indicators you would like to see!

SMA & EMA Simple CrossoverTracks and highlights trends by using a simple SMA and EMA indicator. When a shorter SMA (default set to 10 periods) and a longer EMA (default set to 20 periods) cross over, a cross is placed upon the chart at the crossover point. Defaults settings for the periods and colours can be changed the user to meet their own preferences using the settings button (i.e. without having to edit the script).

Bollinger Channels / EMA and SMAThis is written as a system to replace the BB strategy.
I think it will work well.
It looks pretty stylish.
Description / Usage:
Adjust the length and multiplier based on your location with Bollinger Bands.
The multiplier of 1 provides you with a basic channel with high and low-source EMA (or SMA).
And with the 8-day exponential moving average, you can observe short entries and exits.
I wish good luck to the friends who will use it.
You can support and track new indicators.
Bu, BB stratejisinin yerini alacak bir sistem olarak yazılmıştır.
Oldukça şık görünüyor.
Kullanım
Bollinger Bantları ile bulunduğunuz yere göre uzunluk ve çarpanı ayarlayın.
1 çarpanı size yüksek ve düşük kaynaklı EMA (veya SMA) içeren temel bir kanal sağlar.
Ve 8 günlük üstel hareketli ortalama ile kısa giriş ve çıkışları gözlemleyebilirsiniz.
Kullanacak arkadaşlara bol kazançlar diliyorum.
Yeni indikatör için destek olabilir ve takip edebilirsiniz.

Triple SMA/EMAThis indicator displays the 50, 100 and 200 period SMA and EMA and shades the area between the corresponding SMAs and EMAs

EMA / Fibonacci / Bollinger Indicator for Market Sniper SuiteHello all,
this script was created to be used in conjunction with Market Sniper - Trading/Scalping Suite . It was put together to make instrument analysis faster and less convoluted.
It includes
9 Fibonacci Exponential moving averages + 2 Simple moving averages
Auto Fibonacci levels - Tradingviews Auto Fib Retracement - with some modifications
Bollinger Bands - To faster spot squeeze momentum

Moving Average RibbonMoving Average Ribbon:
-----------------------------------------------------------
A series of moving averages of different lengths to create a ribbon-like indicator. Traders can determine trend strength by the distance between the moving averages, the overall balance of the coloured lines and determine price points. Price movements through the ribbon can be used to identify trend changes.
SMA, EMA, WMA with user defined length, starting plot, number of plots to show, theme choice and colour calculation toggle.
Inputs:
-----------------------------------------------------------
Source: input value for MAs (close)
Type: moving average type (ema)
Theme: multiple colours/themes (theme 2)
Length: MA length (13)
Start: MA plot number to start ribbon on (1)
No. of MAs: number of plots to show; maximum 32 (32)
Colour option: unchecked then line colour is based on the source value crossing current MA otherwise the moving average below (false)
Example:
-----------------------------------------------------------
multiple MAs overlaid with different values give interesting results e.g.
Ribbon1 :
length: 13
start: 1
Ribbon2:
length:1
start: 26
Notes:
-----------------------------------------------------------
if increasing the length beyond around 150 results in "references too many candles in history" error then reduce the no. of MAs value to show less MA plots; the longer length MAs will go beyond the 5k max candle history..

Moving Average Compendium===========
Moving Average Compendium (16 MA Types)
===========
A selection of the most popular, widely used, interesting and most powerful Moving Averages we can think of. We've compiled 16 MA's into this script, and allowed full access to the source code so you can use what you need, as you need it.
-----------
From very simple moving averages using built-in functions, all the way through to Fractal Adaptive Averages, we've tried to cover as much as we can think of! BUT, if you would like to make a suggestion or recommendation to be added to this compendium of MA's please let us know! Together we can get a complete list of many dozens of types of Moving Average.
Full List (so far)
---
SMA - Simple Moving Average
EMA - Exponential Moving Average
WMA - Weighted Moving Average
VWMA - Volume Weighted Moving Average
DEMA - Double Exponential Moving Average
TEMA - Triple Exponential Moving Average
SMMA - Smoothed Moving Average
HMA - Hull Moving Average
ZLEMA - Zero-Lag Exponential Moving Average
KAMA - Kaufman Adaptive Moving Average
JMA - Jurik Moving Average
SWMA - Sine-Weighted Moving Average
TriMA - Triangular Moving Average
MedMA - Moving Median Average
GeoMA - Geometric Mean Moving Average
FRAMA - Fractal Adaptive Moving Average
Line color changes from green (upward) to red (downward) - some of the MA types will "linger" without moving up or down and when they are in this state they should appear gray in color.
Thanks to all involved -
Good Luck and Happy Trading!

Historical Volatility Percentile + SMAHistorical Volatility Percentile tells you the percentage of the days from the past year (252 trading days) that have lower volatility than the current volatility.
I included a simple moving average as a signal line to show you how volatile the stock is at the moment.
I have included simple colors to let you know when to enter or exit a position.
Buy when price higher than EMA & historical volatility higher than SMA
Sell when price lower than EMA & historical volatility higher than SMA
Please let me know if you would like me to publish any other indicators! I always love to hear from you guys.

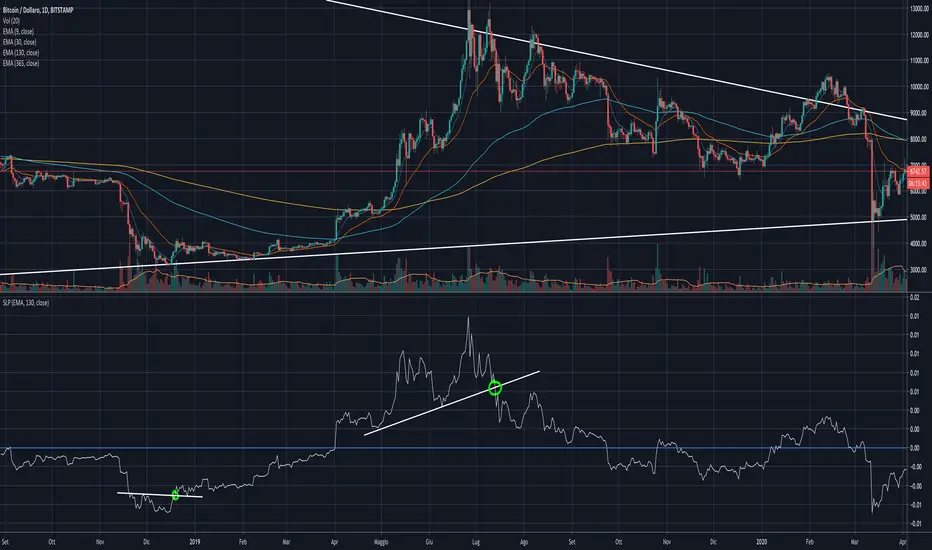
Moving Average SlopeA simple calculation and plotting of the slope of a Moving Average.
You'll be amazed looking at how accurate it is signaling early entries and exits from trend follower positions, just by applying some basic TA to it (support, resistance, trend lines).
Have a look:
In the settings, you can choose to use it on EMA on SMA, and the length of the MA involved.
I recommend using it on a medium-long sampling MA, to minimize noise.
6 SMA&look back 20SMA strategy6 SMA&look back 20SMA strategy
The moving average is calculated based on historical prices and is a backward indicator,Unable to forcast future prices.
But the moving average still represents the price trend, so we can forcast by moving average.
Each point of the 20-day SMA is calculated based on the closing price of the past 20 days.
Therefore, we can know that the closing price of the first 20 days directly affects the latest point of SMA.
The last 20 days are the prices included in the calculation, which directly affect the trend of the latest points.
For example,if the day before the 20th is a sharp fall, the latest SMA becomes an upward trend;If the day before the 20th is a sharp rise, the latest SMA becomes a downward trend,it showing the opposite trend
Recommended to use the daily trend.
Good Luck
移動平均線是根據歷史價格計算,屬於落後指標
但是移動平均線仍代表價格趨勢,因此我們可以通過移動平均線進行預測。
20天均線的每個點都是基於過去20天的收盤價計算的。
因此,我們可以知道前20天的收盤價直接影響SMA的最新點。
最近20天是計算中包括的價格,它直接影響最新點的趨勢。
例如,如果20日之前的一天是急劇下跌,則最新的SMA成為上升趨勢;如果20日之前的一天是急劇上漲,則最新的SMA成為下降趨勢,呈現相反的趨勢。
參考老王對SMA扣抵值的簡易版應用
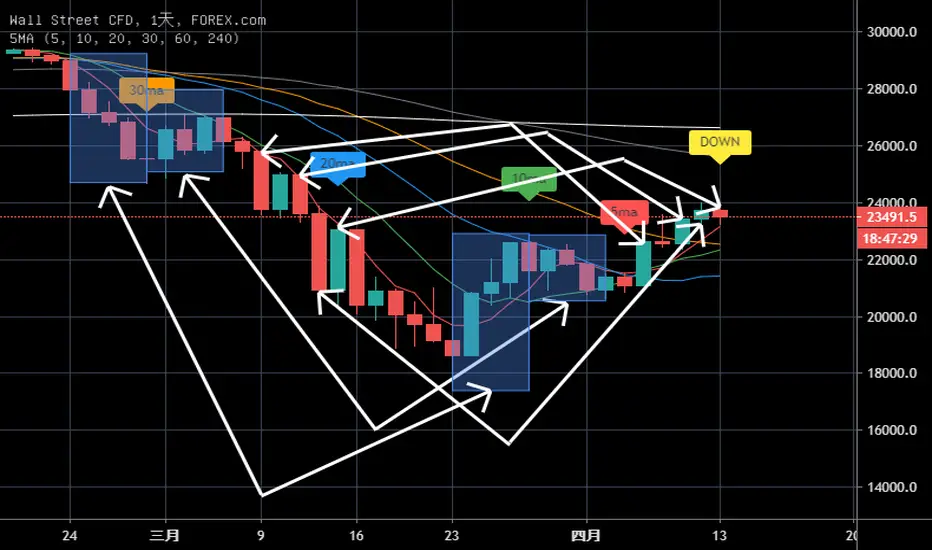
使用20MA的扣抵蹺蹺板來判斷今日可能是UP或DOWN
建議使用日線
祝好運
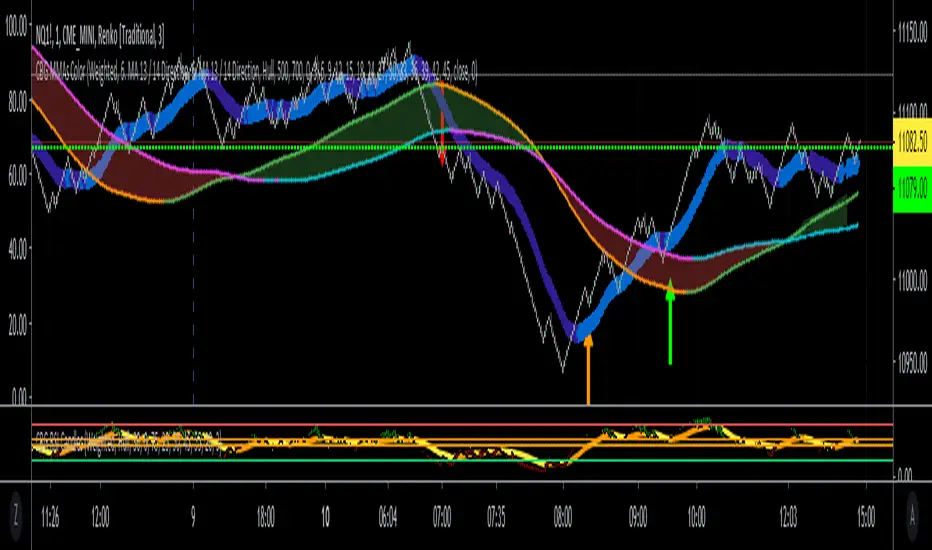
CBG MultiAverages ColorsThe latest version of my multiple moving averages. Now includes up to 14 moving averge lines plus a separate slow and fast moving average that can be assigned a different MA type.
In the screen shot is the fast/slow set to Hull with 15/50 periods. It is overlaid on top of my Key Numbers indicator.
7 moving averages in 1 indicator, including the Hull Moving Average .
SMA
EMA
Weighted
Hull
Symetrical
Volume Weighted
Wilder
Linear Regression
Lots of other features like background shading and paint bar colors.