Display Stocks with Change%Display Stocks with Change% - Pine Script™ Indicator
Overview
The Display Stocks with Change% indicator is designed for TradingView to highlight specific stocks and their percentage change on a given date. The indicator allows users to input custom stock names, dates, and percentage changes, displaying relevant information directly on the chart. Additionally, it provides an option to connect the stock's high price with a label using customizable line styles.
Features
Custom Stock List: Users can input multiple stock names along with corresponding dates and percentage changes.
Date-Specific Highlighting: The script dynamically checks if the current bar's date matches any input date and displays relevant stock data.
Color-Coded Percentage Change: Stocks with a negative change are displayed in red, while positive or neutral changes are in black.
Connecting Lines: An option to enable or disable dotted, dashed, or solid lines connecting the stock's high price to the label.
Automatic Label Positioning: Adjusts label alignment based on recent price movement to avoid overlap and enhance visibility.
Input Parameters
COB (Close of Business Dates): A comma-separated list of dates in DD-MM-YYYY format.
Stock Names: A comma-separated list of stock tickers.
Change Percentage: Corresponding percentage changes for the listed stocks.
Show Connecting Lines: Boolean toggle to enable or disable connecting lines.
Line Color & Style: Customizable line color and style (solid, dotted, or dashed).
How It Works
Data Processing: The script splits user inputs into arrays and iterates through them.
Date Matching: It checks if the current bar's date matches any of the provided COB dates.
Label Formatting: When a match is found, it constructs a label containing the stock name and its percentage change.
Text Alignment & Factor Adjustments: Dynamically determines label positioning based on recent price movements.
Label Display: If any matching stocks are found, a label is created at the stock's high price.
Connecting Line (Optional): If enabled, a line is drawn from the stock’s high to the label for better visualization.
Key Benefits for Traders:
Track Multiple Stocks at Once – Displays stock names and their percentage changes on specific dates automatically.
Saves Time – No need to manually check historical data; the indicator overlays key stock movements.
Visual Insights – Labels & color coding (red for negative, black for positive) make it easy to spot trends.
Customizable & Automated – Add your own stocks, dates, and percentage changes; the script adjusts dynamically.
📌 Use Case Example:
You’re tracking MRPL, CARTRADE, and JSWENERGY on specific dates. Instead of digging through historical data, this indicator automatically highlights the stock’s movement on that date, allowing you to make faster, informed trading decisions.
Sentiment

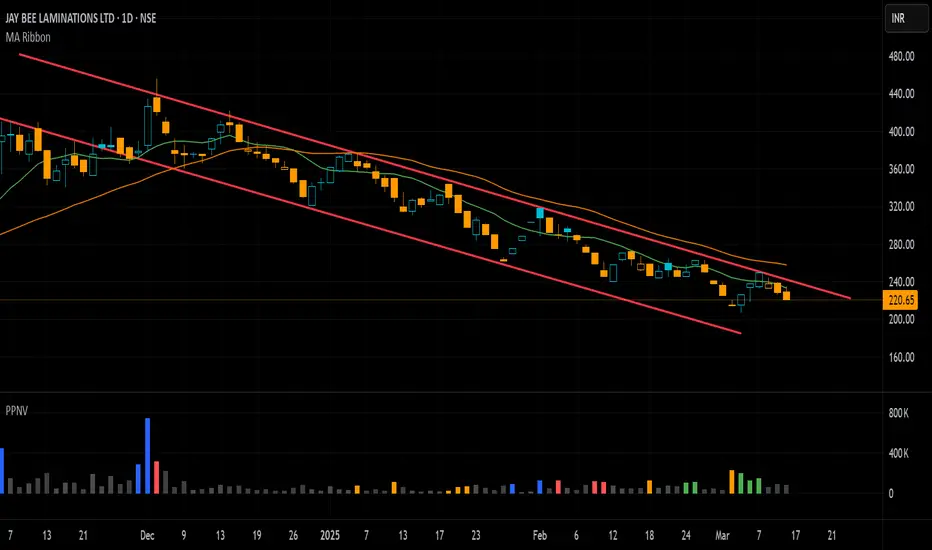
Pivot P/N VolumesTitle: Pivot P/N Volumes
Short Title: PPNV
Description:
The "Pivot P/N Volumes" indicator is a minimalistic volume analysis tool designed to cut through market noise and highlight key volume events in a separate pane. It strips away conventional volume clutter, focusing on four distinct volume types with clear visual cues, making it ideal for traders seeking actionable insights without distractions.
Key Features:
Blue Bars: Pocket Pivot Volumes (PPV) - Up-day volumes exceeding the highest down-day volume of the last 10 down-days, signaling potential bullish strength.
Orange Bars: Pivot Negative Volumes - Down-day volumes greater than the highest up-day volume of the last 10 up-days, indicating significant bearish pressure.
Red Bars: Down-day volumes above the 50-period EMA of volume, highlighting above-average selling activity.
Green Bars: Up-day volumes above the 50-period EMA of volume, showing above-average buying interest.
Noise: All other volumes are muted as dark grey (down-days) or light grey (up-days) for easy filtering.
TRP Stop-Loss and Position SizingScript is based on TRP to see both Long Stop Loss and Short Stop Loss, You can Also adjust the position size based on your capital and percentage risk.

Quantum Moving Average - QMA (TechnoBlooms)The Quantum Moving Average (QMA) is an innovative and advanced Moving Average model designed for traders seeking a more adaptive and precise trend analysis. Unlike traditional moving averages, it integrates a multi-timeframe approach, dynamically selecting and weighting four different timeframes to provide traders with more accurate and reliable trend prediction.
Key Features
Multi-Timeframe averaging
QMA calculates its value based on four different timeframes, offering a broader perspective on market trends.
Dynamic Weighting Mechanism
Unlike fixed weight Moving Averages, QMA assigns adaptive weightage to the selected timeframes, enhancing its responsiveness.
Superior Trend Detection
Provides a smoother and more reliable trend curve reducing noise or false signals.
Enhanced Market Analysis
QMA helps traders identify trend shifts earlier by incorporating multi-timeframe confluence.

ST_HTF_EMA### **ST_HTF_EMA – Higher Timeframe EMA Overlay**
#### **Description:**
The **ST_HTF_EMA** indicator plots a **21-period Exponential Moving Average (EMA)** from a **higher timeframe** onto the current chart. This allows traders to track key trend levels from a larger perspective while trading on a lower timeframe.
#### **Features:**
- **Customizable Timeframe:** The EMA is sourced from a user-defined timeframe (default: **5-minute**).
- **EMA Calculation:** Uses the **21-period EMA** for smoothing price action and identifying trend direction.
- **Envelope Bands (Optional):** A **0.75% envelope** can be toggled on to create upper and lower bands around the EMA for potential dynamic support/resistance zones.
- **Overlay on Chart:** The EMA and envelope bands are plotted directly on the price chart for easy visibility.
#### **How to Use:**
- Use the **EMA as a trend guide**—price above the EMA suggests bullish momentum, while price below indicates bearish momentum.
- Enable the **envelope bands** (if needed) to spot price deviations from the mean for possible reversal or continuation trades.
#### **Customization:**
- Modify the **timeframe** to adapt the EMA to different market structures.
- Adjust the **envelope percentage** to fine-tune sensitivity.
#### **Visuals:**
- The **EMA is plotted in yellow** for clear visibility.
- **Envelope bands (if enabled)** appear in yellow, with a subtle background highlight.
This indicator is ideal for traders who rely on **higher timeframe trend confirmation** while making decisions on lower timeframes. 🚀

[GYTS-CE] Market Regime Detector🧊 Market Regime Detector (Community Edition)
🌸 Part of GoemonYae Trading System (GYTS) 🌸
🌸 --------- INTRODUCTION --------- 🌸
💮 What is the Market Regime Detector?
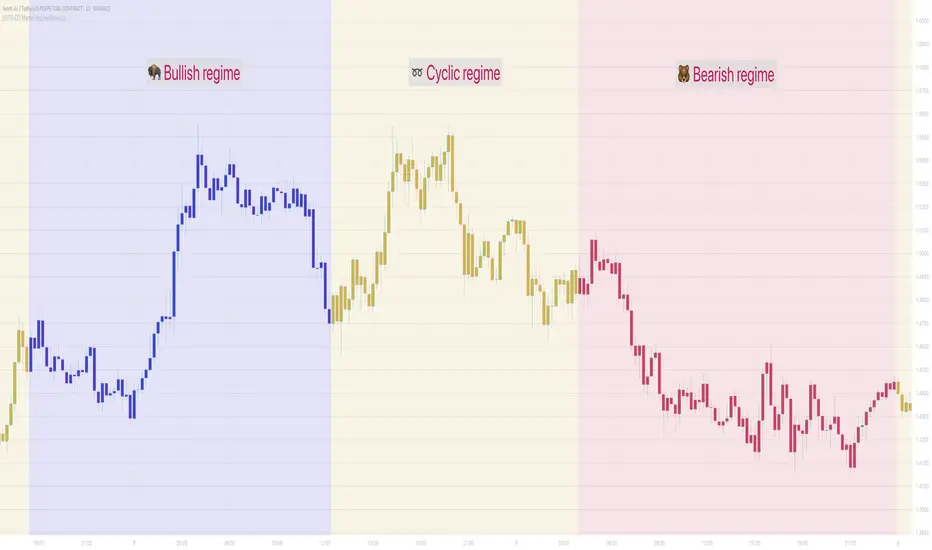
The Market Regime Detector is an advanced, consensus-based indicator that identifies the current market state to increase the probability of profitable trades. By distinguishing between trending (bullish or bearish) and cyclic (range-bound) market conditions, this detector helps you select appropriate tactics for different environments. Instead of forcing a single strategy across all market conditions, our detector allows you to adapt your approach based on real-time market behaviour.
💮 The Importance of Market Regimes
Markets constantly shift between different behavioural states or "regimes":
• Bullish trending markets - characterised by sustained upward price movement
• Bearish trending markets - characterised by sustained downward price movement
• Cyclic markets - characterised by range-bound, oscillating behaviour
Each regime requires fundamentally different trading approaches. Trend-following strategies excel in trending markets but fail in cyclic ones, while mean-reversion strategies shine in cyclic markets but underperform in trending conditions. Detecting these regimes is essential for successful trading, which is why we've developed the Market Regime Detector to accurately identify market states using complementary detection methods.
🌸 --------- KEY FEATURES --------- 🌸
💮 Consensus-Based Detection
Rather than relying on a single method, our detector employs two complementary detection methodologies that analyse different aspects of market behaviour:
• Dominant Cycle Average (DCA) - analyzes price movement relative to its lookback period, a proxy for the dominant cycle
• Volatility Channel - examines price behaviour within adaptive volatility bands
These diverse perspectives are synthesised into a robust consensus that minimises false signals while maintaining responsiveness to genuine regime changes.
💮 Dominant Cycle Framework
The Market Regime Detector uses the concept of dominant cycles to establish a reference framework. You can input the dominant cycle period that best represents the natural rhythm of your market, providing a stable foundation for regime detection across different timeframes.
💮 Intuitive Parameter System
We've distilled complex technical parameters into intuitive controls that traders can easily understand:
• Adaptability - how quickly the detector responds to changing market conditions
• Sensitivity - how readily the detector identifies transitions between regimes
• Consensus requirement - how much agreement is needed among detection methods
This approach makes the detector accessible to traders of all experience levels while preserving the power of the underlying algorithms.
💮 Visual Market Feedback
The detector provides clear visual feedback about the current market regime through:
• Colour-coded chart backgrounds (purple shades for bullish, pink for bearish, yellow for cyclic)
• Colour-coded price bars
• Strength indicators showing the degree of consensus
• Customizable colour schemes to match your preferences or trading system
💮 Integration in the GYTS suite
The Market Regime Detector is compatible with the GYTS Suite , i.e. it passes the regime into the 🎼 Order Orchestrator where you can set how to trade the trending and cyclic regime.
🌸 --------- CONFIGURATION SETTINGS --------- 🌸
💮 Adaptability
Controls how quickly the Market Regime detector adapts to changing market conditions. You can see it as a low-frequency, long-term change parameter:
Very Low: Very slow adaptation, most stable but may miss regime changes
Low: Slower adaptation, more stability but less responsiveness
Normal: Balanced between stability and responsiveness
High: Faster adaptation, more responsive but less stable
Very High: Very fast adaptation, highly responsive but may generate false signals
This setting affects lookback periods and filter parameters across all detection methods.
💮 Sensitivity
Controls how sensitive the detector is to market regime transitions. This acts as a high-frequency, short-term change parameter:
Very Low: Requires substantial evidence to identify a regime change
Low: Less sensitive, reduces false signals but may miss some transitions
Normal: Balanced sensitivity suitable for most markets
High: More sensitive, detects subtle regime changes but may have more noise
Very High: Very sensitive, detects minor fluctuations but may produce frequent changes
This setting affects thresholds for regime detection across all methods.
💮 Dominant Cycle Period
This parameter allows you to specify the market's natural rhythm in bars. This represents a complete market cycle (up and down movement). Finding the right value for your specific market and timeframe might require some experimentation, but it's a crucial parameter that helps the detector accurately identify regime changes. Most of the times the cycle is between 20 and 40 bars.
💮 Consensus Mode
Determines how the signals from both detection methods are combined to produce the final market regime:
• Any Method (OR) : Signals bullish/bearish if either method detects that regime. If methods conflict (one bullish, one bearish), the stronger signal wins. More sensitive, catches more regime changes but may produce more false signals.
• All Methods (AND) : Signals only when both methods agree on the regime. More conservative, reduces false signals but might miss some legitimate regime changes.
• Weighted Decision : Balances both methods with equal weighting. Provides a middle ground between sensitivity and stability.
Each mode also calculates a continuous regime strength value that's used for colour intensity in the 'unconstrained' display mode.
💮 Display Mode
Choose how to display the market regime colours:
• Unconstrained regime: Shows the regime strength as a continuous gradient. This provides more nuanced visualisation where the intensity of the colour indicates the strength of the trend.
• Consensus only: Shows only the final consensus regime with fixed colours based on the detected regime type.
The background and bar colours will change to indicate the current market regime:
• Purple shades: Bullish trending market (darker purple indicates stronger bullish trend)
• Pink shades: Bearish trending market (darker pink indicates stronger bearish trend)
• Yellow: Cyclic (range-bound) market
💮 Custom Colour Options
The Market Regime Detector allows you to customize the colour scheme to match your personal preferences or to coordinate with other indicators:
• Use custom colours: Toggle to enable your own colour choices instead of the default scheme
• Transparency: Adjust the transparency level of all regime colours
• Bullish colours: Define custom colours for strong, medium, weak, and very weak bullish trends
• Bearish colours: Define custom colours for strong, medium, weak, and very weak bearish trends
• Cyclic colour: Define a custom colour for cyclic (range-bound) market conditions
🌸 --------- DETECTION METHODS --------- 🌸
💮 Dominant Cycle Average (DCA)
The Dominant Cycle Average method forms a key part of our detection system:
1. Theoretical Foundation :
The DCA method builds on cycle analysis and the observation that in trending markets, price consistently remains on one side of a moving average calculated using the dominant cycle period. In contrast, during cyclic markets, price oscillates around this average.
2. Calculation Process :
• We calculate a Simple Moving Average (SMA) using the specified lookback period - a proxy for the dominant cycle period
• We then analyse the proportion of time that price spends above or below this SMA over a lookback window. The theory is that the price should cross the SMA each half cycle, assuming that the dominant cycle period is correct and price follows a sinusoid.
• This lookback window is adaptive, scaling with the dominant cycle period (controlled by the Adaptability setting)
• The different values are standardised and normalised to possess more resolving power and to be more robust to noise.
3. Regime Classification :
• When the normalised proportion exceeds a positive threshold (determined by Sensitivity setting), the market is classified as bullish trending
• When it falls below a negative threshold, the market is classified as bearish trending
• When the proportion remains between these thresholds, the market is classified as cyclic
💮 Volatility Channel
The Volatility Channel method complements the DCA method by focusing on price movement relative to adaptive volatility bands:
1. Theoretical Foundation :
This method is based on the observation that trending markets tend to sustain movement outside of normal volatility ranges, while cyclic markets tend to remain contained within these ranges. By creating adaptive bands that adjust to current market volatility, we can detect when price behaviour indicates a trending or cyclic regime.
2. Calculation Process :
• We first calculate a smooth base channel center using a low pass filter, creating a noise-reduced centreline for price
• True Range (TR) is used to measure market volatility, which is then smoothed and scaled by the deviation factor (controlled by Sensitivity)
• Upper and lower bands are created by adding and subtracting this scaled volatility from the centreline
• Price is smoothed using an adaptive A2RMA filter, which has a very flat and stable behaviour, to reduce noise while preserving trend characteristics
• The position of this smoothed price relative to the bands is continuously monitored
3. Regime Classification :
• When smoothed price moves above the upper band, the market is classified as bullish trending
• When smoothed price moves below the lower band, the market is classified as bearish trending
• When price remains between the bands, the market is classified as cyclic
• The magnitude of price's excursion beyond the bands is used to determine trend strength
4. Adaptive Behaviour :
• The smoothing periods and deviation calculations automatically adjust based on the Adaptability setting
• The measured volatility is calculated over a period proportional to the dominant cycle, ensuring the detector works across different timeframes
• Both the center line and the bands adapt dynamically to changing market conditions, making the detector responsive yet stable
This method provides a unique perspective that complements the DCA approach, with the consensus mechanism synthesising insights from both methods.
🌸 --------- USAGE GUIDE --------- 🌸
💮 Starting with Default Settings
The default settings (Normal for Adaptability and Sensitivity, Weighted Decision for Consensus Mode) provide a balanced starting point suitable for most markets and timeframes. Begin by observing how these settings identify regimes in your preferred instruments.
💮 Finding the Optimal Dominant Cycle
The dominant cycle period is a critical parameter. Here are some approaches to finding an appropriate value:
• Start with typical values, usually something around 25 works well
• Visually identify the average distance between significant peaks and troughs
• Experiment with different values and observe which provides the most stable regime identification
• Consider using cycle-finding indicators to help identify the natural rhythm of your market
💮 Adjusting Parameters
• If you notice too many regime changes → Decrease Sensitivity or increase Consensus requirement
• If regime changes seem delayed → Increase Adaptability
• If a trending regime is not detected, the market is automatically assigned to be in a cyclic state
• If you want to see more nuanced regime transitions → Try the "unconstrained" display mode (note that this will not affect the output to other indicators)
💮 Trading Applications
Regime-Specific Strategies:
• Bullish Trending Regime - Use trend-following strategies, trail stops wider, focus on breakouts, consider holding positions longer, and emphasize buying dips
• Bearish Trending Regime - Consider shorts, tighter stops, focus on breakdown points, sell rallies, implement downside protection, and reduce position sizes
• Cyclic Regime - Apply mean-reversion strategies, trade range boundaries, apply oscillators, target definable support/resistance levels, and use profit-taking at extremes
Strategy Switching:
Create a set of rules for each market regime and switch between them based on the detector's signal. This approach can significantly improve performance compared to applying a single strategy across all market conditions.
GYTS Suite Integration:
• In the GYTS 🎼 Order Orchestrator, select the '🔗 STREAM-int 🧊 Market Regime' as the market regime source
• Note that the consensus output (i.e. not the "unconstrained" display) will be used in this stream
• Create different strategies for trending (bullish/bearish) and cyclic regimes. The GYTS 🎼 Order Orchestrator is specifically made for this.
• The output stream is actually very simple, and can possibly be used in indicators and strategies as well. It outputs 1 for bullish, -1 for bearish and 0 for cyclic regime.
🌸 --------- FINAL NOTES --------- 🌸
💮 Development Philosophy
The Market Regime Detector has been developed with several key principles in mind:
1. Robustness - The detection methods have been rigorously tested across diverse markets and timeframes to ensure reliable performance.
2. Adaptability - The detector automatically adjusts to changing market conditions, requiring minimal manual intervention.
3. Complementarity - Each detection method provides a unique perspective, with the collective consensus being more reliable than any individual method.
4. Intuitiveness - Complex technical parameters have been abstracted into easily understood controls.
💮 Ongoing Refinement
The Market Regime Detector is under continuous development. We regularly:
• Fine-tune parameters based on expanded market data
• Research and integrate new detection methodologies
• Optimise computational efficiency for real-time analysis
Your feedback and suggestions are very important in this ongoing refinement process!
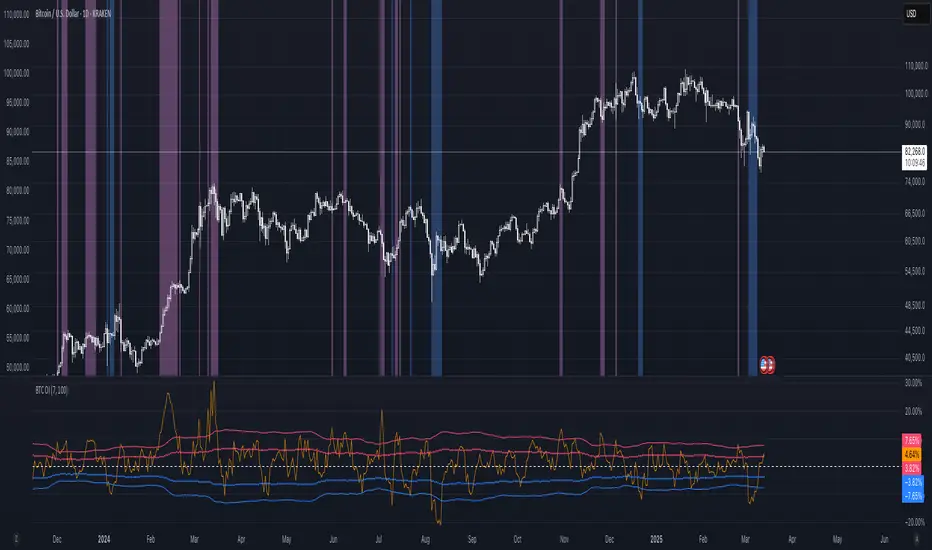
BTC: Open InterestThis indicator tracks the 7-day (default) percentage change in open interest (OI), providing insights into market participation trends. It includes customizable periods and colors, allowing traders to adjust settings for better visualization.
Open interest (OI) is the total number of active contracts (futures or options) that haven’t been closed or settled. It represents the total open positions in the market.
Thus when OI increases, more traders are entering new positions, signaling growing market interest. Conversely, when OI decreases, positions are being closed, suggesting lower trader participation or liquidation.
Attributes & Features:
Open Interest Percentage Change – Measures the 7-day % change in open interest to track market participation.
Customizable Calculation Period – Users can adjust the period (default: 7 days) for more flexible analysis.
Adjustable Colors – Allows modification of colors for better visualization.
Trend Identification – Highlights rising vs. falling open interest trends.
Works Across Assets – Can be used for cryptos, stocks, and futures with open interest data.
Overlay or Separate Panel – Can be plotted on price chart or as a separate indicator.
How It Works:
Fetches Open Interest Data – Retrieves open interest values for each day for USD, USDT, and USDC Bitcoin Perpetual Derivitives.
Calculates Percentage Change – Compares current open interest to its value X days ago (Default = 7 days).
Standard Deviation – Applies standard deviation ranging from -2 to +2 deviations to identify large shifts in OI.
Visual Alerts – Can highlight extreme increases or decreases signaling potential market shifts.
NOTE: THE INDICATOR DATA ONLY GOES BACK TO START OF 2022
VWAP Balance Zones - SessionsVWAP Balance Zones Sessions Version is an alternate take on the Original VWAP Balance Zones indicator. The Sessions version allows users to select a specific session to view the VWAP Balance Zones at while still utilizing the full ETH Data.
The Session version provides a better focused display while still maintaining the core functions of the original script with mindful optimizations.
Author's Note: "VBZ Sessions was made with logistics in mind, for the users who only trade within certain times of the day. While it displays the same core concepts, it is not as "Raw" of a display as the Original. For this reason, some users may prefer the Original VWAP Balance Zones, which is why I have opted to release this alternate version instead of updating the original."
> What are VWAP Balance Zones?
"VWAP Balance Zones" is an original concept aimed at identifying the equilibrium area between market participants within the current trend by averaging the Daily Extremes and the Daily VWAP.
Refer to the illustration below for a better understanding of exactly how VWAP Balance Zones are formed:
These zones are displayed for the Daily, Weekly, and Monthly VWAPs, with the most interactive timeframe being the Daily.
> Features
1. The Session Version uses ETH data at all times, and does not solely rely on the chart's data to create the VWAPs or Zones.
This allows the user to focus on a specific trading session, while not losing out on the full VBZ Calculation, with the notable benefit of a cleaner display.
The Original VBZ starts drawing at the beginning of the chart's "Day", and would produce different results when using an RTH chart vs an ETH chart. Along with creating a bird's nest of unusable data at the beginning of the day.
2. Session Start and End lines are displayed for easier identification of the designated trading session.
3. The extreme "Close" Lines are no longer displayed to reduce noise and redundancy.
4. Additionally, the interior VWAP lines are no longer displayed. Ultimately, this was to reduce noise and focus the script on the 50% zones.
5. Weekly and Monthly Zones are now displayed due to the reduced noise!
6. As with the original, the weekly display will yield to the daily, and the monthly display will yield to the weekly.
In the screenshot below, you can observe this behavior.
Enjoy!

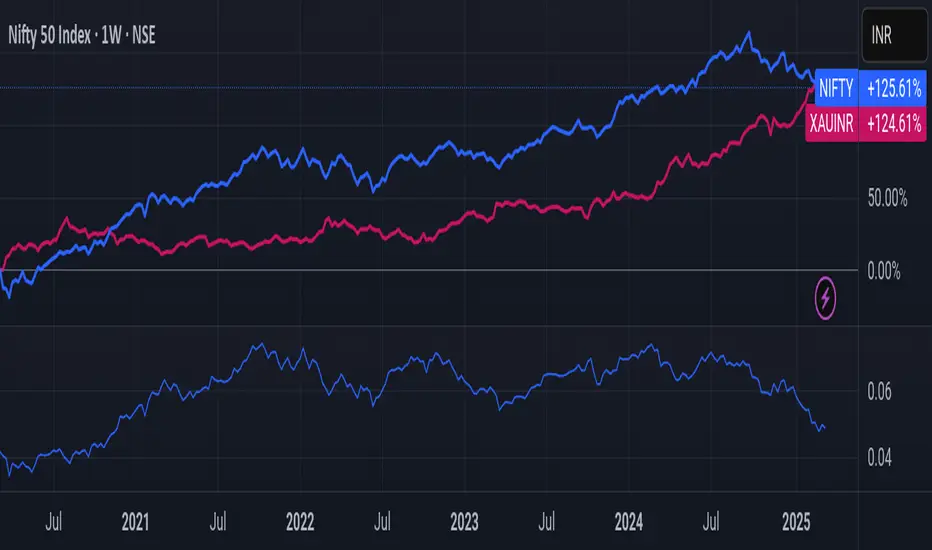
Nifty/Gold RatioPrice of NIFTY in GOLD. Highs indicate that Gold is getting cheaper, Lows indicate Nifty is getting cheaper.
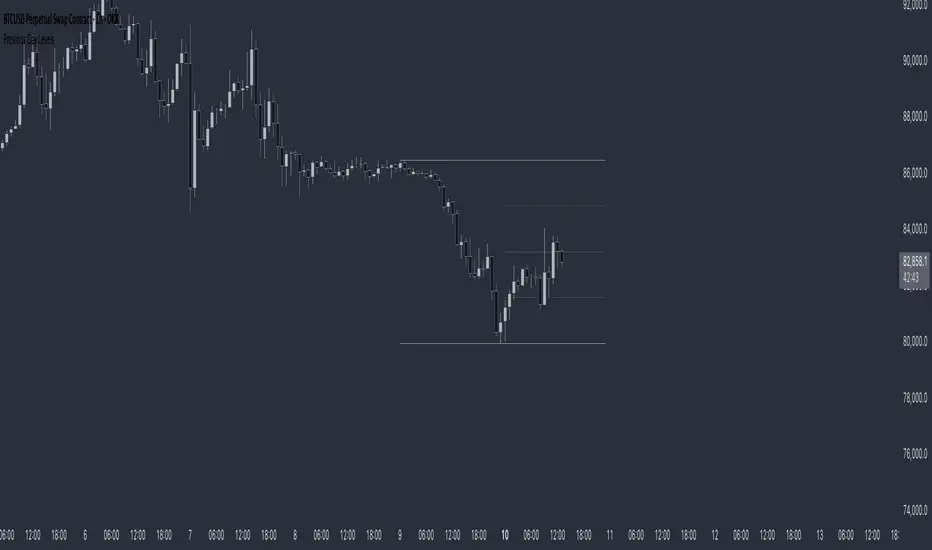
Previous Day LevelsThis indicator plots the previous day's high, low, and 50% levels, providing a framework for analyzing price behavior relative to these key levels.
Full Description:
The Previous Day Levels indicator is a tool designed to help traders analyze price action based on key levels from the previous trading session. By plotting the high, low, and mid-point (50%) of the prior day’s range, traders can assess potential market bias and directional tendencies for the current trading day.
Key Features:
Plots the previous day’s high (100%), low (0%), and intermediate levels (25%, 50%, 75%).
Allows users to customize line visibility, color, style, and width.
Helps traders identify potential support and resistance zones.
Provides a bias framework for determining whether price is more likely to target the previous high or low based on behavior around the 50% level.
Use Case:
This indicator is particularly useful for intraday and short-term traders who incorporate price action into their strategy.
If price trades above the 50% level and holds, it suggests a bullish bias, indicating that price may aim for the previous day's high.
If price trades below the 50% level and holds, it suggests a bearish bias, indicating that price may aim for the previous day's low.
The high and low levels can act as key support and resistance zones, where price may react or reverse.
How to Use:
Apply the indicator to your chart.
Observe how price interacts with the 50% level.
Use price behavior around these levels to establish a directional bias.
Adjust the line styles and colors to match your personal preference.
Disclaimer:
This indicator is a tool for market analysis and does not provide financial advice. Always perform your own analysis and risk management when trading.
Round NumbersTries to only show major round numbers regardless of whether you're looking at something priced in the thousands or under a dollar.
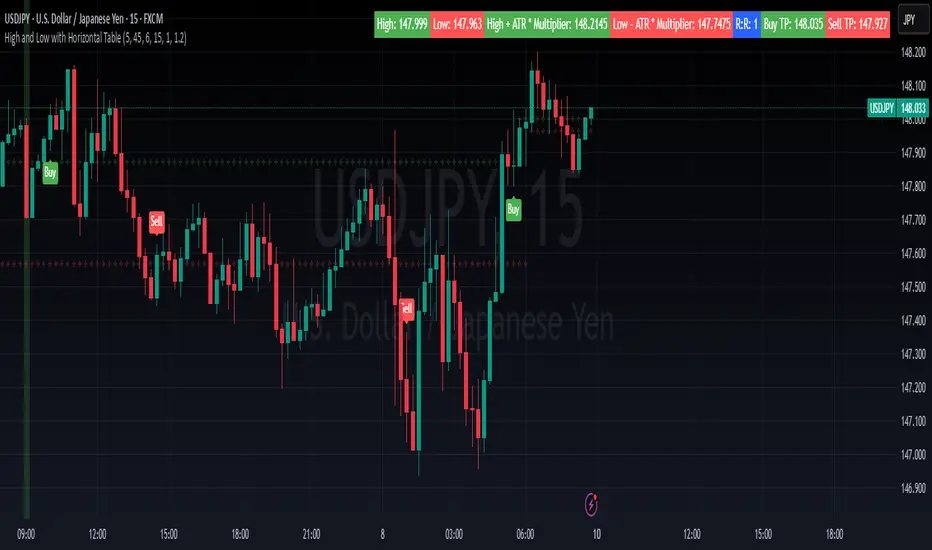
High and Low with Horizontal TableHigh and Low with Horizontal Table Indicator
Overview
The "High and Low with Horizontal Table" indicator is designed for traders who wish to monitor key levels based on specific candle times, along with dynamic risk-to-reward ratios and ATR-based values. This indicator features real-time calculations, visual cues, and a table for quick reference of the calculated values.
Key Features
Custom Time Inputs:
Users can define two specific time inputs to select the candles for the High and Low prices. These times can target the same or separate candles.
ATR-based Calculation:
The indicator allows users to apply an ATR Multiplier to adjust the calculation of key levels. By default, the ATR multiplier is set to 1.2, but users can adjust it to their preferred value (e.g., 1.5 or 2).
Risk-to-Reward (R:R) Calculation:
The Risk-to-Reward Ratio (R:R) is used to calculate potential Take Profit (TP) levels based on the high and low of the selected candle(s).
The default R:R ratio is 2.0, but it can be customized to suit the trader’s strategy.
Visual Markings:
The High and Low values are plotted with subtle markers on the chart (cross style) for easy identification. The display of these markers is subdued for minimal visual distraction.
Horizontal Table Display:
A horizontal table is generated in the top-right corner of the chart, providing a quick reference for the following values:
High and Low of the selected candle(s)
High + ATR Multiplier and Low - ATR Multiplier
R:R ratio
Buy TP and Sell TP levels
Each value is displayed with a reasonable number of decimal places (4 decimals) for major forex pairs, XAUUSD, and BTCUSD.
Input Parameters
Hour and Minute for High Candle: Select the time for the candle that will determine the High.
Hour and Minute for Low Candle: Select the time for the candle that will determine the Low.
ATR Multiplier: A customizable input for adjusting the ATR-based calculations (default is 1.2).
Risk-to-Reward (R:R): Set the ratio to determine the TP levels (default is 2.0).
How It Works
The user defines two distinct time inputs (one for the High and one for the Low).
At the specified times, the indicator captures the High and Low prices of the candles.
The ATR is calculated and adjusted by the user-defined ATR Multiplier to determine buffers above the High and below the Low.
The Risk-to-Reward ratio is applied to calculate the Take Profit levels.
All of these values are displayed on the chart and updated in real time. The horizontal table ensures quick reference to all the key levels without cluttering the main chart.
Use Cases
Trend Trading: Identify potential support and resistance levels based on specific timeframes and adjust TP targets using ATR.
Scalping: Use the ATR and R:R calculations to target precise entry and exit points.
Market Opens: Track key market opens (such as New York and London) with candle times that reflect your trading strategy.
Conclusion
The High and Low with Horizontal Table indicator is a powerful tool for traders looking to combine precise candle-based level tracking with ATR-based risk management. By displaying key levels and TP targets in a clear, tabular format, traders can quickly assess and act on key price levels throughout their trading sessions.
Liquidity Depth [AlgoAlpha]OVERVIEW
This script visualizes market liquidity by identifying key price levels where significant volume has transacted. It highlights zones of high buying and selling interest, helping traders understand where liquidity is accumulating and how price may respond to these areas. By dynamically tracking volume at highs and lows, the script builds a real-time liquidity profile, making it a powerful tool for identifying potential support and resistance levels.
CONCEPTS
Liquidity depth analysis helps traders determine how price interacts with supply and demand at different levels. The script processes historical volume data to distinguish between high-liquidity and low-liquidity zones. It assigns transparency levels to plotted lines , ensuring that more relevant liquidity areas stand out visually. The script adds a profile to show the depth of liquidity (derived from historical volume data) for levels above and below the current price
FEATURES
Liquidity Levels: Tracks liquidity levels based on volume concentration at price high and lows.
Volume-Based Transparency: More significant liquidity levels are displayed with higher visibility, showing their significance.
Interpolation: interpolates the bullish and bearish liquidity depth at a user defined range away from the price, helping in comparing the liquidity amounts between bullish and bearish.
Depth Profile: Allows traders to visualize depth of liquidity in a more quantitative and clearer way than the liquidity levels/list]
USAGE
This indicator is best used to track liquidity levels and potential price reaction areas. Traders can adjust the Liquidity Lookback setting to analyze past liquidity levels over different historical periods. The Profile Resolution setting controls the granularity of liquidity depth visualization, with higher values providing more detail. The script can be applied across different timeframes, from intraday scalping to swing trading analysis. The plotted liquidity zones provide traders with insights into where price may encounter strong support, resistance, or potential liquidity-driven reversals.

Real-Time Price Comparator→ La version française se trouve plus bas ←
Real-Time Price Spread Comparator
This indicator allows you to compare the real-time price difference (spread) between two assets. It is particularly useful for spotting arbitrage opportunities or price discrepancies between different markets.
💡 Why is this useful?
This tool is especially practical for monitoring the gap between CME futures and the spot market. If the spread becomes too large, we can expect the market to rebalance, which can help anticipate potential price movements.
📌 Features:
✅ Compare two assets of your choice (default: BTC CME vs. BTC OANDA).
✅ Displays the spread as a real-time value on the chart.
✅ Customizable threshold for alerts when the spread exceeds a certain value.
✅ Visual alert: The label changes color and an alert icon appears when the threshold is exceeded.
✅ Adjustable label position to avoid obstructing candlestick wicks.
🛠️ How to Use:
1️⃣ Choose the asset to compare (for example, BTC CME).
2️⃣ Select the main chart (the one you are currently viewing, such as BTC OANDA).
3️⃣ Set the alert threshold (the spread value that will trigger an alert).
4️⃣ Adjust the label position using the offset settings if needed.
5️⃣ When the spread exceeds the threshold, an alert will be displayed!
-------------------------------------------------
Comparateur de Spread en Temps Réel
Cet indicateur permet de comparer en temps réel la différence de prix (spread) entre deux actifs. Il est particulièrement utile pour détecter des opportunités d’arbitrage ou des écarts de prix entre différents marchés.
💡 Pourquoi c'est utile ?
Cet outil est pratique pour surveiller l’écart entre les contrats à terme CME et le marché spot. Si l’écart devient trop important, on peut s’attendre à ce que le marché s’équilibre, ce qui peut nous orienter sur les futurs mouvements du prix.
📌 Fonctionnalités :
✅ Comparez deux actifs de votre choix (par défaut : BTC CME vs. BTC OANDA).
✅ Affiche le spread en temps réel directement sur le graphique.
✅ Définissez un seuil d’alerte pour être notifié visuellement sur le graphique si le spread dépasse une certaine valeur.
✅ Alerte visuelle : le label change de couleur et une icône d’alerte apparaît en cas de dépassement.
✅ Ajustez la position du label pour éviter qu’il ne cache les mèches des bougies.
🛠️ Comment l’utiliser :
1️⃣ Choisissez l’actif à comparer (exemple : BTC CME).
2️⃣ Sélectionnez ensuite l’actif affiché sur votre graphique principal (exemple : BTC OANDA).
3️⃣ Définissez le seuil d’alerte (valeur du spread qui déclenchera une alerte).
4️⃣ Ajustez la position du label grâce aux options d’offset si nécessaire.
5️⃣ Si le spread dépasse le seuil, une alerte visuelle apparaîtra !

Normalised Price Crossover - MACD but TickersEver noticed two different tickers are correlated yet have different lags? Ever find one ticker moves first and when the other finally goes to catch up, the first one has already reversed?
So I thought to myself, would be wicked if I took the faster one and made it into a 'Signal Line' and the slow one and made it into a 'Slow Line' almost like a MACD if you will.
So that's what I did, I took the price charts of the tickers and I normalised the price data so they could actually cross, plotted it and sat back to see it generate signals, lo and behold!
Pretty neat, though I'd advise to use spreads and such for the different tickers to really feel the power of the indicator, works well when you use formulas that model actual mechanisms instead of arbitrary price data of different assets as correlation =/= causation.
Enjoy.

Cumulative New Highs - New Lows IndicatorThis indicator is designed to track market momentum by calculating and plotting the cumulative sum of 52 weeks High-Low for different indices, alongside a customizable moving average.
Index Selection:
Users can choose from multiple indices, including:
Total Stock Market (default)
NYSE Composite
Nasdaq Composite
S&P 500
Nasdaq 100
Russell 2000
Moving Average Customization:
The script allows you to select between a Simple Moving Average (SMA) or an Exponential Moving Average (EMA) for smoothing the cumulative data. The window length of the moving average is also adjustable, letting you tailor the sensitivity of the trend analysis.
Dynamic Background Plotting:
With the background plot option enabled, the indicator changes the chart's background color dynamically:
Green: When the cumulative sum is above its moving average, suggesting bullish momentum.
Red: When it is below the moving average, indicating bearish conditions.
Visual Representation:
Two key lines are plotted:
Cumulative Index Line: Displayed in a subtle blue, representing the aggregated market movement.
Moving Average Line: Shown in an orange tone, offering a smoothed perspective that aids in identifying trend shifts.
Inspiration:
I took inspiration from the indicator made by YoxTrades (I can't put links, but you can check their profile) and added a few features I wanted on top of it.

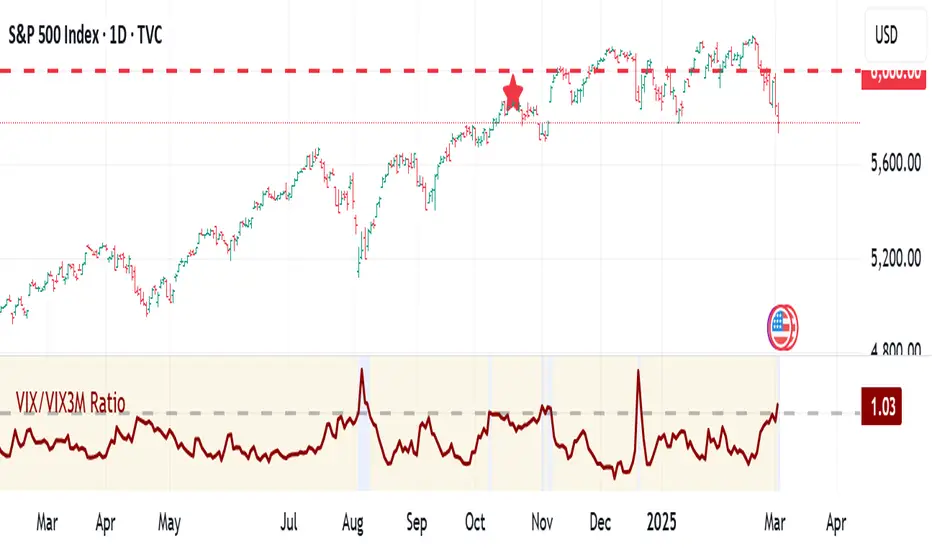
VIX:VIX3M RatioThe VIX/VIX3M Ratio indicator compares the short-term (1-month) volatility index (VIX) to the medium-term (3-month) volatility index (VIX3M). This ratio provides insights into the market's volatility expectations across different time horizons.
Key Interpretations:
Ratio > 1: Short-term volatility expectations are higher than 3-month expectations
Ratio = 1: Short-term and medium-term volatility expectations are aligned
Ratio < 1: Medium-term volatility expectations are higher than short-term expectations
Potential Trading Insights:
A rising ratio may indicate increasing near-term market uncertainty
Significant deviations from 1.0 can signal potential market stress or changing risk perceptions
Traders use this to gauge the term structure of market volatility
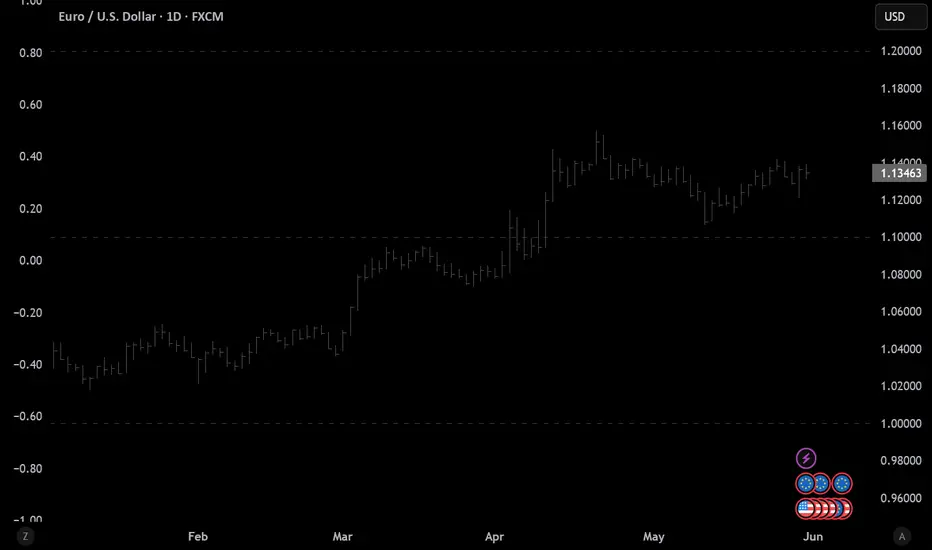
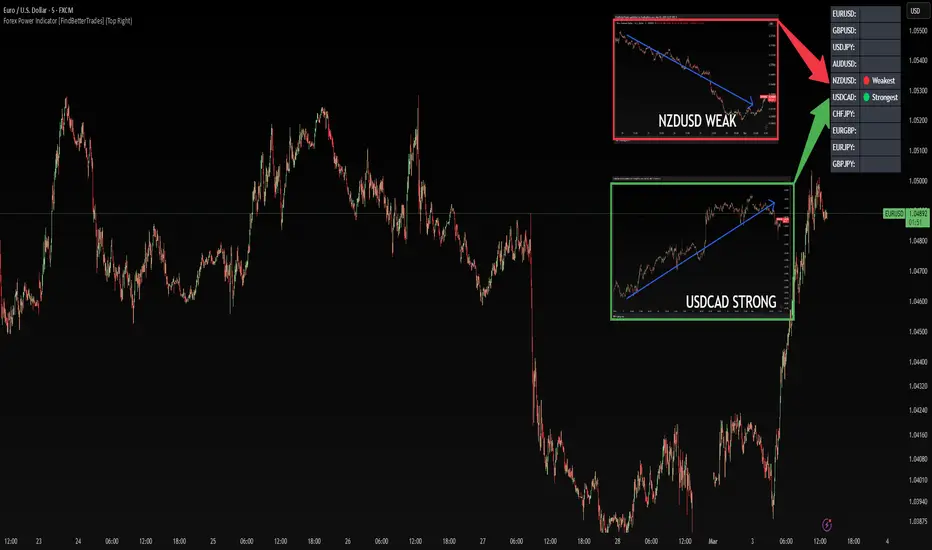
Forex Power Indicator [FindBetterTrades]The Forex Power Indicator is designed to help traders quickly assess the relative strength and weakness of key forex pairs over a set period.
This tool calculates the percentage change in price over the last 5 days and highlights the strongest and weakest performing pairs in a simple table format.
Features:
Scans 10 major forex pairs (EURUSD, GBPUSD, USDJPY, AUDUSD, NZDUSD, USDCAD, CHFJPY, EURGBP, EURJPY, GBPJPY).
Calculates the percentage change over the last 5 days.
Identifies and labels the strongest and weakest pair based on performance.
Displays results in a customizable table, allowing traders to quickly interpret market trends.
How to Use:
The strongest pair (🟢) indicates the currency with the highest performance in the selected period.
The weakest pair (🔴) shows the currency that has lost the most value.
Alerts feature:
Once you add the script to your chart, go to "Create Alert"
Under "Condition", select "Forex Power Indicator ".
The system will use the messages set in the alert() function.
When triggered, the alert will display the message like:
"New strongest currency pair: USDJPY"
"New weakest currency pair: AUDUSD"
Use this information to spot momentum opportunities, potential reversals, or trend continuations in forex trading.
This indicator is for informational purposes only and should be used alongside other technical analysis tools to support trading decisions.
MTF Sentiment ProMTF Sentiment Pro - Advanced Multi-Timeframe Analysis
Purpose & Methodology
MTF Sentiment Pro provides traders with comprehensive market sentiment analysis across multiple timeframes. This indicator's unique innovation is its weighted scoring system that evaluates both technical indicators and volume metrics to determine market sentiment across customizable timeframes.
Unlike simple indicator overlays or basic multi-timeframe tools, this indicator:
1. Calculates sentiment using a proprietary weighted formula across 7 different timeframes
2. Incorporates volume confirmation to validate price movements (a critical element often overlooked)
3. Provides clear visualization of sentiment alignment between lower and higher timeframes
4. Uses majority-rule algorithms for overall sentiment determination (2/3 rule for LTF, 3/4 rule for HTF)
Technical Components & Integration
Each timeframe's sentiment score is derived from a combination of:
- **EMA**: Evaluates trend direction and price position relative to moving average
- **RSI**: Measures momentum with sensitivity to the 50-level for trend determination
- **MACD**: Assesses trend strength and momentum through histogram analysis
- **Bollinger Bands**: Determines price volatility and position relative to the mean
- **VWAP**: Provides volume-adjusted price reference
- **OBV**: Confirms price moves with cumulative volume analysis
What makes this combination powerful is how these components are integrated:
- Each indicator contributes a weighted value to the overall sentiment score
- User-definable weights allow customization based on strategy preferences
- Volume confirmation adds a critical dimension beyond basic price-only indicators
- Multi-timeframe analysis helps identify alignment/divergence across time horizons
Trading Applications & Limitations
This indicator works best for:
- Trend confirmation across multiple timeframes
- Identifying potential reversal zones where LTF and HTF sentiments diverge
- Entry/exit timing when paired with your primary strategy rules
- Market structure analysis across different time horizons
Note: While this indicator provides comprehensive sentiment analysis, it should be used as part of a complete trading strategy with proper risk management. No indicator can predict market movements with certainty.
Usage Instructions
1. Select appropriate timeframes for your trading style or use one of the included presets
2. Adjust indicator weights to match your analytical preferences
3. Look for timeframe alignment/divergence to identify potential opportunities
4. Use the overall LTF and HTF sentiment readings for broader market context
This indicator was developed to solve the challenge of efficiently analyzing sentiment across multiple timeframes while incorporating volume confirmation - something that would otherwise require multiple indicators and manual correlation.

ICT Session by LasinsName: ICT Session by Lasins
Purpose: To visually identify and differentiate between the Asian, London, and New York trading sessions on the chart.
Features:
Highlights the background of the chart during each session.
Includes a mini dashboard in the top-right corner to show the active session.
Allows customization of time zones (exchange timezone or UTC).
Displays copyright and author information.
Key Components
Inputs:
useExchangeTimezone: A boolean input to toggle between using the exchange timezone or UTC for session times.
showDashboard: A boolean input to toggle the visibility of the mini dashboard.
Session Times:
The script defines three trading sessions:
Asian Session: 2000-0000 UTC (or adjusted for exchange timezone).
London Session: 0200-0500 UTC (or adjusted for exchange timezone).
New York Session: 0700-1000 UTC (or adjusted for exchange timezone).
Session Detection:
The is_session function checks if the current time falls within a specified session using the time function.
Background Coloring:
The bgcolor function is used to highlight the chart background during each session:
Asian Session: Red background.
London Session: Green background.
New York Session: Blue background.
Mini Dashboard:
A table is created in the top-right corner of the chart to display the active session and its corresponding color.
The dashboard includes:
A header row with "Session" and "Color".
Rows for each session (Asian, London, New York) with their respective colors.
Copyright and Author Information:
A label is added to the chart to display the copyright and author information ("© ICT Session by Lasins Raj").
How It Works
The script checks the current time and compares it to the predefined session times.
If the current time falls within a session, the chart background is highlighted with the corresponding color.
The mini dashboard updates to reflect the active session.
The copyright and author information is displayed at the bottom of the chart.
Customization
You can adjust the session times in the script to match your preferred timezone or trading hours.
The useExchangeTimezone input allows you to switch between UTC and the exchange timezone.
The showDashboard input lets you toggle the visibility of the mini dashboard.
Example Use Case
Traders who follow the ICT (Inner Circle Trader) methodology can use this indicator to identify key trading sessions and plan their trades accordingly.
The visual representation of sessions helps traders quickly recognize when major markets are open and active.

Ragi's Divergence HelperThis is Ragi's Divergence Helper is a TradingView indicator designed to track bullish and bearish divergences across multiple timeframes. It provides a clear, structured dashboard that remains fixed in a chosen corner of the chart for easy visibility.
Recommendations:
Put dashboard on lower left corner is less obstructive.
Use along with any RSI indicator for confirmations of bullish and bearish divergences.
Key Features:
✅ Timeframe Coverage: Monitors 5m, 10m, 15m, 30m, 1H, 2H, 4H, and Daily timeframes.
✅ Divergence Detection: Identifies whether a bullish (green) or bearish (red) divergence is present on each timeframe, displaying "None" if no divergence is detected.
✅ Divergence Lineup: Summarizes the overall market direction by checking if multiple timeframes align bullish or bearish.
✅ Customizable Settings: Users can adjust colors, panel position (Top Right, Bottom Right, Bottom Left, Top Left), and background color for better chart integration.
✅ Fixed & Readable Panel: Ensures the information is always visible without interfering with price action analysis.
How to Use It:
If multiple timeframes show bullish divergences, it may indicate a potential trend reversal or continuation to the upside.
If multiple timeframes show bearish divergences, it may signal a possible price drop or reversal downward.
When no divergences are present, it suggests no immediate divergence-based trading opportunity.
This indicator is ideal for traders looking for quick divergence insights across different timeframes without needing to analyze multiple indicators manually. 🚀

Volume Stack US Top 40 [Pt]█ Overview
Volume Stack US Top 40 is a versatile TradingView indicator designed to give you an at-a-glance view of market sentiment and volume dynamics across the top 40 U.S. large-cap stocks. Inspired by the popular Saty Volume Stack, this enhanced version aggregates essential volume and price strength data from major tickers on both the NYSE and NASDAQ, and works seamlessly on all timeframes.
█ Key Features
Dynamic Buy / Sell Volume Stack: This indicator dynamically stacks the volume bars so that the side with higher volume appears on top. For example, green over red signals more buy-side volume, while red over green indicates greater sell-side volume.
Cross-Market Analysis: Easily toggle between NYSE and NASDAQ to analyze the most influential U.S. stocks. The indicator automatically loads the correct set of tickers based on your selection.
Flexible Coverage: Choose from Top 10, Top 20, Top 30, or Top 40 tickers to tailor the tool to your desired scope of analysis.
Dynamic Table Display: A neat on-chart table lists the selected ticker symbols along with visual cues that reflect each stock’s strength. You can even remove exchange prefixes for a cleaner look.
█ Inputs & Settings
Market Selector: Choose whether to view data from the NYSE or NASDAQ; the indicator automatically loads the corresponding list of top tickers.
Number of Tickers: Select from ‘Top 10’, ‘Top 20’, ‘Top 30’, or ‘Top 40’ stocks to define the breadth of your analysis.
Color Options: Customize the colors for bullish and bearish histogram bars to suit your personal style.
Table Preferences: Adjust the on-chart table’s display style (grid or one row), text size, and decide whether to show exchange information alongside ticker symbols.
█ Usage & Benefits
Volume Stack US Top 40 is ideal for traders and investors who need a clear yet powerful tool to gauge overall market strength. By combining volume and price action data across multiple major stocks, it helps you:
Quickly assess whether the market sentiment is bullish or bearish.
Confirm trends by comparing volume patterns against intraday price movements.
Enhance your trading decisions with a visual representation of market breadth and dynamic buy/sell volume stacking.
Its intuitive design means you spend less time adjusting complex settings and more time making confident, informed decisions.

Color Code OverlayColor Code Overlay Indicator
The Color Code Overlay indicator is designed to provide a dynamic visualization of price action using color-coded candles. This overlay highlights trend reversals and bullish/bearish conditions by utilizing a custom candle calculation and the Average True Range (ATR) percentage threshold to detect significant price changes.
Key Features:
Custom Candle Calculation:
The Color Code Overlay is based on a modified candlestick calculation that takes the average of the open, high, low, and close prices to determine the candle’s close value. The open value is derived from the midpoint of the current candle's open and close or the previous Color Code Overlay close. The high and low values are based on the highest and lowest prices between the open, close, and the actual market high/low.
Color-Coding:
Green: The candle is colored green when the close is higher than the open, indicating a bullish trend.
Red: The candle is colored red when the close is lower than the open, indicating a bearish trend.
Color Change Detection:
The indicator detects significant color changes, signaling trend reversals. The transitions are determined based on the following conditions:
A bullish to bearish change (green to red) is identified when the current candle's close is lower than the open, and the price difference exceeds 1% of the candle's range (calculated using the current candle's high and low).
A bearish to bullish change (red to green) occurs when the current candle’s close is higher than the open, and the price difference also exceeds 1% of the candle's range.
Threshold Calculation:
The dynamic threshold for detecting significant price changes is based on the ATR percentage of the candle's range. By default, the indicator uses 1% of the range for detecting meaningful price movement. This ensures that only substantial changes trigger the color shifts, providing clear signals for potential trend reversals or market momentum.
Arrows for Color Changes:
A red triangle down is plotted above the bar when the color changes from green to red (bullish to bearish).
A green triangle up is plotted below the bar when the color changes from red to green (bearish to bullish).
Alerts:
The indicator includes alert conditions that notify you when:
The price is bullish (green candle).
The price is bearish (red candle).
There is a change from green to red (bullish to bearish).
There is a change from red to green (bearish to bullish).
How It Works:
The Color Code Overlay dynamically calculates the candle values based on market data and applies the ATR-based threshold to identify color changes. A shift from bullish to bearish or vice versa is only triggered when the price moves significantly beyond the calculated threshold, helping to avoid false signals from minor price fluctuations.
This indicator is particularly useful for traders looking to spot trend reversals and significant market shifts with a clear, color-coded visual representation of price action. The Color Code Overlay can be used alongside other technical indicators to enhance decision-making and improve trading strategies.
