TICK Bias Timer with EMA Position📌 Description
This indicator tracks the time in minutes that the Exponential Moving Average (EMA) of the NYSE USI:TICK remains above or below the zero line. It serves as a powerful market breadth confirmation tool to support your intraday directional bias.
Rather than focusing on momentary TICK spikes, this tool emphasizes duration and persistence of buying/selling pressure across the entire NYSE – helping traders stay on the right side of the flow.
🔧 Features
✅ Measures how long the EMA of TICK stays above or below 0
✅ Visual plots of upward and downward pressure duration (in minutes)
✅ Background color changes based on EMA position relative to 0
✅ Automatic daily reset at a customizable time (e.g. 15:30 for RTH open)
✅ Gap filter to avoid spikes during overnight or weekend sessions
✅ Clean, minimalist design – built for real-time decision making
🎯 How to Use
EMA > 0 for 10+ minutes → sustained bullish breadth → intraday bullish bias
EMA < 0 for 10+ minutes → sustained bearish breadth → intraday bearish bias
Frequent flip between sides → uncertain or choppy market → trade with caution
Can be used in confluence with Volume Profile, VWAP, price action, and Bookmap to reinforce trade setups.
💡 Ideal For:
Scalpers looking for flow confirmation
Day traders who want to filter fake strength/weakness
Professionals using TICK, USI:ADD , USI:VOLD , and other internals for decision-making
Sentiment

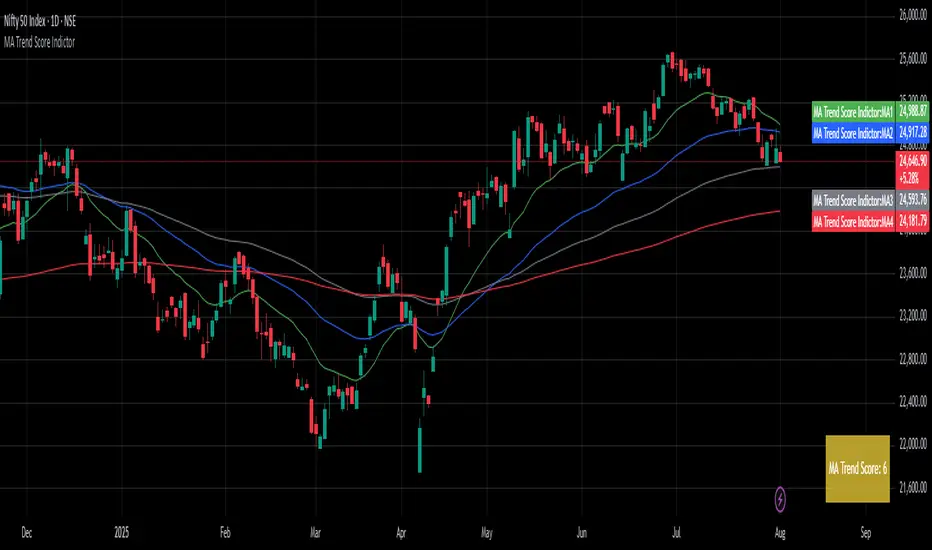
MA Trend ScoreA Trend Score Indicator inspired by an interview by Navy Ramavat, where I liked the idea presented and decided to publish a script for it.
Disclaimer: I am not associated with Navy Ramavat in any manner.
The goal is to objectify the trend of an instrument and calculate a score which represents the trend strength and direction.
The score is calculated as follows:
If price is > EMA 20 add 1 to the score
If price is > EMA 50 add 1 to the score
If price is > EMA 100 add 1 to the score
If EMA 20 is > EMA 50 add 1 to the score
If EMA 20 is > EMA 100 add 1 to the score
If EMA 50 is > EMA 100 add 1 to the score
If EMA 20 is < EMA 50 deduct 1 from the score
If EMA 20 is < EMA 100 deduct 1 from the score
If EMA 50 is < EMA 100 deduct 1 from the score
The highest score can be 6, and lowest score can be -6
The trend score can be used as per your discretion on the long and short side.
An example of using the trend score on the long side for position sizing is:
100% position size if Score greater than 4
75% position size if Score between 2-4
50% position size if Score between 0-2
25% position size if Score between 0 and -2
0% position size if Score is less than -2
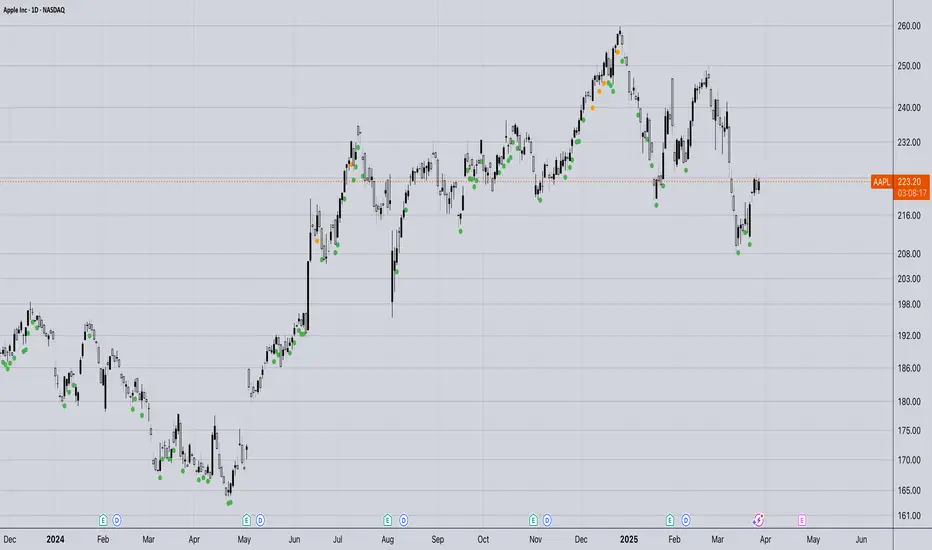
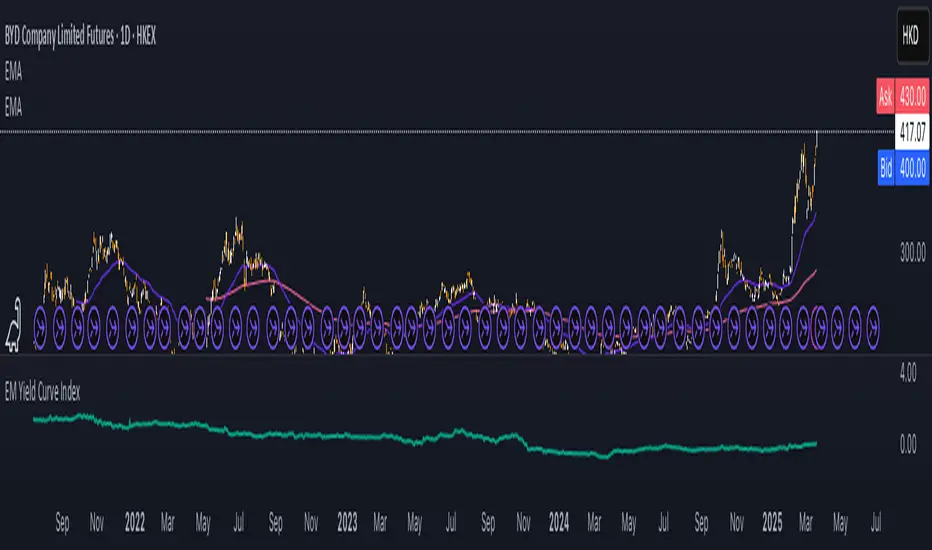
Ranked Parabolic Curve Detector (Adaptive + Reversion Aware)The Parabolic Curve Detector is a smart, adaptable trading signal engine designed to help you spot true momentum — not the flashy head-fakes, but sustained, accelerating moves that have the potential to go parabolic. Whether you’re new to trading or looking to sharpen your edge, this tool combines a suite of time-tested and modern techniques into one unified signal, all while adjusting to changing market conditions.
The core idea is simple: detect when price is not just rising, but accelerating, like a curve bending upward. To do that, the script analyzes the log of price and calculates both:
Slope1: how fast the price is moving (momentum)
Slope2: how fast that momentum is changing (acceleration)
Over a user-defined number of bars (which amounts to sensitivity ), the script checks for consistency. So, for example, if both slope1 and slope2 have been positive for 4 bars, that’s a strong signal.
But it doesn’t stop there.
The key is weighted Intelligence
What makes this tool uniquely customizable is that each layer of signal logic is weighted:
Slope1 and Slope2: You can assign how much these matter (e.g., 60% for slope1, 20% for slope2)
Ichimoku Trend Filter: A bullish setup (Tenkan > Kijun) can contribute to the total score
RSI Context: The indicator checks for overextension (RSI > 70 and falling) and mean-reversion potential (RSI < 45 and rising), adjusting scores accordingly
You can fine-tune these weights to match your trading style — whether you prefer to catch early momentum, ride mature trends, or fade reversals.
Finally, there is adaptive Intelligence . This isn’t a static signal. The indicator auto-adjusts its strictness using:
Slope Flip Rate: If price changes direction frequently, the required bar count increases
Volatility (ATR): In volatile markets, the threshold for signal confirmation tightens to avoid noise
You can turn this adaptive behavior on or off. When enabled, it makes the script self-tuning across timeframes — more reactive on clean moves, more skeptical in chop.
How to Use It
Start on a log-scaled daily chart
Enable the indicator and optionally turn on Adaptive Sensitivity
Look for:
Green Circles = bullish signal with favorable RSI + trend
Orange Circles = still bullish, but possibly overextended
For bearish setups, enable Parabolic Drops in settings
I am still experimenting with it, so if you find a better way to use it, let us know!
My suggested tweaks :
sensitivity: 3–5 for normal, higher for stricter
signalThreshold: 0.7–0.85 depending on how picky you want to be
Weights for slope1/slope2/trend
RSI boost/penalty levels
Sentiment OscillatorIn the complex world of trading, understanding market sentiment can be like reading the emotional pulse of financial markets. Our Sentiment Oscillator is designed to be your personal market mood translator, helping you navigate through the noise of price movements and market fluctuations.
Imagine having a sophisticated tool that goes beyond traditional price charts, diving deep into the underlying dynamics of market behavior. This indicator doesn't just show you numbers – it tells you a story about market sentiment, combining multiple financial signals to give you a comprehensive view of potential market directions.
The Sentiment Oscillator acts like a sophisticated emotional barometer for stocks, cryptocurrencies, or any tradable asset. It analyzes price changes, market volatility, trading volume, and long-term trends to generate a unique sentiment score. This score ranges from highly bullish to deeply bearish, providing traders with an intuitive visual representation of market mood.
Green zones indicate positive market sentiment, suggesting potential buying opportunities. Red zones signal caution, hinting at possible downward trends. The oscillator's gray neutral zone helps you identify periods of market uncertainty, allowing for more calculated trading decisions.
What sets this indicator apart is its ability to blend multiple market factors into a single, easy-to-understand indicator. It's not just about current price – it's about understanding the deeper currents moving beneath the surface of market prices.
Traders can use this oscillator to:
- Identify potential trend reversals
- Understand market sentiment beyond price movement
- Spot periods of market strength or weakness
- Complement other technical analysis tools
Whether you're a day trader, swing trader, or long-term investor, the Sentiment Oscillator provides an additional layer of insight to support your trading strategy. Remember, no indicator is a crystal ball, but this tool can help you make more informed decisions in the dynamic world of trading.

Relative Crypto Dominance Polar Chart [LuxAlgo]The Relative Crypto Dominance Polar Chart tool allows traders to compare the relative dominance of up to ten different tickers in the form of a polar area chart, we define relative dominance as a combination between traded dollar volume and volatility, making it very easy to compare them at a glance.
🔶 USAGE
The use is quite simple, traders just have to load the indicator on the chart, and the graph showing the relative dominance will appear.
The 10 tickers loaded by default are the major cryptocurrencies by market cap, but traders can select any ticker in the settings panel.
Each area represents dominance as volatility (radius) by dollar volume (arc length); a larger area means greater dominance on that ticker.
🔹 Choosing Period
The tool supports up to five different periods
Hourly
Daily
Weekly
Monthly
Yearly
By default, the tool period is set on auto mode, which means that the tool will choose the period depending on the chart timeframe
timeframes up to 2m: Hourly
timeframes up to 15m: Daily
timeframes up to 1H: Weekly
timeframes up to 4H: Monthly
larger timeframes: Yearly
🔹 Sorting & Sizing
Traders can sort the graph areas by volatility (radius of each area) in ascending or descending order; by default, the tickers are sorted as they are in the settings panel.
The tool also allows you to adjust the width of the chart on a percentage basis, i.e., at 100% size, all the available width is used; if the graph is too wide, just decrease the graph size parameter in the settings panel.
🔹 Set your own style
The tool allows great customization from the settings panel, traders can enable/disable most of the components, and add a very nice touch with curved lines enabled for displaying the areas with a petal-like effect.
🔶 SETTINGS
Period: Select up to 5 different time periods from Hourly, Daily, Weekly, Monthly and Yearly. Enable/disable Auto mode.
Tickers: Enable/disable and select tickers and colors
🔹 Style
Graph Order: Select sort order
Graph Size: Select percentage of width used
Labels Size: Select size for ticker labels
Show Percent: Show dominance in % under each ticker
Curved Lines: Enable/disable petal-like effect for each area
Show Title: Enable/disable graph title
Show Mean: Enable/disable volatility average and select color

Volume Pro Indicator## Volume Pro Indicator
A powerful volume indicator that visualizes volume distribution across different price levels. This tool helps you easily identify where trading activity concentrates within the price range.
### Key Features:
- **Volume visualization by price levels**: Green (lower zone), Magenta (middle zone), Cyan (upper zone)
- **VPOC (Volume Point of Control)**: Shows the price level with the highest volume concentration
- **High and Low lines**: Highlights the extreme levels of the analyzed price range
- **Customizable historical analysis**: Configurable number of days for calculation
### How to use it:
- Colored volumes show where trading activity concentrates within the price range
- The VPOC helps identify the most significant price levels
- Different colors allow you to quickly visualize volume distribution in different price areas
Customizable with numerous options, including analysis period, calculation resolution, colors, and visibility of different components.
### Note:
This indicator works best on higher timeframes (1H, 4H, 1D) and liquid markets. It's a visual analysis tool that enhances your understanding of market structure.
#volume #vpoc #distribution #volumeprofile #trading #analysis #indicator #professional #pricelevels #volumedistribution

Cumulative Histogram TickThis script is designed to create a cumulative histogram based on tick data from a specific financial instrument. The histogram resets at the start of each trading session, which is defined by a fixed time.
Key Components:
Tick Data Retrieval:
The script fetches the closing tick values from the specified instrument using request.security("TICK.NY", timeframe.period, close). This line ensures that the script works with the tick data for each bar on the chart.
Session Start and End Detection:
Start Hour: The script checks if the current bar's time is 9:30 AM (hour == 9 and minute == 30). This is used to reset the cumulative value at the beginning of each trading session.
End Hour: It also checks if the current bar's time is 4:00 PM (hour == 16). However, this condition is used to prevent further accumulation after the session ends.
Cumulative Value Management:
Reset: When the start hour condition is met (startHour), the cumulative value (cumulative) is reset to zero. This ensures that each trading session starts with a clean slate.
Accumulation: For all bars that are not at the end hour (not endHour), the tick value is added to the cumulative total. This process continues until the end of the trading session.
Histogram Visualization:
The cumulative value is plotted as a histogram using plot.style_histogram. The color of the histogram changes based on whether the cumulative value is positive (green) or negative (red).
Usage
This script is useful for analyzing intraday market activity by visualizing the accumulation of tick data over a trading session. It helps traders identify trends or patterns within each session, which can be valuable for making informed trading decisions.

HEMA Trend Levels [AlgoAlpha]OVERVIEW
This script plots two Hull-EMA (HEMA) curves to define a color-coded dynamic trend zone and generate context-aware breakout levels, allowing traders to easily visualize prevailing momentum and identify high-probability breakout retests. The script blends smoothed price tracking with conditional box plotting, delivering both trend-following and mean-reversion signals within one system. It is designed to be simple to read visually while offering nuanced trend shifts and test confirmations.
█ CONCEPTS
The Hull-EMA (HEMA) is a hybrid moving average combining the responsiveness of short EMAs with the smoothness of longer ones. It applies layered smoothing: first by subtracting a full EMA from a half-length EMA (doubling the short EMA's weight), and then by smoothing the result again with the square root of the original length. This process reduces lag while maintaining clarity in direction changes. In this script, two HEMAs—fast and slow—are used to define the trend structure and trigger events when they cross. These crossovers generate "trend shift boxes"—temporary support or resistance zones drawn immediately after trend transitions—to detect price retests in the new direction. When price cleanly retests these levels, the script marks them as confirmations with triangle symbols, helping traders isolate better continuation setups. Color-coded bars further enhance visual interpretation: bullish bars when price is above both HEMAs, bearish when below, and neutral (gray) when indecisive.
█ FEATURES
Bullish and bearish bar coloring based on price and HEMA alignment.
Box plotting at each crossover (bullish or bearish) to create short-term decision zones.
Real-time test detection: price must cleanly test and bounce from box levels to be considered valid.
Multiple alert conditions: crossover alerts, test alerts, and trend continuation alerts.
█ USAGE
Use this indicator on any time frame and asset. Adjust HEMA lengths to match your trading style—shorter lengths for scalping or intraday, longer for swing trading. The shaded area between HEMAs helps visually define the current trend. Watch for crossovers: a bullish crossover plots a green support box just below price, and a bearish one plots a red resistance box just above. These zones act as short-term decision points. When price returns to test a box and confirms with strong rejection (e.g., closes above for bullish or below for bearish), a triangle symbol is plotted. These tests can signal strong trend continuation. For traders looking for clean entries, combining the crossover with a successful retest improves reliability. Alerts can be enabled for all key signals: trend shift, test confirmations, and continuation conditions, making it suitable for automated setups or discretionary traders tracking multiple charts.

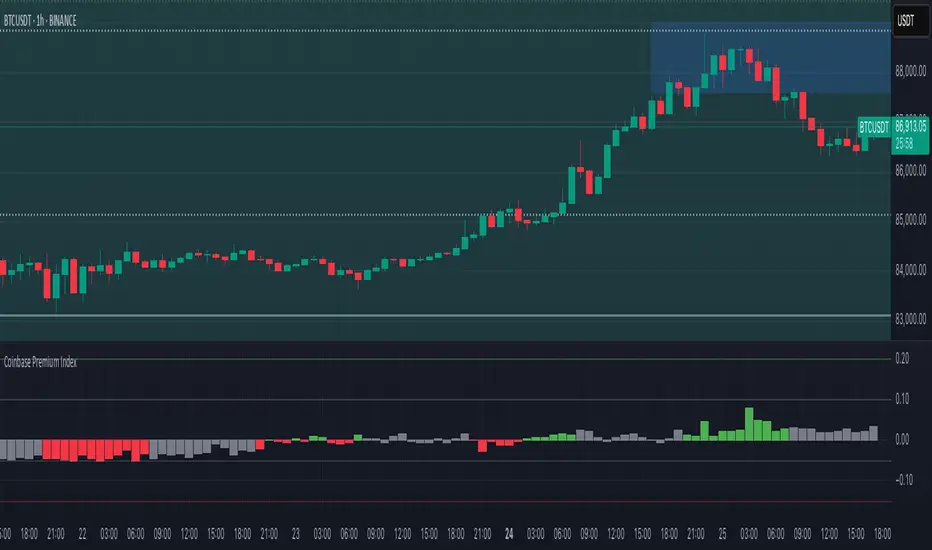
Coinbase Premium IndexThe Coinbase Premium Index is a measure of the percentage difference between the price of any coin on Coinbase Pro (USD pair) and the price on Binance (USDT trading pair). It helps differentiate between global and US-specific market sentiment
Major benefits:
Choose between USD or USDC for the Coinbase pair — they can behave differently in rare but actionable situations.
Apply it to any coin, not just BTC. Open any USDT-based chart on any exchange, and the script will automatically compare it with Coinbase’s USD or USDC price.
Highlight only active U.S. trading hours, cutting out irrelevant noise.
Display key thresholds that signal buying or selling pressure.
Rotational Factor CalculationThe Rotational Factor is a simple, objective means for evaluating day timeframe attempted direction based on the market's half hour auction rotations. At any point in time during the day, the running tally can help keep general awareness for whether buyers or sellers are in control, and if a transition is taking place. It is also helpful to use as one of a handful of variables that categorize the session's Directional Performance to assist in possible direction for the next session. This method is from Dalton's Mind Over Market's book and in part helps answer the question, which way is the market trying to go? This can then be applied to the second question, is the market doing a good job in it's attempted direction? Staying aware of these two questions keeps current sentiment and expectations in check.
Calculation method
Each 30min RTH candle gets a score:
if the high is higher than the previous candle's high: +1
if the high is lower than the previous candle's high: -1
if the low is higher than the previous candle's low: +1
if the low is lower than the previous candle's low: -1
if the high (or low) of a candle is equal to the high (or low) of the previous candle: 0
The running tally intraday text is displayed in blue. Once the session closes the text is displayed in orange and remains listed over the final candle of the day for 30 days. The RTH candles are calculated until the end of the RTH session (3pm EST) even though the session's full tally is displayed over the final candle at 3:30pm EST.

Session Profile AnalyzerWhat’s This Thing Do?
Hey there, trader! Meet the Session Profile Analyzer (SPA) your new go-to pal for breaking down market action within your favorite trading sessions. It’s an overlay indicator that mixes Rotation Factor (RF), Average Subperiod Range (ASPR), Volume Value Area Range (VOLVAR), and TPO Value Area Range (TPOVAR) into one tidy little toolkit. Think of it as your market vibe checker momentum, volatility, and key levels, all served up with a grin.
The Cool Stuff It Does:
Rotation Factor (RF) : Keeps tabs on whether the market’s feeling bullish, bearish, or just chilling. It’s like a mood ring for price action shows “UP ↑,” “DOWN ↓,” or “NONE ↔.”
ASPR : Averages out the range of your chosen blocks. Big swings? Tiny wiggles? This tells you the session’s energy level.
VOLVAR : Dives into volume to find where the action’s at, with a smart twist it adjusts price levels based on the session’s size and tiny timeframe moves (capped at 128 so your chart doesn’t cry).
TPOVAR : Grabs lower timeframe data to spot where price hung out the most, TPO-style. Value zones, anyone?
Dynamic Precision : No ugly decimal overload SPA matches your asset’s style (2 decimals for BTC, 5 for TRX, you get it).
How to Play With It:
Session Start/End : Pick your trading window (say, 0930-2200) and a timezone (America/New_York, or wherever you’re at).
Block Size : Set the chunk size for RF and ASPR like 30M if you’re into half-hour vibes.
Value Area Timeframe : Go micro with something like 1S for VOLVAR and TPOVAR precision.
Label : Size it (small to huge), color it (white, neon pink, whatever), and slap it where you want (start, mid, end).
How It All Works (No PhD Required):
RF : Imagine breaking your session into blocks (via Block Size). For each block, SPA checks if the high beats the last high (+1) or not (0), and if the low dips below the last low (-1) or not (0). Add those up, and boom positive RF means upward vibes, negative means downward, near zero is “meh.” Use it to catch trends or spot when the market’s napping.
ASPR : Takes those same blocks, measures high-to-low range each time, and averages them. It’s your volatility pulse big ASPR = wild ride, small ASPR = snooze fest. Great for sizing up session action.
VOLVAR : Here’s the fun part. It takes the session’s full range (high minus low), divides it by the average range of your tiny Value Area Timeframe bars (e.g., 1S), and picks a sensible number of price levels capped at 128 so it doesn’t overthink. Then it bins volume into those levels, finds the busiest price (POC), and grows a 70% value area around it. Perfect for spotting where the big players parked their cash.
TPOVAR : Grabs midpoints from those tiny timeframe bars, sorts them, and snips off the top and bottom 15% to find the 70% “value zone” where price chilled the most. Think of it as the market’s comfort zone great for support/resistance hunting.
Why You’ll Like It:
Whether you’re scalping crypto, swinging forex, or dissecting stocks, SPA’s got your back. Use RF to catch momentum shifts like jumping on an “UP ↑” trend or fading a “DOWN ↓” exhaustion. ASPR’s your secret weapon for sizing up trades: a big ASPR (say, 100 on BTC) means you can aim for juicy targets (like 1-2x ASPR) or set invalidations tight when it’s tiny (e.g., 0.001 on TRX) to dodge chop. VOLVAR and TPOVAR are your level-finders nail those key zones where price loves to bounce or break, perfect for entries, stops, or profit grabs. It’s like having a trading co-pilot who’s chill but knows their stuff.
Heads-Up:
Load enough history for those micro timeframes to shine (1S needs some bars to work with).
Keeps things light won’t bog down your chart even with decent-sized sessions.
Let’s Roll:
Slap SPA on your chart, tweak it to your style, and watch it spill the beans on your session. Happy trading, fam may your pips be plenty and your losses few!

Moon+Lunar Cycle Vertical Delineation & Projection
Automatically highlights the exact candle in which Moonphase shifts occur.
Optionally including shifts within the Microphases of the total Lunar Cycle.
This allow traders to pre-emptively identify time-based points of volatility,
focusing on mean-reversion; further simplified via the use of projections.
Projections are calculated via candle count, values displayed in "Debug";
these are useful in understanding the function & underlying mechanics.
EM Yield Curve IndexThis script calculates the Emerging Markets (EM) Yield Curve Index by aggregating the 2-year and 10-year bond yields of major emerging economies. The bond yields are weighted based on each country's bond market size, with data sourced from TradingView. The yield curve is derived by subtracting the 2-year yield from the 10-year yield, providing insights into economic conditions, risk sentiment, and potential recessions in emerging markets. The resulting EM Yield Curve Index is plotted for visualization.
Note: In some cases, TradingView's TVC data did not provide a 2-year bond yield. When this occurred, the best available alternative yield (such as 3-month, 1-year or 4-year yields) was used to approximate the short-term interest rate for that country.
FOMO Indicator - % of Stocks Above 5-Day AvgThe FOMO Indicator plots the breadth indicators NCFD and S5FD below the price chart, representing the percentage of stocks in the Nasdaq Composite (NCFD) or S&P 500 (S5FD) trading above their respective 5-day moving averages.
This indicator identifies short-term market sentiment and investor positioning. When over 85% of stocks exceed their 5-day averages, it signals widespread buying pressure and potential FOMO (Fear Of Missing Out) among investors. Conversely, levels below 15% may indicate oversold conditions. By analyzing these breadth metrics over a short time window, the FOMO Indicator helps traders gauge shifts in investor sentiment and positioning.

Volume Profile [ActiveQuants]The Volume Profile indicator visualizes the distribution of trading volume across price levels over a user-defined historical period. It identifies key liquidity zones, including the Point of Control (POC) (price level with the highest volume) and the Value Area (price range containing a specified percentage of total volume). This tool is ideal for traders analyzing support/resistance levels, market sentiment , and potential price reversals .
█ CORE METHODOLOGY
Vertical Price Rows: Divides the price range of the selected lookback period into equal-height rows.
Volume Aggregation: Accumulates bullish/bearish or total volume within each price row.
POC: The row with the highest total volume.
Value Area: Expands from the POC until cumulative volume meets the user-defined threshold (e.g., 70%).
Dynamic Visualization: Rows are plotted as horizontal boxes with widths proportional to their volume.
█ KEY FEATURES
- Customizable Lookback & Resolution
Adjust the historical period ( Lookback ) and granularity ( Number of Rows ) for precise analysis.
- Configurable Profile Width & Horizontal Offset
Control the relative horizontal length of the profile rows, and set the distance from the current bar to the POC row’s anchor.
Important: Do not set the horizontal offset too high. Indicators cannot be plotted more than 500 bars into the future.
- Value Area & POC Highlighting
Set the percentage of total volume required to form the Value Area , ensuring that key volume levels are clearly identified.
Value Area rows are colored distinctly, while the POC is marked with a bold line.
- Flexible Display Options
Show bullish/bearish volume splits or total volume.
Place the profile on the right or left of the chart.
- Gradient Coloring
Rows fade in color intensity based on their relative volume strength .
- Real-Time Adjustments
Modify horizontal offset, profile width, and appearance without reloading.
█ USAGE EXAMPLES
Example 1: Basic Volume Profile with Value Area
Settings:
Lookback: 500 bars
Number of Rows: 100
Value Area: 70%
Display Type: Up/Down
Placement: Right
Image Context:
The profile appears on the right side of the chart. The POC (orange line) marks the highest volume row. Value Area rows (green/red) extend above/below the POC, containing 70% of total volume.
Example 2: Total Volume with Gradient Colors
Settings:
Lookback: 800 bars
Number of Rows: 100
Profile Width: 60
Horizontal Offset: 20
Display Type: Total
Gradient Colors: Enabled
Image Context:
Rows display total volume in a single color with gradient transparency. Darker rows indicate higher volume concentration.
Example 3: Left-Aligned Profile with Narrow Value Area
Settings:
Lookback: 600 bars
Number of Rows: 100
Profile Width: 45
Horizontal Offset: 500
Value Area: 50%
Profile Placement: Left
Image Context:
The profile shifts to the left, with a tighter Value Area (50%).
█ USER INPUTS
Calculation Settings
Lookback: Historical bars analyzed (default: 500).
Number of Rows: Vertical resolution of the profile (default: 100).
Profile Width: Horizontal length of rows (default: 50).
Horizontal Offset: Distance from the current bar to the POC (default: 50).
Value Area (%): Cumulative volume threshold for the Value Area (default: 70%).
Volume Display: Toggle between Up/Down (bullish/bearish) or Total volume.
Profile Placement: Align profile to the Right or Left of the chart.
Appearance
Rows Border: Customize border width/color.
Gradient Colors: Enable fading color effects.
Value Area Colors: Set distinct colors for bullish and bearish Value Area rows.
POC Line: Adjust color, width, and visibility.
█ CONCLUSION
The Volume Profile indicator provides a dynamic, customizable view of market liquidity. By highlighting the POC and Value Area, traders can identify high-probability reversal zones, gauge market sentiment, and align entries/exits with key volume levels.
█ IMPORTANT NOTES
⚠ Lookback Period: Shorter lookbacks prioritize recent activity but may omit critical levels.
⚠ Horizontal Offset Limitation: Avoid excessively high offsets (e.g., close to ±300). TradingView restricts plotting indicators more than 500 bars into the future, which may truncate or hide the profile.
⚠ Risk Management: While the indicator highlights areas of concentrated volume, always use it in combination with other technical analysis tools and proper risk management techniques.
█ RISK DISCLAIMER
Trading involves substantial risk. The Volume Profile highlights historical liquidity but does not predict future price movements. Always use stop-loss orders and confirm signals with additional analysis. Past performance is not indicative of future results.
📊 Happy trading! 🚀

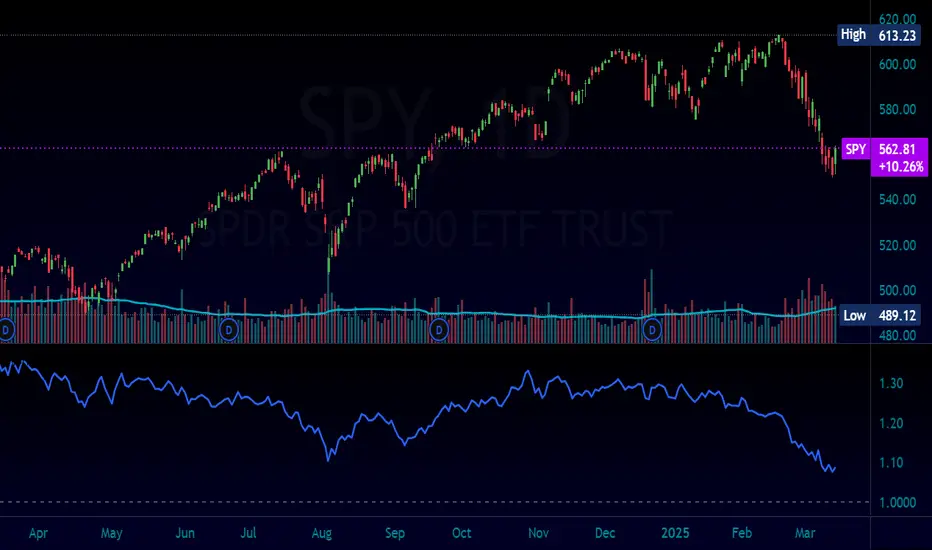
Normalized Equity/Bond RatioThis indicator calculates a normalized equity-to-bond ratio over a 252-day lookback (~1 trading year) to assess risk-on vs. risk-off sentiment. It addresses the issue of direct ratios (e.g., SPY/TLT) being visually dominated by high nominal stock prices, which can obscure bond price movements.
A rising ratio indicates equities are outperforming bonds, suggesting risk-on conditions, while a declining ratio signals a shift toward bonds, often associated with risk-off behavior. The normalization ensures better visibility and comparability of the trend over time.
A ratio > 1 means the equity (e.g., SPY) is outperforming the bond (e.g., AGG) since the lookback. A ratio < 1 means bonds are outperforming.
Display Stocks with Change%Display Stocks with Change% - Pine Script™ Indicator
Overview
The Display Stocks with Change% indicator is designed for TradingView to highlight specific stocks and their percentage change on a given date. The indicator allows users to input custom stock names, dates, and percentage changes, displaying relevant information directly on the chart. Additionally, it provides an option to connect the stock's high price with a label using customizable line styles.
Features
Custom Stock List: Users can input multiple stock names along with corresponding dates and percentage changes.
Date-Specific Highlighting: The script dynamically checks if the current bar's date matches any input date and displays relevant stock data.
Color-Coded Percentage Change: Stocks with a negative change are displayed in red, while positive or neutral changes are in black.
Connecting Lines: An option to enable or disable dotted, dashed, or solid lines connecting the stock's high price to the label.
Automatic Label Positioning: Adjusts label alignment based on recent price movement to avoid overlap and enhance visibility.
Input Parameters
COB (Close of Business Dates): A comma-separated list of dates in DD-MM-YYYY format.
Stock Names: A comma-separated list of stock tickers.
Change Percentage: Corresponding percentage changes for the listed stocks.
Show Connecting Lines: Boolean toggle to enable or disable connecting lines.
Line Color & Style: Customizable line color and style (solid, dotted, or dashed).
How It Works
Data Processing: The script splits user inputs into arrays and iterates through them.
Date Matching: It checks if the current bar's date matches any of the provided COB dates.
Label Formatting: When a match is found, it constructs a label containing the stock name and its percentage change.
Text Alignment & Factor Adjustments: Dynamically determines label positioning based on recent price movements.
Label Display: If any matching stocks are found, a label is created at the stock's high price.
Connecting Line (Optional): If enabled, a line is drawn from the stock’s high to the label for better visualization.
Key Benefits for Traders:
Track Multiple Stocks at Once – Displays stock names and their percentage changes on specific dates automatically.
Saves Time – No need to manually check historical data; the indicator overlays key stock movements.
Visual Insights – Labels & color coding (red for negative, black for positive) make it easy to spot trends.
Customizable & Automated – Add your own stocks, dates, and percentage changes; the script adjusts dynamically.
📌 Use Case Example:
You’re tracking MRPL, CARTRADE, and JSWENERGY on specific dates. Instead of digging through historical data, this indicator automatically highlights the stock’s movement on that date, allowing you to make faster, informed trading decisions.

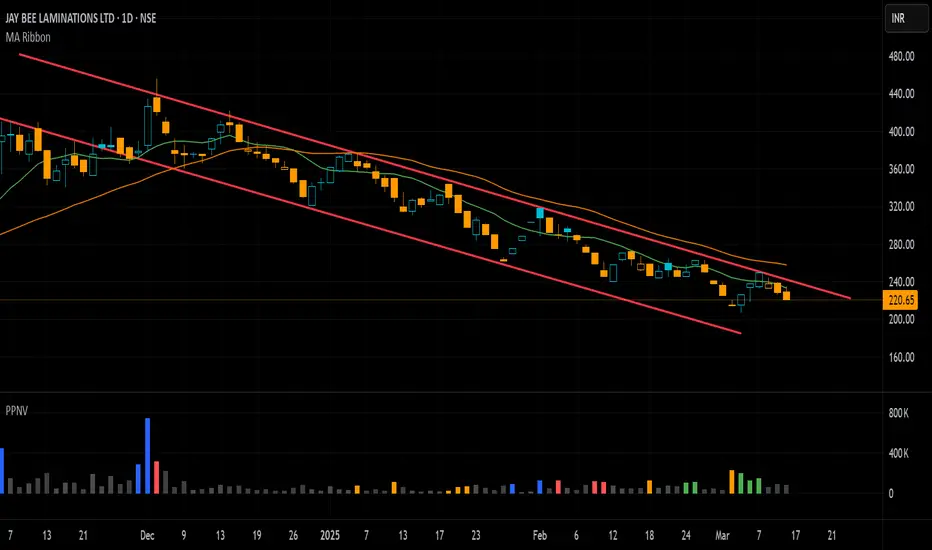
Pivot P/N VolumesTitle: Pivot P/N Volumes
Short Title: PPNV
Description:
The "Pivot P/N Volumes" indicator is a minimalistic volume analysis tool designed to cut through market noise and highlight key volume events in a separate pane. It strips away conventional volume clutter, focusing on four distinct volume types with clear visual cues, making it ideal for traders seeking actionable insights without distractions.
Key Features:
Blue Bars: Pocket Pivot Volumes (PPV) - Up-day volumes exceeding the highest down-day volume of the last 10 down-days, signaling potential bullish strength.
Orange Bars: Pivot Negative Volumes - Down-day volumes greater than the highest up-day volume of the last 10 up-days, indicating significant bearish pressure.
Red Bars: Down-day volumes above the 50-period EMA of volume, highlighting above-average selling activity.
Green Bars: Up-day volumes above the 50-period EMA of volume, showing above-average buying interest.
Noise: All other volumes are muted as dark grey (down-days) or light grey (up-days) for easy filtering.
TRP Stop-Loss and Position SizingScript is based on TRP to see both Long Stop Loss and Short Stop Loss, You can Also adjust the position size based on your capital and percentage risk.

Quantum Moving Average - QMA (TechnoBlooms)The Quantum Moving Average (QMA) is an innovative and advanced Moving Average model designed for traders seeking a more adaptive and precise trend analysis. Unlike traditional moving averages, it integrates a multi-timeframe approach, dynamically selecting and weighting four different timeframes to provide traders with more accurate and reliable trend prediction.
Key Features
Multi-Timeframe averaging
QMA calculates its value based on four different timeframes, offering a broader perspective on market trends.
Dynamic Weighting Mechanism
Unlike fixed weight Moving Averages, QMA assigns adaptive weightage to the selected timeframes, enhancing its responsiveness.
Superior Trend Detection
Provides a smoother and more reliable trend curve reducing noise or false signals.
Enhanced Market Analysis
QMA helps traders identify trend shifts earlier by incorporating multi-timeframe confluence.

ST_HTF_EMA### **ST_HTF_EMA – Higher Timeframe EMA Overlay**
#### **Description:**
The **ST_HTF_EMA** indicator plots a **21-period Exponential Moving Average (EMA)** from a **higher timeframe** onto the current chart. This allows traders to track key trend levels from a larger perspective while trading on a lower timeframe.
#### **Features:**
- **Customizable Timeframe:** The EMA is sourced from a user-defined timeframe (default: **5-minute**).
- **EMA Calculation:** Uses the **21-period EMA** for smoothing price action and identifying trend direction.
- **Envelope Bands (Optional):** A **0.75% envelope** can be toggled on to create upper and lower bands around the EMA for potential dynamic support/resistance zones.
- **Overlay on Chart:** The EMA and envelope bands are plotted directly on the price chart for easy visibility.
#### **How to Use:**
- Use the **EMA as a trend guide**—price above the EMA suggests bullish momentum, while price below indicates bearish momentum.
- Enable the **envelope bands** (if needed) to spot price deviations from the mean for possible reversal or continuation trades.
#### **Customization:**
- Modify the **timeframe** to adapt the EMA to different market structures.
- Adjust the **envelope percentage** to fine-tune sensitivity.
#### **Visuals:**
- The **EMA is plotted in yellow** for clear visibility.
- **Envelope bands (if enabled)** appear in yellow, with a subtle background highlight.
This indicator is ideal for traders who rely on **higher timeframe trend confirmation** while making decisions on lower timeframes. 🚀

[GYTS-CE] Market Regime Detector🧊 Market Regime Detector (Community Edition)
🌸 Part of GoemonYae Trading System (GYTS) 🌸
🌸 --------- INTRODUCTION --------- 🌸
💮 What is the Market Regime Detector?
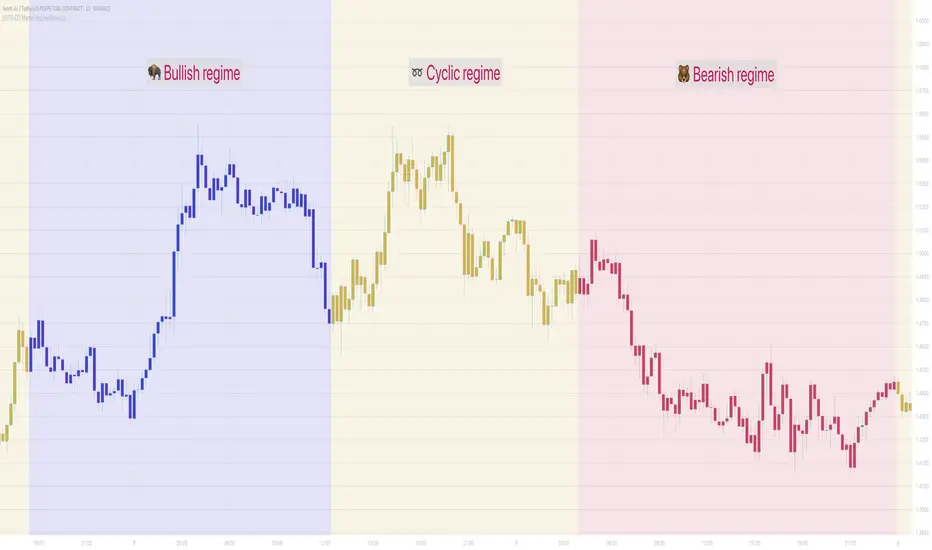
The Market Regime Detector is an advanced, consensus-based indicator that identifies the current market state to increase the probability of profitable trades. By distinguishing between trending (bullish or bearish) and cyclic (range-bound) market conditions, this detector helps you select appropriate tactics for different environments. Instead of forcing a single strategy across all market conditions, our detector allows you to adapt your approach based on real-time market behaviour.
💮 The Importance of Market Regimes
Markets constantly shift between different behavioural states or "regimes":
• Bullish trending markets - characterised by sustained upward price movement
• Bearish trending markets - characterised by sustained downward price movement
• Cyclic markets - characterised by range-bound, oscillating behaviour
Each regime requires fundamentally different trading approaches. Trend-following strategies excel in trending markets but fail in cyclic ones, while mean-reversion strategies shine in cyclic markets but underperform in trending conditions. Detecting these regimes is essential for successful trading, which is why we've developed the Market Regime Detector to accurately identify market states using complementary detection methods.
🌸 --------- KEY FEATURES --------- 🌸
💮 Consensus-Based Detection
Rather than relying on a single method, our detector employs two complementary detection methodologies that analyse different aspects of market behaviour:
• Dominant Cycle Average (DCA) - analyzes price movement relative to its lookback period, a proxy for the dominant cycle
• Volatility Channel - examines price behaviour within adaptive volatility bands
These diverse perspectives are synthesised into a robust consensus that minimises false signals while maintaining responsiveness to genuine regime changes.
💮 Dominant Cycle Framework
The Market Regime Detector uses the concept of dominant cycles to establish a reference framework. You can input the dominant cycle period that best represents the natural rhythm of your market, providing a stable foundation for regime detection across different timeframes.
💮 Intuitive Parameter System
We've distilled complex technical parameters into intuitive controls that traders can easily understand:
• Adaptability - how quickly the detector responds to changing market conditions
• Sensitivity - how readily the detector identifies transitions between regimes
• Consensus requirement - how much agreement is needed among detection methods
This approach makes the detector accessible to traders of all experience levels while preserving the power of the underlying algorithms.
💮 Visual Market Feedback
The detector provides clear visual feedback about the current market regime through:
• Colour-coded chart backgrounds (purple shades for bullish, pink for bearish, yellow for cyclic)
• Colour-coded price bars
• Strength indicators showing the degree of consensus
• Customizable colour schemes to match your preferences or trading system
💮 Integration in the GYTS suite
The Market Regime Detector is compatible with the GYTS Suite , i.e. it passes the regime into the 🎼 Order Orchestrator where you can set how to trade the trending and cyclic regime.
🌸 --------- CONFIGURATION SETTINGS --------- 🌸
💮 Adaptability
Controls how quickly the Market Regime detector adapts to changing market conditions. You can see it as a low-frequency, long-term change parameter:
Very Low: Very slow adaptation, most stable but may miss regime changes
Low: Slower adaptation, more stability but less responsiveness
Normal: Balanced between stability and responsiveness
High: Faster adaptation, more responsive but less stable
Very High: Very fast adaptation, highly responsive but may generate false signals
This setting affects lookback periods and filter parameters across all detection methods.
💮 Sensitivity
Controls how sensitive the detector is to market regime transitions. This acts as a high-frequency, short-term change parameter:
Very Low: Requires substantial evidence to identify a regime change
Low: Less sensitive, reduces false signals but may miss some transitions
Normal: Balanced sensitivity suitable for most markets
High: More sensitive, detects subtle regime changes but may have more noise
Very High: Very sensitive, detects minor fluctuations but may produce frequent changes
This setting affects thresholds for regime detection across all methods.
💮 Dominant Cycle Period
This parameter allows you to specify the market's natural rhythm in bars. This represents a complete market cycle (up and down movement). Finding the right value for your specific market and timeframe might require some experimentation, but it's a crucial parameter that helps the detector accurately identify regime changes. Most of the times the cycle is between 20 and 40 bars.
💮 Consensus Mode
Determines how the signals from both detection methods are combined to produce the final market regime:
• Any Method (OR) : Signals bullish/bearish if either method detects that regime. If methods conflict (one bullish, one bearish), the stronger signal wins. More sensitive, catches more regime changes but may produce more false signals.
• All Methods (AND) : Signals only when both methods agree on the regime. More conservative, reduces false signals but might miss some legitimate regime changes.
• Weighted Decision : Balances both methods with equal weighting. Provides a middle ground between sensitivity and stability.
Each mode also calculates a continuous regime strength value that's used for colour intensity in the 'unconstrained' display mode.
💮 Display Mode
Choose how to display the market regime colours:
• Unconstrained regime: Shows the regime strength as a continuous gradient. This provides more nuanced visualisation where the intensity of the colour indicates the strength of the trend.
• Consensus only: Shows only the final consensus regime with fixed colours based on the detected regime type.
The background and bar colours will change to indicate the current market regime:
• Purple shades: Bullish trending market (darker purple indicates stronger bullish trend)
• Pink shades: Bearish trending market (darker pink indicates stronger bearish trend)
• Yellow: Cyclic (range-bound) market
💮 Custom Colour Options
The Market Regime Detector allows you to customize the colour scheme to match your personal preferences or to coordinate with other indicators:
• Use custom colours: Toggle to enable your own colour choices instead of the default scheme
• Transparency: Adjust the transparency level of all regime colours
• Bullish colours: Define custom colours for strong, medium, weak, and very weak bullish trends
• Bearish colours: Define custom colours for strong, medium, weak, and very weak bearish trends
• Cyclic colour: Define a custom colour for cyclic (range-bound) market conditions
🌸 --------- DETECTION METHODS --------- 🌸
💮 Dominant Cycle Average (DCA)
The Dominant Cycle Average method forms a key part of our detection system:
1. Theoretical Foundation :
The DCA method builds on cycle analysis and the observation that in trending markets, price consistently remains on one side of a moving average calculated using the dominant cycle period. In contrast, during cyclic markets, price oscillates around this average.
2. Calculation Process :
• We calculate a Simple Moving Average (SMA) using the specified lookback period - a proxy for the dominant cycle period
• We then analyse the proportion of time that price spends above or below this SMA over a lookback window. The theory is that the price should cross the SMA each half cycle, assuming that the dominant cycle period is correct and price follows a sinusoid.
• This lookback window is adaptive, scaling with the dominant cycle period (controlled by the Adaptability setting)
• The different values are standardised and normalised to possess more resolving power and to be more robust to noise.
3. Regime Classification :
• When the normalised proportion exceeds a positive threshold (determined by Sensitivity setting), the market is classified as bullish trending
• When it falls below a negative threshold, the market is classified as bearish trending
• When the proportion remains between these thresholds, the market is classified as cyclic
💮 Volatility Channel
The Volatility Channel method complements the DCA method by focusing on price movement relative to adaptive volatility bands:
1. Theoretical Foundation :
This method is based on the observation that trending markets tend to sustain movement outside of normal volatility ranges, while cyclic markets tend to remain contained within these ranges. By creating adaptive bands that adjust to current market volatility, we can detect when price behaviour indicates a trending or cyclic regime.
2. Calculation Process :
• We first calculate a smooth base channel center using a low pass filter, creating a noise-reduced centreline for price
• True Range (TR) is used to measure market volatility, which is then smoothed and scaled by the deviation factor (controlled by Sensitivity)
• Upper and lower bands are created by adding and subtracting this scaled volatility from the centreline
• Price is smoothed using an adaptive A2RMA filter, which has a very flat and stable behaviour, to reduce noise while preserving trend characteristics
• The position of this smoothed price relative to the bands is continuously monitored
3. Regime Classification :
• When smoothed price moves above the upper band, the market is classified as bullish trending
• When smoothed price moves below the lower band, the market is classified as bearish trending
• When price remains between the bands, the market is classified as cyclic
• The magnitude of price's excursion beyond the bands is used to determine trend strength
4. Adaptive Behaviour :
• The smoothing periods and deviation calculations automatically adjust based on the Adaptability setting
• The measured volatility is calculated over a period proportional to the dominant cycle, ensuring the detector works across different timeframes
• Both the center line and the bands adapt dynamically to changing market conditions, making the detector responsive yet stable
This method provides a unique perspective that complements the DCA approach, with the consensus mechanism synthesising insights from both methods.
🌸 --------- USAGE GUIDE --------- 🌸
💮 Starting with Default Settings
The default settings (Normal for Adaptability and Sensitivity, Weighted Decision for Consensus Mode) provide a balanced starting point suitable for most markets and timeframes. Begin by observing how these settings identify regimes in your preferred instruments.
💮 Finding the Optimal Dominant Cycle
The dominant cycle period is a critical parameter. Here are some approaches to finding an appropriate value:
• Start with typical values, usually something around 25 works well
• Visually identify the average distance between significant peaks and troughs
• Experiment with different values and observe which provides the most stable regime identification
• Consider using cycle-finding indicators to help identify the natural rhythm of your market
💮 Adjusting Parameters
• If you notice too many regime changes → Decrease Sensitivity or increase Consensus requirement
• If regime changes seem delayed → Increase Adaptability
• If a trending regime is not detected, the market is automatically assigned to be in a cyclic state
• If you want to see more nuanced regime transitions → Try the "unconstrained" display mode (note that this will not affect the output to other indicators)
💮 Trading Applications
Regime-Specific Strategies:
• Bullish Trending Regime - Use trend-following strategies, trail stops wider, focus on breakouts, consider holding positions longer, and emphasize buying dips
• Bearish Trending Regime - Consider shorts, tighter stops, focus on breakdown points, sell rallies, implement downside protection, and reduce position sizes
• Cyclic Regime - Apply mean-reversion strategies, trade range boundaries, apply oscillators, target definable support/resistance levels, and use profit-taking at extremes
Strategy Switching:
Create a set of rules for each market regime and switch between them based on the detector's signal. This approach can significantly improve performance compared to applying a single strategy across all market conditions.
GYTS Suite Integration:
• In the GYTS 🎼 Order Orchestrator, select the '🔗 STREAM-int 🧊 Market Regime' as the market regime source
• Note that the consensus output (i.e. not the "unconstrained" display) will be used in this stream
• Create different strategies for trending (bullish/bearish) and cyclic regimes. The GYTS 🎼 Order Orchestrator is specifically made for this.
• The output stream is actually very simple, and can possibly be used in indicators and strategies as well. It outputs 1 for bullish, -1 for bearish and 0 for cyclic regime.
🌸 --------- FINAL NOTES --------- 🌸
💮 Development Philosophy
The Market Regime Detector has been developed with several key principles in mind:
1. Robustness - The detection methods have been rigorously tested across diverse markets and timeframes to ensure reliable performance.
2. Adaptability - The detector automatically adjusts to changing market conditions, requiring minimal manual intervention.
3. Complementarity - Each detection method provides a unique perspective, with the collective consensus being more reliable than any individual method.
4. Intuitiveness - Complex technical parameters have been abstracted into easily understood controls.
💮 Ongoing Refinement
The Market Regime Detector is under continuous development. We regularly:
• Fine-tune parameters based on expanded market data
• Research and integrate new detection methodologies
• Optimise computational efficiency for real-time analysis
Your feedback and suggestions are very important in this ongoing refinement process!
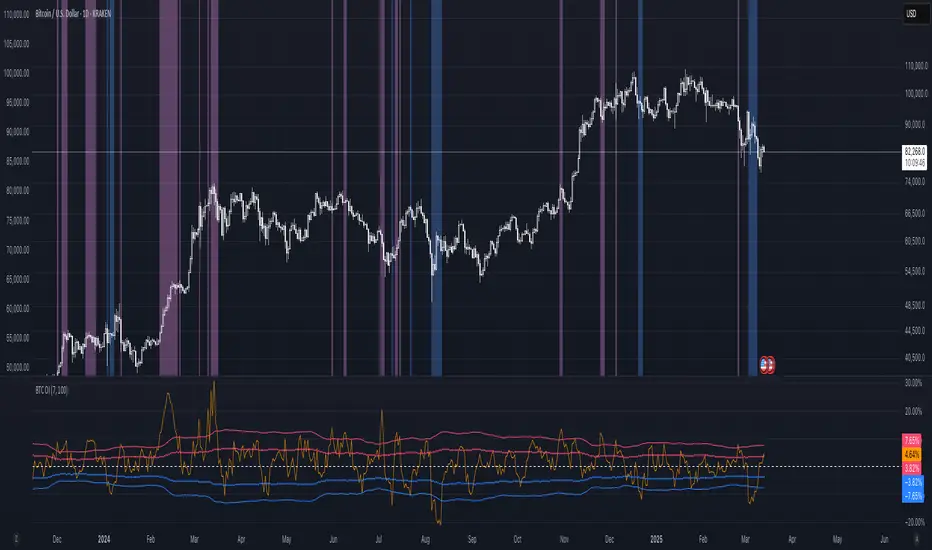
BTC: Open InterestThis indicator tracks the 7-day (default) percentage change in open interest (OI), providing insights into market participation trends. It includes customizable periods and colors, allowing traders to adjust settings for better visualization.
Open interest (OI) is the total number of active contracts (futures or options) that haven’t been closed or settled. It represents the total open positions in the market.
Thus when OI increases, more traders are entering new positions, signaling growing market interest. Conversely, when OI decreases, positions are being closed, suggesting lower trader participation or liquidation.
Attributes & Features:
Open Interest Percentage Change – Measures the 7-day % change in open interest to track market participation.
Customizable Calculation Period – Users can adjust the period (default: 7 days) for more flexible analysis.
Adjustable Colors – Allows modification of colors for better visualization.
Trend Identification – Highlights rising vs. falling open interest trends.
Works Across Assets – Can be used for cryptos, stocks, and futures with open interest data.
Overlay or Separate Panel – Can be plotted on price chart or as a separate indicator.
How It Works:
Fetches Open Interest Data – Retrieves open interest values for each day for USD, USDT, and USDC Bitcoin Perpetual Derivitives.
Calculates Percentage Change – Compares current open interest to its value X days ago (Default = 7 days).
Standard Deviation – Applies standard deviation ranging from -2 to +2 deviations to identify large shifts in OI.
Visual Alerts – Can highlight extreme increases or decreases signaling potential market shifts.
NOTE: THE INDICATOR DATA ONLY GOES BACK TO START OF 2022