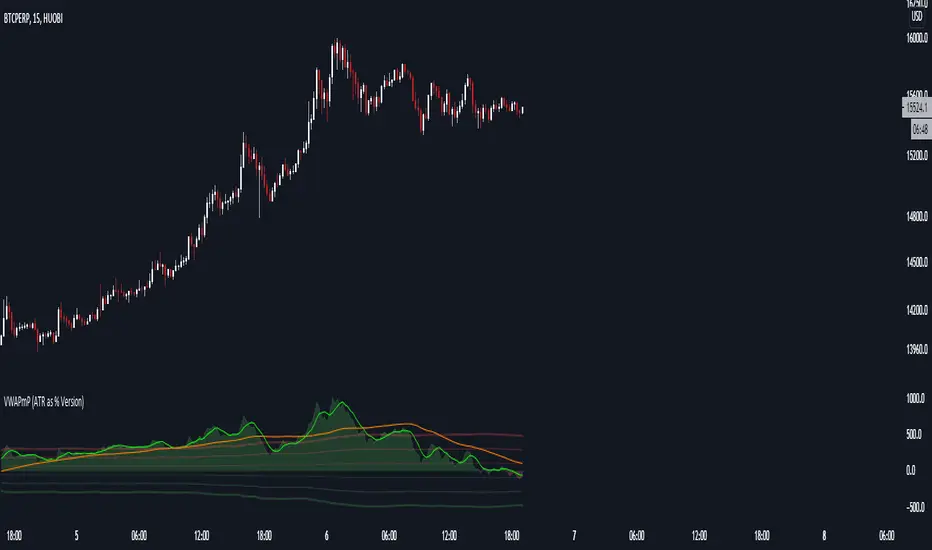
VWAPmP (ATR as % Version)This indicator displays a histogram for the distance of closing price from a VWAP value. The VWAP length is rolling and its value is user defined. Additionally, there are 3 bands which are based on the %-value of the underlying ATR. The ATR's length can be chosen by the user, and the distance multipliers may also be chosen. Lastly, there are two simple moving averages which have user-defined lengths and are based on the histograms value.
스크립트에서 "vwap"에 대해 찾기
VWAP+SMA+EMAThis is the only indicator combing the results of VWAP + 2 SMAs + 2 EMAs.
This is a free indicator. Enjoy using it.
Kunal Jain
VWAP - Standard + 3 multi periodThis script combines the standard VWAP with 3 additional period-dependent VWAPs (originally coded by Neolao).

rth vwap and midMidpoint and VWAP are often important inflection points in daytrading. I managed to find a script providing me with a 24 hour session midline by NorthStarDayTrading and a RTH VWAP script by LDBC. So I decided to merge those two to get a RTH mid and vwap.

Rumpy's Donchian Anchored VWAPUses donchian points to anchor VWAPs (start a new VWAP interval). The defaults are set up for a 1H chart, with lookback periods of 1 day, 2 days, 1 week, 2 weeks and 4 weeks for the anchor points.
Green : upper donchian AVWAPs, Red : lower donchian AVWAPS, thin/1day to thickest/4 week.
Option to test whether a new point should be formed from a high or low exceeding the historical high/low over a lookback length or using a closes that exceed the historical high/low.
--------------------------------------
If you find it useful please consider a tip/donation :
BTC - 3BMEXEDyWJ58eXUEALYPadbn1wwWKmf6sA

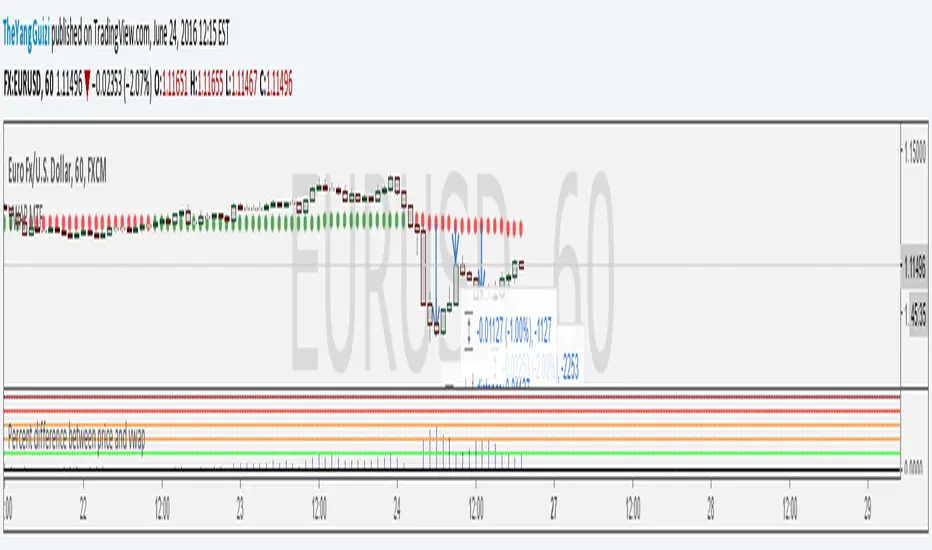
Percent Difference Between VWAP and Price MTFShows the difference between vwap and price in percent.
You can can choose between multiple timeframe vwap. Default is normal daily.
The levels on the indicator can be changed to whatever you want to.
In the chart above we can see eurusd reverting up at 3% below monthly vwap, after the brexit dip, It then turns down again at 1% from monthly and lastly it turns up again at 2% from monthly.
Script is a small modification of this:
VWAP Session and NY CashAuto Anchored VWAPs with Label options
Session starts at 1800 EST
Cash Open or NY Session starts 0930 EST

Nic's Anchored VWAP 4Poor mans anchored vwap. Allows you to identified the volume weighted average price from 4 specific points in time.
Best used on key pivot point high's and lows'
Difference % between PRICE and VWAP V2Shows difference between price and daily/weekly/monthly/hourly/whatever VWAP.
In v2:
option to color bars
average percentual difference of custom period
histogram changes color depending on which levels it's at
Levels/period/color etc can be customized.
Use these inputs in the timeframe box:
M - month
W - week
D - day
2D (or 3W or 2M or whatever) = 2 Days (or three week or 2 months and so on)
60= 1 H
240= 4 H
5 = 5 min
and so on.
btw, vaguely remembering reading somewhere that the big players like to make their entry at 4% difference.

VWAP-Anchored MACD [BOSWaves]VWAP-Anchored MACD - Volume-Weighted Momentum Mapping With Zero-Line Filtering
Overview
The VWAP-Anchored MACD delivers a refined momentum model built on volume-weighted price rather than raw closes, giving you a more grounded view of trend strength during sessions, weeks, or months.
Instead of tracking two EMAs of price like a standard MACD, this tool reconstructs the MACD engine using anchored VWAP as the core input. The result is a momentum structure that reacts to real liquidity flow, filters out weak crossovers near the zero line, and visualizes acceleration shifts with clear, high-contrast gradients.
This indicator acts as a precise momentum map that adapts in real time. You see how weighted price is accelerating, where valid crossovers form, and when trend conviction is strong enough to justify execution.
It uses gradient line coloring to show bullish or bearish momentum, histogram shading to highlight energy shifts, cross dots to mark valid crossovers, optional buy/sell diamonds for execution cues, and candle coloring to display trend strength at a glance.
Theoretical Foundation
Traditional MACD compares the difference between two exponential moving averages of price.
This variant replaces price with anchored VWAP, making the calculation sensitive to actual traded volume across your chosen period (Session, Week, or Month).
Three principles drive the logic:
Anchored VWAP Momentum : Price is weighted by volume and aggregated across the selected anchor. The fast and slow VWAP-EMAs then expose how liquidity-corrected momentum is expanding or contracting.
Zero-Line Distance Filtering : Crossover signals that occur too close to the zero line are removed. This eliminates the common MACD problem of generating weak, directionless signals in choppy phases.
Directional Visualization : MACD line, signal line, histogram, candle colors, and optional diamond markers all react to shifts in VWAP-momentum, giving you a clean structural read on market pressure.
Anchoring VWAP to session, weekly, or monthly resets creates a systematic framework for tracking how capital flow is driving momentum throughout each trading cycle.
How It Works
The core engine processes momentum through several mapped layers:
VWAP Aggregation : Price × volume is accumulated until the anchor resets. This creates a continuous, liquidity-corrected VWAP curve.
MACD Construction : Fast and slow VWAP-EMAs define the MACD line, while a smoothed signal line identifies edges where momentum shifts.
Zero-Line Distance Filter : MACD and signal must both exceed a threshold distance from zero for a crossover to count as valid. This prevents fake crossovers during compression.
Visual Momentum Layers : It uses gradient line coloring to show bullish or bearish momentum, histogram shading to highlight energy shifts, cross dots to mark valid crossovers, optional buy/sell diamonds for execution cues, and candle coloring to display trend strength at a glance.
This layered structure ensures you always know whether momentum is strengthening, fading, or transitioning.
Interpretation
You get a clean, structural understanding of VWAP-based momentum:
Bullish Phases : MACD > Signal, histogram expands, candles turn bullish, and crossovers occur above the threshold.
Bearish Phases : MACD < Signal, histogram drives lower, candles shift bearish, and downward crossovers trigger below the threshold.
Neutral/Compression : Both lines remain near the zero boundary, histogram flattens, and signals are suppressed to avoid noise.
This creates a more disciplined version of MACD momentum reading - less noise, more conviction, and better alignment with liquidity.
Strategy Integration
Trend Continuation : Use VWAP-MACD crossovers that occur far from the zero line as higher-conviction entries.
Zero-Line Rejection : Watch for histogram contractions near zero to anticipate flattening momentum and potential reversal setups.
Session/Week/Month Anchors : Session anchor works best for intraday flows. Weekly or monthly anchor structures create cleaner macro momentum reads for swing trading.
Signal-Only Execution : Optional buy/sell diamonds give you direct points to trigger trades without overanalyzing the chart.
This indicator slots cleanly into any momentum-following system and offers higher signal quality than classic MACD variants due to the volume-weighted core.
Technical Implementation Details
VWAP Reset Logic : Session (D), Week (W), or Month (M)
Dynamic Fast/Slow VWAP EMAs : Fully configurable lengths, smoothing and anchor settings
MACD/Signal Line Framework : Traditional structure with volume-anchored input
Zero-Line Filtering : Adjustable threshold for structural confirmation
Dual Visualization Layers : MACD body + histogram + crosses + candle coloring
Optimized Performance : Lightweight, fast rendering across all timeframes
Optimal Application Parameters
Timeframes:
1- 15 min : Short-term momentum scalping and rapid trend shifts
30- 240 min : Balanced momentum mapping with clear structural filtering
Daily : Macro VWAP regime identification
Suggested Configuration:
Fast Length : 12
Slow Length : 26
Signal Length : 9
Zero Threshold : 200 - 500 depending on asset range
These suggested parameters should be used as a baseline; their effectiveness depends on the asset volatility, liquidity, and preferred entry frequency, so fine-tuning is expected for optimal performance.
Performance Characteristics
High Effectiveness:
Assets with strong intraday or session-based volume cycles
Markets where volume-weighted momentum leads price swings
Trend environments with strong acceleration
Reduced Effectiveness:
Ultra-choppy markets hugging the VWAP axis
Sessions with abnormally low volume
Ranges where MACD naturally compresses
Disclaimer
The VWAP-Anchored MACD is a structural momentum tool designed to enhance directional clarity - not a guaranteed predictor. Performance depends on market regime, volatility, and disciplined execution. Use it alongside broader trend, volume, and structural analysis for optimal results.

VWAP Momentum Oscillator How It Works
Core Calculation Method
The oscillator combines four key market measurements into a single, normalized reading:
1. Price-VWAP Deviation: `(Close - VWAP) / VWAP × 100`
2. VWAP-MA Momentum: `(VWAP - MovingAverage) / MovingAverage × 100`
3. Anchored VWAP Strength: Average of high/low anchor deviations from rolling VWAP
4. Range Position: `(Close - PeriodLow) / (PeriodHigh - PeriodLow) × 100 - 50`
Dynamic Signal Line
The signal line uses an EMA that automatically adjusts its length based on your chart timeframe:
- Futures: Always covers 23 hours of trading (1,380 minutes)
- Stocks: Always covers 6.5 hours of trading (390 minutes)
- Examples: 276 periods on 5-min futures chart, 1,380 periods on 1-min futures chart
Trading Signals
🟢 Buy Signals
- Condition: Main oscillator crosses above signal line while below zero
- Logic: Momentum turning bullish from oversold conditions
- Visual: Green "BUY" label below price action
🔴 Sell Signals
- Condition: Main oscillator crosses below signal line while above zero
- Logic: Momentum turning bearish from overbought conditions
- Visual: Red "SELL" label above price action
⚠️ Extreme Warnings
- Extreme Overbought: Red triangle when oscillator crosses above +4.0
- Extreme Oversold: Green triangle when oscillator crosses below -4.0
- Purpose: Risk management alerts, not entry/exit signals
Oscillator Zones
Interpretation Guide
- Above +2.0: Strong bullish momentum zone (green background)
- 0 to +2.0: Mild bullish territory
- 0 to -2.0: Mild bearish territory
- Below -2.0: Strong bearish momentum zone (red background)
- Above +4.0: Extreme overbought (caution advised)
- Below -4.0: Extreme oversold (potential reversal zone)
Customization Options
Moving Average Settings
- EMA/SMA Toggle: Choose between exponential or simple moving average
- Color Customization: Adjust MA line color and width
Visual Controls
- Bullish/Bearish Colors: Customize momentum zone colors
- Signal Line: Toggle visibility and adjust color
- Line Widths: Control thickness of all plot lines
Anchor Modes
- NY Session Only: Anchors reset at NY market open (9:30 AM ET)
- 24H NY Day: Anchors reset at NY calendar day change (midnight ET)
Best Practices
Timeframe Selection
- Scalping: 1-5 minute charts for quick momentum changes
- Day Trading: 5-15 minute charts for clearer trend signals
- Swing Trading: 1-4 hour charts for major momentum shifts
Signal Confirmation
- Wait for crossovers: Don't trade on oscillator position alone
- Respect extreme levels: Exercise caution above +4 or below -4
- Use with price action: Combine with support/resistance levels
Risk Management
- Extreme zones: Reduce position size when oscillator is extended
- Failed signals: Exit quickly if momentum doesn't follow through
- Market context: Consider overall trend direction and market volatility
Technical Specifications
Calculation Components
- Base Length: 1,380 periods (futures) / 390 periods (stocks)
- Signal Line: Dynamic EMA covering one full trading day
- Smoothing: 3-period SMA on raw oscillator (adjustable)
- Update Frequency: Real-time on every price tick
Performance Notes
- Resource Efficient: Optimized calculations minimize CPU usage
- Memory Friendly: Uses incremental VWAP calculations
- Fast Loading: Minimal historical data requirements
Version History & Development
This oscillator evolved from advanced VWAP overlay strategies, transforming complex multi-line analysis into a single, actionable momentum gauge. The indicator maintains the sophistication of institutional VWAP analysis while providing the clarity needed for retail trading decisions.
Core Philosophy
Traditional VWAP indicators show where price is relative to volume-weighted averages, but they don't quantify momentum or provide clear entry/exit signals. This oscillator solves that problem by normalizing all VWAP relationships into a single, bounded indicator that works consistently across all timeframes and asset classes.
---
Open Source License: This indicator is provided free for the TradingView community. Feel free to modify and enhance according to your trading needs.

Anchored VWAP by Fin VirajSimple Anchored VWAP with Directional Colors
📊 Overview
A clean and efficient Anchored VWAP (Volume Weighted Average Price) indicator with dynamic directional coloring. This indicator provides traders with a reliable reference point for price action analysis based on volume-weighted calculations from specific anchor points.
✨ Key Features
🎯 Multiple Anchor Types
Session: Anchors to daily trading session start
Day: Resets at the beginning of each trading day
Week: Weekly anchor points for swing trading
Month: Monthly anchors for longer-term analysis
Manual Date: Set custom anchor date for specific events
🌈 Directional Color System
🟢 Green: Price above VWAP with upward momentum
🔴 Red: Price below VWAP with downward momentum
🔵 Blue: Neutral/transitional conditions
📏 Standard Deviation Bands
Customizable multipliers (default: 1.0 and 2.0)
Toggle on/off as needed
Support and resistance levels based on statistical deviation
Filled area between bands for better visualization
🔧 Settings & Customization
Input Parameters
Anchor Type: Choose from 5 different anchor methods
Manual Anchor Date: Set specific date for manual anchoring
Reset Anchor Point: Manual reset button
Show Standard Deviation Bands: Toggle bands visibility
Band Multipliers: Adjust band distance (1σ and 2σ)
VWAP Line Width: Customize line thickness (1-4)
Color Customization
Bullish Color: Customize uptrend color
Bearish Color: Customize downtrend color
Neutral Color: Customize neutral state color
Band Color: Customize standard deviation bands color
📈 How to Use
For Day Trading
Set anchor type to "Session" or "Day"
Use VWAP as dynamic support/resistance
Green color = bullish bias, Red color = bearish bias
For Swing Trading
Set anchor type to "Week" or "Month"
Longer-term VWAP acts as major S/R level
Standard deviation bands show potential reversal zones
For Event-Based Analysis
Set anchor type to "Manual Date"
Choose significant event date (earnings, news, etc.)
Analyze price behavior relative to that anchor point
🎨 Visual Interpretation
VWAP Line Colors
Bright Green: Strong bullish momentum (price above rising VWAP)
Bright Red: Strong bearish momentum (price below falling VWAP)
Blue: Neutral conditions or transitional phase
Standard Deviation Bands
Upper Bands: Potential resistance levels
Lower Bands: Potential support levels
Band Touches: Often indicate reversal or continuation points
💡 Trading Applications
Support & Resistance
VWAP acts as dynamic support in uptrends
VWAP acts as dynamic resistance in downtrends
Standard deviation bands provide additional S/R levels
Trend Analysis
Price consistently above VWAP = bullish trend
Price consistently below VWAP = bearish trend
Color changes help identify trend shifts
Entry & Exit Points
Use VWAP reclaims for potential long entries
Use VWAP breaks for potential short entries
Standard deviation bands for profit-taking levels
⚙️ Technical Details
Pine Script Version: v6
Overlay: Yes (plots on price chart)
Calculation: Volume-weighted average price from anchor point
Standard Deviation: Statistical measure of price dispersion
Performance: Optimized for real-time calculation
🔄 Anchor Reset Logic
The indicator automatically resets based on selected anchor type:
Session/Day: Resets at market open
Week: Resets at week start
Month: Resets at month start
Manual: Resets from chosen date
Manual Reset: Override button for immediate reset
📋 Best Practices
Choose appropriate timeframe for your anchor type
Combine with volume analysis for better confirmation
Use multiple timeframes for comprehensive analysis
Consider market context when interpreting signals
Test on demo before live trading
⚠️ Disclaimer
This indicator is for educational and informational purposes only. Always conduct your own analysis and risk management before making trading decisions.

VWAP Periodic Close [LuxAlgo]The VWAP Periodic Close script offers an advanced tool for analyzing the Volume Weighted Average Price (VWAP) across various timeframes.
This tool enables traders to visualize VWAP close levels for daily, weekly, monthly, quarterly, and yearly periods, offering a comprehensive view of price behavior across different time frames. It helps in identifying key levels where the VWAP closes at the end of each specified period.
🔶 USAGE
This script is designed to enhance your trading strategy by plotting VWAP close levels on your chart for different time periods. This helps traders easily identify historical VWAP levels and analyze price action relative to these levels, particularly useful for identifying key support and resistance levels providing insights into potential future price behavior.
Supports VWAP closes for multiple timeframes, including historical periods (e.g., 3 months back, 3 quarters back, 3 years back). The labels provide context and detailed information about the VWAP close at a specific point in time and enhance the clarity and usefulness of the VWAP data presented on the chart.
Users can toggle the display of VWAP lines for different periods and customize the colors for each timeframe (e.g., distinct colors for monthly, quarterly, and yearly closes).
🔶 SETTINGS
The script offers a range of customizable settings to tailor the analysis to your trading needs.
🔹 Volume Weighted Average Price (VWAP)
VWAP Close Level: Toggle the display of VWAP levels at the end of each period (daily, weekly, monthly, quarterly, yearly).
VWAP Origin: Toggle the display of the VWAP line for each period.
VWAP Source: Choose the data source for VWAP calculations (default is HLC3).
Historical Closes: Define the number of historical VWAP levels to plot.
Line/Label Offset: Adjust the offset for positioning lines and labels on the chart.
🔹 Themes
Theme Selection: Choose between "Day," "Night," or "Custom" themes to adjust the color scheme of VWAP lines and labels.

Neural Adaptive VWAPNeural Adaptive VWAP with ML Features is an advanced trading indicator that enhances traditional Volume Weighted Average Price (VWAP) calculations through machine learning-inspired adaptive algorithms and predictive volume modeling.
🌟 Key Features:
🧠 Machine Learning-Inspired Adaptation
Dynamic weight adjustment system that learns from prediction errors
Multi-feature volume prediction using time-of-day patterns, price momentum, and volatility
Adaptive learning mechanism that improves accuracy over time
📊 Enhanced VWAP Calculation
Combines actual and predicted volume for forward-looking VWAP computation
Session-based reset with proper daily anchoring
Confidence bands based on rolling standard deviation for dynamic support/resistance
🎯 Advanced Signal Generation
Volume-confirmed crossover signals to reduce false entries
Color-coded candle visualization based on VWAP position
Multi-level strength indicators (strong/weak bullish/bearish zones)
⚙️ Intelligent Feature Engineering
Normalized volume analysis with statistical z-score
Time-series pattern recognition for intraday volume cycles
Price momentum and volatility integration
Sigmoid activation functions for realistic predictions
📈 How It Works:
The indicator employs a sophisticated feature engineering approach that extracts meaningful patterns from:
Volume Patterns: Normalized volume analysis and historical comparisons
Temporal Features: Time-of-day and minute-based cyclical patterns
Market Dynamics: Price momentum, volatility, and rate of change
Adaptive Learning: Error-based weight adjustment similar to neural network training
Unlike static VWAP indicators, this system continuously adapts its calculation methodology based on real-time market feedback, making it more responsive to changing market conditions while maintaining the reliability of traditional VWAP analysis.
🔧 Customizable Parameters:
VWAP Length (1-200 bars)
Volume Pattern Lookback (5-50 periods)
Learning Rate (0.001-0.1) for adaptation speed
Prediction Horizon (1-10 bars ahead)
Adaptation Period for weight updates
📊 Visual Elements:
Blue Line: Adaptive VWAP with predictive elements
Red/Green Bands: Dynamic confidence zones
Colored Candles: Position-based strength visualization
Signal Arrows: Volume-confirmed entry points
Info Table: Real-time performance metrics and weight distribution
🎯 Best Use Cases:
Intraday Trading: Enhanced execution timing with volume prediction
Institutional-Style Execution: Improved VWAP-based order placement
Trend Following: Adaptive trend identification with confidence zones
Support/Resistance Trading: Dynamic levels that adjust to market conditions

VWAP Direction HistogramThe ** VWAP Direction Histogram ** indicator is a powerful tool for traders looking to gauge the directional bias of the Volume Weighted Average Price (VWAP). VWAP is a critical metric that combines price and volume to provide a weighted average price, often used to identify institutional trading activity and support/resistance levels. This indicator builds upon the traditional VWAP by calculating its directional changes over a customizable lookback period, providing clear visual cues to traders through a color-coded histogram.
By identifying whether VWAP is rising or falling over the specified lookback period, this indicator helps traders determine the prevailing trend bias in the market. A positive VWAP direction suggests upward momentum and a bullish trend bias, while a negative direction indicates downward momentum and bearish sentiment. This information is further reinforced by coloring the chart candles based on the VWAP trend, enabling quick visual analysis and enhancing decision-making for trend-following strategies. Whether you're trading intraday or longer-term, the ** VWAP Direction Histogram ** offers an intuitive and effective way to align your trades with market trends.

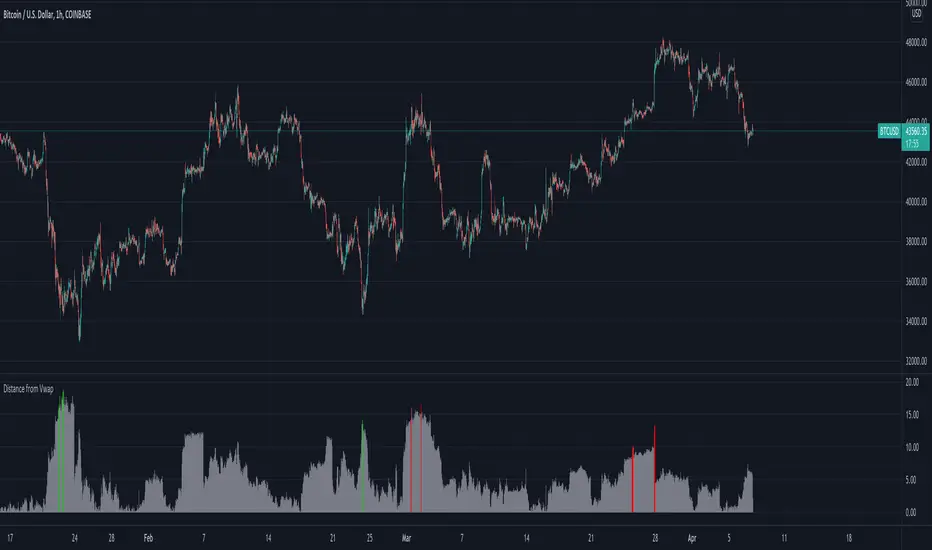
Distance from Vwap// How it Works \\
Measuring the distance of the close price from a higher timeframe VWAP - Volume Weighted Average Price
There is a threshold which is calculated by looking back at the previous x amount of bars and storing the highest/lowest values
If the distance from the vwap stretches above that threshold, the histogram will go green if price is above VWAP and red if its below the vwap
If the distance from the vwap reaches below the low threshold you will see the histogram flashes orange
// Settings \\
In the settings you have the ability to change what timeframe the indicator is calculated on, as well as this you can change the timeframe the VWAP is calculated on.
I always recommend using a higher timeframe vwap as they tend to me more respected
e.g on the hourly timeframe, I use the weekly VWAP, on 1 minute timeframe you may want to use 4 hour timeframe but obviously feel free to experiment
// Use Case \\
When histogram is flashing green, prices is pulling far away from the vwap, obviously you don't want to be buying a falling knife but if you have levels of confluence this can help spot reversals.
I personally wait until the first candle after its been green to get confirmation of the fall weakening. Vica versa for reds and shorts/sells.
When you see orange flashes, this shows that price has been consolidating and the price is very close to the higher time frame VWAP which could be considered a safe entry point as they tend to lead to a big move to follow
// Suggestions \\
Happy for anyone to make any suggestions on changes which could improve the script,
// Terms \\
Feel free to use the script, If you do use the script could you please just tag me as I am interested to see how people are using it. Good Luck!
VWAP Multiple [Huntersull]This is a VWAP/Price multiple analysis, in the same vein as something like the Mayer multiple.
It finds the VWAP of price and volume starting at the bar you choose when initiating the script (You can also drag the starting point line on the chart to change it later), and calculates the running VWAP total for every following bar until the current bar.
It then takes the hlc3 of price for each bar and divides it by the VWAP value of that bar, giving a multiple over VWAP price.
This is then charted with your choice of an SMA, EMA, or WMA using VWAP as the source, and a default length of 200, which is also modifiable.
When VWAP is over the moving average, it is filled green. When VWAP is below the moving average, it is filled red.
--------------------------------------------
This is not meant to be a trading indicator, but a tool for general bull/bear market and trend analysis. Use at your own risk.

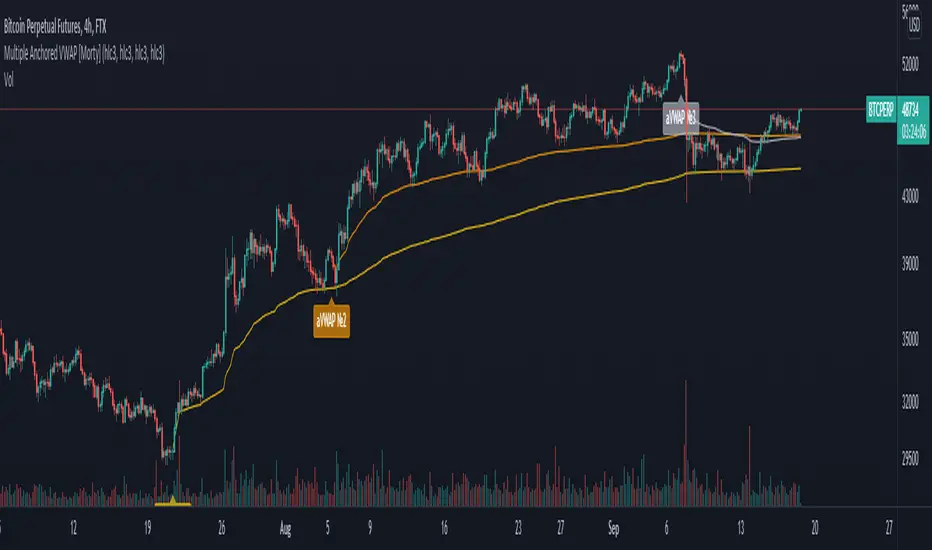
Multiple Anchored VWAP [Morty]The Anchored VWAP (aVWAP) indicator ties VWAP calculations to a specific price bar chosen by the trader. Anchored VWAP allows you to specify the price bar where calculations begin, making it easy to see whether the bulls or bears have been in charge since a very specific point in time. The starting price bar that is chosen generally marks a shift in market psychology, such as a significant high or low, earnings, news, or other announcements. The Anchored VWAP line is charted using price and volume data from that significant event onward.
This indicator plots up to 4 aVWAP lines in the chart.
Features:
- plot up to 4 aVWAP lines
- custom start date of aVWAP
- custom line color
- optional label of starting price bar
- optional custom resolution
----------------------------------------------------
锚定VWAP(aVWAP)指标将VWAP的计算与交易者选择的特定价格柱联系起来。锚定VWAP允许你指定计算开始的价格柱,使你很容易看到自一个非常具体的时间点以来,是牛市还是熊市在起作用。所选择的起始价格条通常标志着市场心理的转变,如一个重要的高点或低点、收益、新闻或其他公告。锚定VWAP线是使用从该重大事件开始的价格和成交量数据绘制的。
该指标在图表中最多绘制了4条aVWAP线。
特色:
- 绘制多达4条aVWAP线
- 自定义aVWAP的开始日期
- 自定义线的颜色
- 可选的起始价格条的标签
- 可选的自定义分辨率
Multi-Day VWAP
Chart the multi-day Volume Weighted Average Price ( VWAP ). Normally, the VWAP is tracked for the current day, from the first bar of the day (regular or extended session). The VWAP shows the current value of:
-> sum(hlc3 * volume , barsForDay) / sum( volume , barsForDay),
-> where 'barsForDay' is the total number bars that have elapsed during the day for the chart interval.
The multi-day version tracks the VWAP for N days back, by averaging the previous N - 1 day bars VWAP and the current VWAP for the current bar (chart interval).
This is very different that simply using a volume weighted moving average , since the closing VWAP values are used for the historical day bars. The results are interesting for intraday trades... especially for values of 1, 2, 3, 4, and 5 days.
Enjoy.

Moving VWAP-KAMA CloudMoving VWAP-KAMA Cloud
Overview
The Moving VWAP-KAMA Cloud is a high-conviction trend filter designed to solve a major problem with standard indicators: Noise. By combining a smoothed Volume Weighted Average Price (MVWAP) with Kaufman’s Adaptive Moving Average (KAMA), this indicator creates a "Value Zone" that identifies the true structural trend while ignoring choppy price action.
Unlike brittle lines that break constantly, this cloud is "slow" by design—making it exceptionally powerful for spotting genuine trend reversals and filtering out fakeouts.
How It Works
This script uses a unique "Double Smoothing" architecture:
The Anchor (MVWAP): We take the standard VWAP and smooth it with a 30-period EMA. This represents the "Fair Value" baseline where volume has supported price over time.
The Filter (KAMA): We apply Kaufman's Adaptive Moving Average to the already smoothed MVWAP. KAMA is unique because it flattens out during low-volatility (choppy) periods and speeds up during high-momentum trends.
The Cloud:
Green/Teal Cloud: Bullish Structure (MVWAP > KAMA)
Purple Cloud: Bearish Structure (MVWAP < KAMA)
🔥 The "Reversal Slingshot" Strategy
Backtests reveal a powerful behavior during major trend changes, particularly after long bear markets:
The Resistance Phase: During a long-term downtrend, price will repeatedly rally into the Purple Cloud and get rejected. The flattened KAMA line acts as a "concrete ceiling," keeping the bearish trend intact.
The Breakout & Flip: When price finally breaks above the cloud with conviction, and the cloud flips Green, it signals a structural regime change.
The "Slingshot" Retest: Often, immediately after this flip, price will drop back into the top of the cloud. This is the "Slingshot" moment. The old resistance becomes new, hardened support.
The Rally: From this support bounce, stocks often launch into a sustained, multi-month bull run. This setup has been observed repeatedly at the bottom of major corrections.
How to Use This Indicator
1. Dynamic Support & Resistance
The KAMA Wall: When price retraces into the cloud, the KAMA line often flattens out, acting as a hard "floor" or "wall." A break of this wall usually signals a genuine trend change, not just a stop hunt.
2. Trend Confirmation (Regime Filter)
Bullish Regime: If price is holding above the cloud, only look for Long setups.
Bearish Regime: If price is holding below the cloud, only look for Short setups.
No-Trade Zone: If price is stuck inside the cloud, the market is traversing fair value. Stand aside until a clear winner emerges.
3. Multi-Timeframe Versatility
While designed for trend confirmation on higher timeframes (4H, Daily), this indicator adapts beautifully to lower timeframes (5m, 15m) for intraday scalping.
On Lower Timeframes: The cloud reacts much faster, acting as a dynamic "VWAP Band" that helps intraday traders stay on the right side of momentum during the session.
Settings
Moving VWAP Period (30): The lookback period for the base VWAP smoothing.
KAMA Settings (10, 10, 30): Controls the sensitivity of the adaptive filter.
Cloud Transparency: Adjust to keep your chart clean.
Alerts Included
Price Cross Over/Under MVWAP
Price Cross Over/Under KAMA
Cloud Flip (Bullish/Bearish Trend Change)
Tip for Traders
This is not a signal entry indicator. It is a Trend Conviction tool. Use it to filter your entries from faster indicators (like RSI or MACD). If your fast indicator signals "Buy" but the cloud is Purple, the probability is low. Wait for the Cloud Flip

Simple VWAP + BandsSimple VWAP + Bands
A clean and customizable VWAP (Volume Weighted Average Price) indicator with standard deviation bands and RTH (Regular Trading Hours) session support.
Features:
- VWAP Line: Volume-weighted average price calculation
- Three Standard Deviation Bands: Configurable bands at 1σ, 2σ, and 3σ levels (above and below VWAP)
- RTH Session Support: Option to calculate VWAP only during regular trading hours
- Customizable Session Times: Configure your own trading session hours and timezone
- Clean Visualization: Line breaks between sessions prevent messy connections across non-trading periods
- Toggle Bands: Show/hide individual standard deviation bands as needed
Use Cases:
- Identify overbought/oversold conditions relative to volume-weighted price
- Track price deviation from VWAP during trading sessions
- Support and resistance levels based on standard deviations
- Mean reversion trading strategies

Kalman Based VWAP [EdgeTerminal]Kalman VWAP is a different take on volume-weighted average price (VWAP) indicator where we enhance the results with Kalman filtering and dynamic wave visualization for a more smooth and improved trend identification and volatility analysis.
A little bit about Kalman Filter:
Kalman filtering (also known as linear quadratic estimation) is an algorithm that uses a series of measurements observed over time, including statistical noise and other inaccuracies, to produce estimates of unknown variables that tend to be more accurate than those based on a single measurement, by estimating a joint probability distribution over the variables for each time-step. The filter is constructed as a mean squared error minimiser, but an alternative derivation of the filter is also provided showing how the filter relates to maximum likelihood statistics
This indicator combines:
Volume-Weighted Average Price (VWAP) for institutional price levels
Kalman filtering for noise reduction and trend smoothing
Dynamic wave visualization for volatility zones
This creates a robust indicator that helps traders identify trends, support/resistance zones, and potential reversal points with high precision.
What makes this even more special is the fact that we use open price as a data source instead of usual close price. This allows you to tune the indicator more accurately when back testing it and generally get results that are closer to real time market data.
The math:
In case if you're interested in the math of this indicator, the indicator employs a state-space Kalman filter model:
State Equation: x_t = x_{t-1} + w_t
Measurement Equation: z_t = x_t + v_t
x_t is the filtered VWAP state
w_t is process noise ~ N(0, Q)
v_t is measurement noise ~ N(0, R)
z_t is the traditional VWAP measurement
The Kalman filter recursively updates through:
Prediction: x̂_t|t-1 = x̂_{t-1}
Update: x̂_t = x̂_t|t-1 + K_t(z_t - x̂_t|t-1)
Where K_t is the Kalman gain, optimally balancing between prediction and measurement.
Input Parameters
Measurement Noise: Controls signal smoothing (0.0001 to 1.0)
Process Noise: Adjusts trend responsiveness (0.0001 to 1.0)
Wave Size: Multiplier for volatility bands (0.1 to 5.0)
Trend Lookback: Period for trend determination (1 to 100)
Bull/Bear Colors: Customizable color schemes
Application:
I recommend using this along other indicators. This is best used for assets that don't have a close time, such as BTC but can be used with anything as long as the data is there.
With default settings, this works better for swing trades but you can adjust it for day trading as well, by adjusting the lookback and also process noise.

VWAP SpiderThe VWAP Spider indicator enhances the conventional Volume Weighted Average Price (VWAP) analysis by anchoring it to the first candle and incorporating an extensive series of standard deviation (SD) lines, extending up to +8 SDs with additional half-step increments. This configuration provides a more suitable set of lines for identifying support and resistance, distinguishing it from existing VWAP and SD indicators. Its design, featuring color gradients for fills and distinct labels for each line, aims to improve the utility and user experience.
Optimal Timeframes:
It is recommended for use on weekly or monthly resolutions to ensure all price and volume history is included.
Distinctive Features:
The indicator includes a more extensive array of SD lines than typically found in VWAP indicators, enhancing the depth of market analysis.
The visual presentation is optimized with color gradients and clear labeling, facilitating ease of use and integration into trading strategies.
Practical Use of the VWAP Spider:
SD Lines as Support and Resistance : Observe the interactions between the price and the SD lines closely. These can serve as dynamic support and resistance indicators, influencing trading decisions.
Analyzing Historical Price Action : Investigate how the price has historically interacted with the SD lines. Identify which lines have frequently acted as support and resistance in the past, as they will often continue to be revisited.
Strategic Application : Leverage insights from the interactions between price and SD lines to fine-tune entry and exit points. For example, a rebound from an SD line may suggest a strong entry point, while breaching an SD line could indicate a potential exit.
This indicator is freely available and open-source on TradingView for all. It is designed to help traders enhance their market analysis and strategic decision-making.
