Colored Volume Weighted Average PriceSimple addition to the standard VWAP indicator.
If price is above VWAP the plot is colored green. If below plot is colored red.
Colors are configurable.
You can also choose the source for price (i.e. open/low/high etc)
스크립트에서 "vwap"에 대해 찾기
UT Bot Decimal + HA Signals + HA VWAP (Bold White Labels)Custom UT Bot with Built in VWAP and ability to use decimal sensitivity and signals fire off of Heikin Ashi candle

BTC ETF Average Inflow Cost BasisConcept
Since the historic launch of Bitcoin Spot ETFs on January 11, 2024, institutional flows have become a major driver of price action. This indicator aims to visualize the aggregate Cost Basis (average entry price) of the major Bitcoin ETFs relative to the underlying asset.
It serves as an on-chain proxy for institutional positioning, helping traders identify critical support levels where ETF inflows have historically concentrated.
How it Works
The script aggregates daily volume data from the top Bitcoin ETFs (IBIT, FBTC, ARKB, GBTC, BITB) and compares it against the Bitcoin price (BTCUSDT).
ETF Cost Basis (Pink Line):
This is calculated as a Cumulative Volume-Weighted Average Price (VWAP), anchored specifically to the ETF launch date (Jan 11, 2024).
Formula: It accumulates (BTC Price * Total ETF Volume) and divides it by the Cumulative Total ETF Volume.
This creates a dynamic level representing the "breakeven" price for the aggregate volume traded through these funds.
True Market Mean (Gray Line):
This represents the simple cumulative average of the Bitcoin price since the ETF launch date. It acts as a neutral baseline for the post-ETF market era.
How to Use
Institutional Support: The Cost Basis line often acts as a strong dynamic support level during corrections. When price revisits this level, it suggests the market is returning to the average institutional entry price.
Trend Filter:
Price > Cost Basis: The market is in a net profit state relative to ETF flows (Bullish/Trend continuation).
Price < Cost Basis: The market is in a net loss state (Bearish/Capitulation risk).
Confluence: The intersection of the Cost Basis and the True Market Mean can signal pivotal moments of trend reset.
Features
Data Aggregation: Pulls data from 5 major ETFs via request.security without repainting (using closed bars).
Dashboard: Includes a table in the top-right corner displaying real-time values for Price, Cost Basis, and Market Mean.
Customization: You can toggle individual ETF Moving Averages in the settings (disabled by default due to price scale differences between BTC and ETF shares).
Disclaimer
This tool is for educational purposes only and attempts to estimate institutional cost basis using volume proxies. It does not represent financial advice.

Colby Cheese VWAP Setup [v2.0]🔧 Core Refactors
• Imbalance function fixed:
• Removed invalid usage.
• Now uses for past bar references.
• Bias checks are handled outside the function with proper series indexing.
• Bias alignment:
• Added and so CHoCH signals only fire when price change agrees with EMA bias.
• Swing reset:
• After a valid CHoCH, and reset to so stale levels don’t keep firing.
• Line/label management:
• CHoCH lines and labels now reuse persistent IDs (, ) instead of spamming new objects every trigger.
✨ New Features
• Anticipation mode:
• Blue “Anticipate” lines/labels drawn when delta + bias align before CHoCH confirmation.
• Helps you see potential setups earlier.
• Entry zone lines:
• Solid green/red lines drawn at entry levels when is enabled.
• Separate from FRVP dashed zones.
• Stop‑loss lines:
• Orange dotted lines drawn opposite the entry zone when is enabled.
• Gives a visual risk marker.
🎨 Visual Consistency
• Candle coloring simplified: white candles only when CHoCH triggers.
• FRVP zones remain dashed lines with “Enter” labels.
• Anticipation zones are blue solid lines.
• Entry zones are solid green/red.
• Stop‑loss lines are orange dotted.

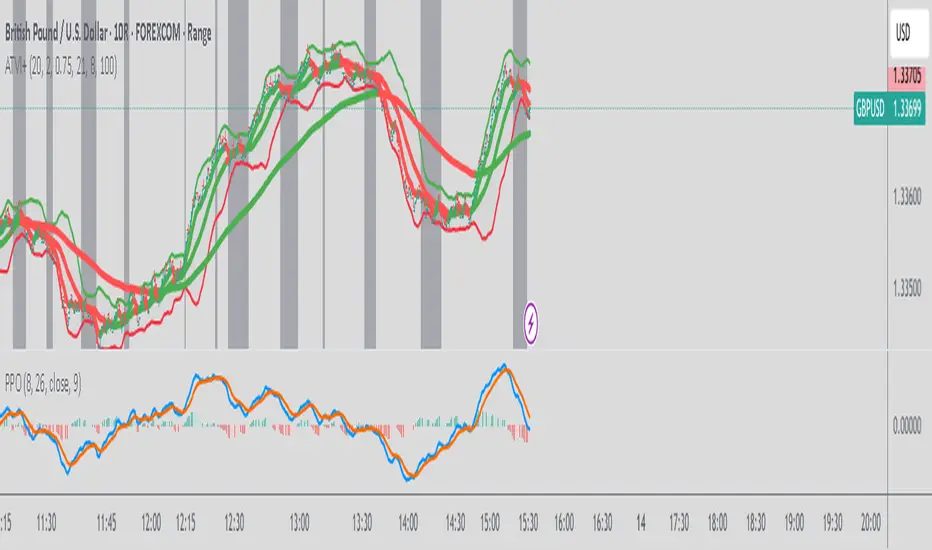
MACD Above Signal & Price Above VWAP IndicatorThis strategy provides a buy signal with a green arrow pointing up when three conditions are met. The MACD has to be above the signal line. The settings for MACD can be adjusted, but the default is the standard settings for MACD. The second condition is the price has to be above the VWAP line. The third condition is that the price of the current candle needs to be higher than the HIGH price of the previous candle.

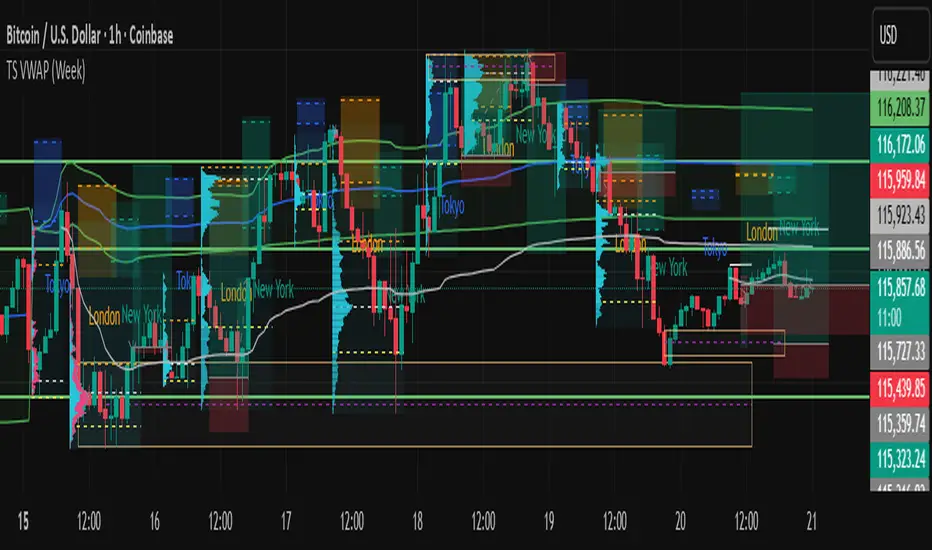
Daily Anchored VWAPAnchors VWAP to whatever time you want instead of the usual start of session. I use it for BTC so that I can anchor around NY open instead of the night before.

Volume Weighted Average Price - 6 band by buckstrdrstandard VWAP improved to allow 6 bands as standard

AnAn Master: VWAP + EMA9/21 + Volume Spike ArrowsAnAn Master: VWAP + EMA9/21 + Volume Spike Arrows to help with spikes

Sniper BB + VWAP System (with SMT Divergence Arrows)STEP 1: Load two correlated futures charts.
Example: CL + RB/SI+GC/ NQ+ES
STEP 2: Add Bollinger Bands (20, 2.0) on both.
Optional add (20, 3.0).
STEP 3: Watch for a BB tag on one chart but not the other.
STEP 4: Wait for a reclaim candle back inside the band.
STEP 5: Enter with stop below/above the wick + 3.0 BB.
STEP 6: Scale out midline, then opposite band.
STEP 7: Hold partials when both pairs confirm trend.
*You can take the vwap bands off the chart if it is too cluttered.

TFU Multi-Symbol Screener + VWAP + Table Size Option + Blank RowTFU Multi-Symbol Screener + VWAP + Table Size Option + Blank Row

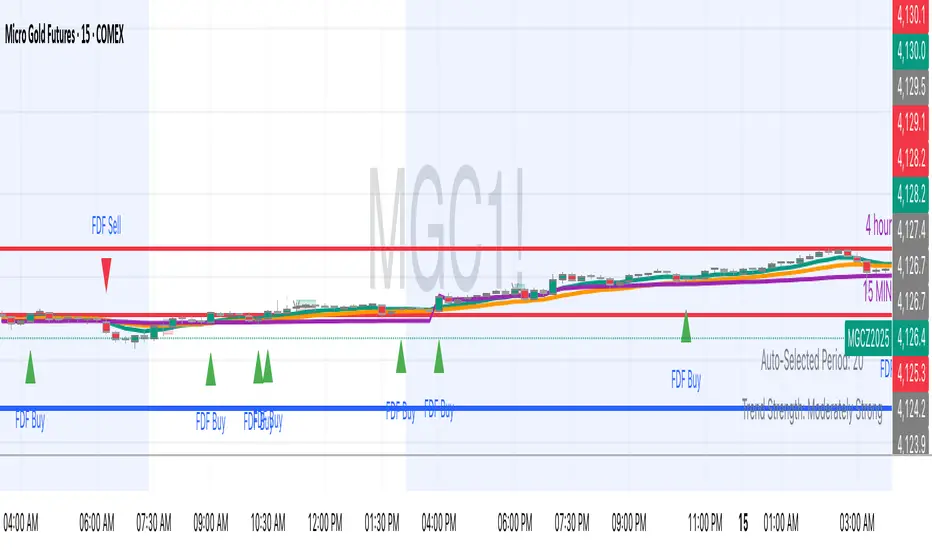
FDF — EMAs+VWAP with setup & entry (stable scale)the 9 and 21, vwap - and support an restianst, marking each entry when it pulling in our out to the 21. used 90% of the candle over the 21
Rolling VWAP x3editable rolling vwap, 3 lines, simple, can edit all 3, preset to 7/30/90 day. Just made it to declutter indicators, good luck.

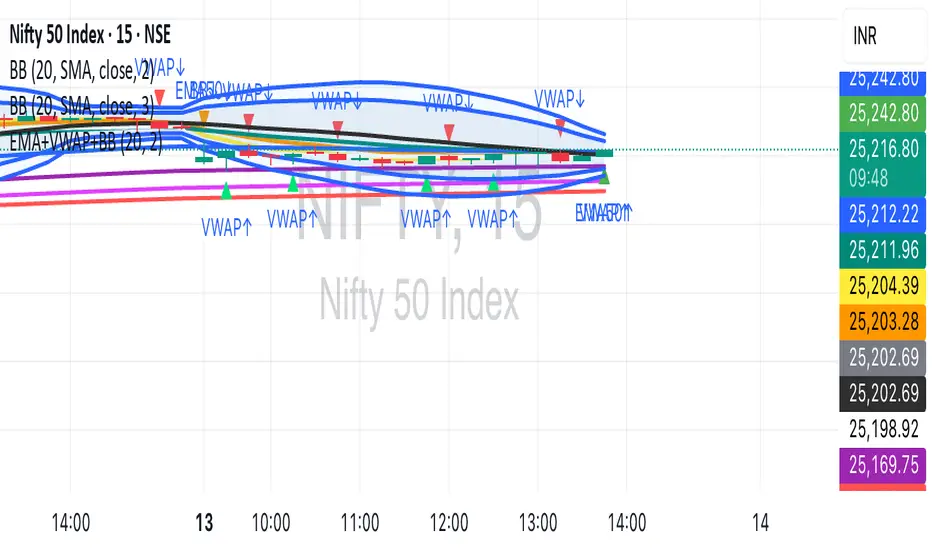
EMA (5, 10, 20, 50, 100, 150, 200)+VWAP+BBEMA Cluster + VWAP + Bollinger Bands + Alerts + Visual Signals (Fixed)
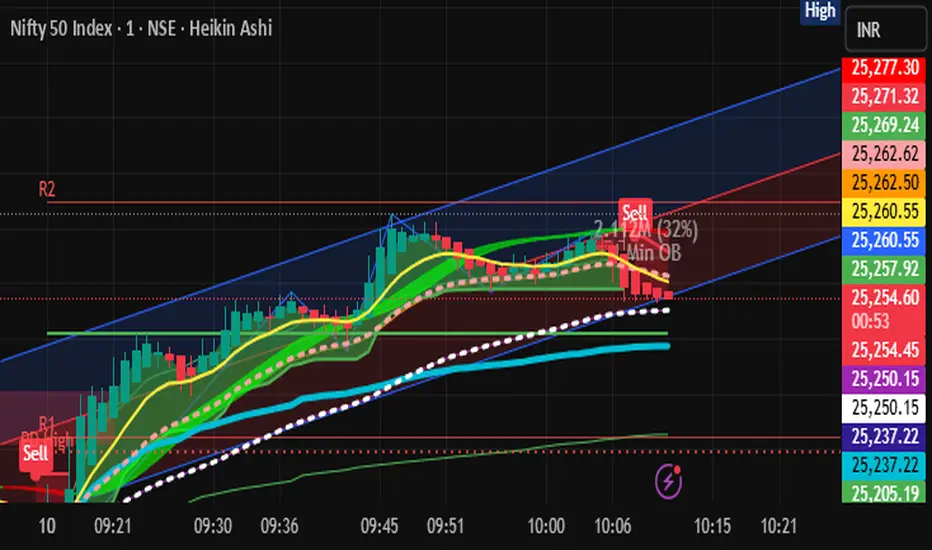
Santhosh VWAP + 3 EMA + Buy Sell AlertI have combined VWAP and EMA , along with this generated buy and sell alert based on ATR . Best for Scalping
TWAP + VWAP ConvergenceThis script:
Plots VWAP and TWAP
Detects intersections
Highlights candles where they cross beneath price
Optional: Alert condition when intersection occurs


Howard Intraday Edge (JH Edge) - (VWAP + EMA9/EMA21 + RSI)Howard Intraday Edge (JH Edge)
A disciplined intraday trading system by J. Howard.
Uses VWAP, EMA 9/21, RSI, and Optional EMA 200 to confirm trends and momentum.
Automatically plots Clean stop-loss and take profit levels. Built for SPY 0DTE-5DTE options, but works on other liquid tickers.
Focus: 1-3 high probability trades/day with tight risk control.
Best used on 1 or 3 minute timeframes.

OPEN = LOW + VWAP + Volume SurgeTradingView Pine Script that scans for OPEN = LOW, confirms VWAP support, and checks for volume surge — tailored for your intraday breakout strategy

Turnover & RVOL with MA & VWAP This scrip shows
Turnover for the day
Relative Volume
VWAP
Moving Averages
Special : Just hover the cursor over the historic bars to see the values at that point of time instead of using replay option.

Advanced Trend & Volatility Indicator (VWAP & EMA360)Bollinger band with adjustable NO TRADE tool. green buy and red sell signals for 20 moving average added 360 moving average for micro trading. Has VWAP and additional EMA defaulted to 9 (adjust to your style). For confluence use this along with an RSI over bought and over sold WMA with similar green buy and red sell signals.