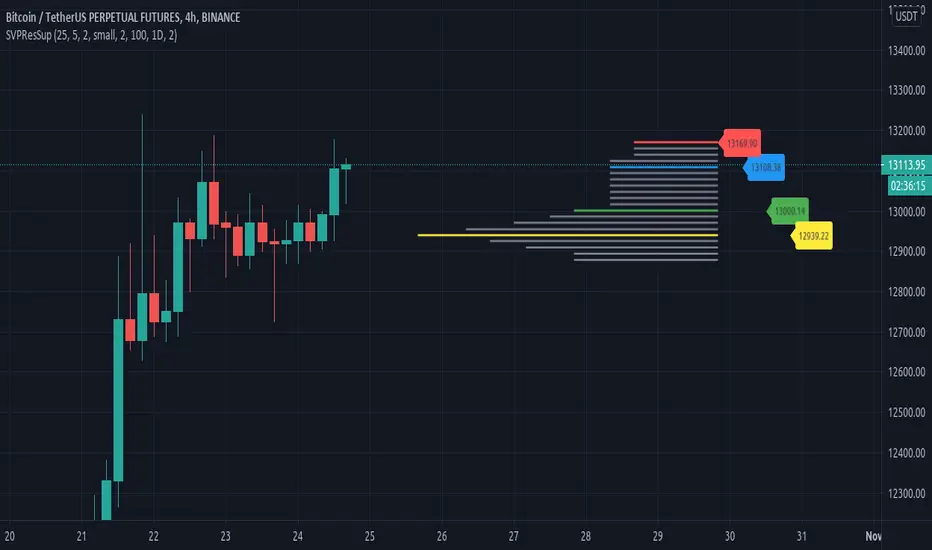
Resistances and supports based on simplified Volume ProfileThis study tries to highlight support and resistances
as they are defined by
TradingLatino TradingView user
His definition is based on volume peaks
on the official TradingView Volume Profile
indicator that seem rather big on size.
As a bonus it also serves as a rather simple volume profile indicator.
As you can see it only show last blocks volume profile.
It's aimed at BTCUSDT pair and 4h timeframe.
HOW IT WORKS
HOW IT WORKS - Recent Profile Block
It gathers volume from the last 100 Bars
in order to draw the recent profile block
Volume that intersects with current level range
being studied is added to its value.
Additionally the current level price is modified
so that it matches the level price where most
of the volume has concentrated
So you get a pretty accurate way of the volume
while at the same time the level are not stuck
to arbitrary level prices.
HOW IT WORKS - Resistances and Supports
It calculates the level which its price it's
nearer (from below) to the current price level
Resistance is found steping up (from current prive level)
level by level
till you find a level which its value
is higher than the previous level value.
Support is found steping down (from current prive level)
level by level
till you find a level which its value
is higher than the previous level value.
That way you ignore rather small
resistances and support values.
Finally the resistances and supports are drawn next to the recent profile block
so that you can look at them with ease.
If you hover over the label you can double check if you are looking at
current price, resistance or support levels.
SETTINGS
Bars in recent profile block : How many previous period volumes are used to calculate the recent profile block
Row width multiplier : Adjust how big the recent profile block seems to be
Resistances prices number of decimal digits : How many digits is shown at the resistance and support level prices.
WARNING
Please be aware that depending on your security and timeframe you might need to modify the
'Bars in recent profile block' setting so that the study does not timeout.
USAGE
If your strategy calculates take profit
limits on higher resistances based
on volume you could use this indicator
resistance detector
FEEDBACK 1
This is my first volume indicator.
I suppose that each trader
has his own approach on defining
resistances and supports.
I'm interested on knowing if the default way
this resistances and supports are calculated
matches what other traders would have
highlighted manually on the chart.
FEEDBACK 2
I have only used this identifier in BTCUSDT 4h timeframe.
I'm interested to know what needs to be tweaked
in other securities and timeframes.
PINE STUDY TRICK
This study let's you choose the number of decimals the label will use.
CREDITS
I have reused and adapted some code from
'Poor man's volume profile' study
which it's from TradingView IldarAkhmetgaleev user.
I also wanted to thank him for helping me understanding his study.
스크립트에서 "support"에 대해 찾기
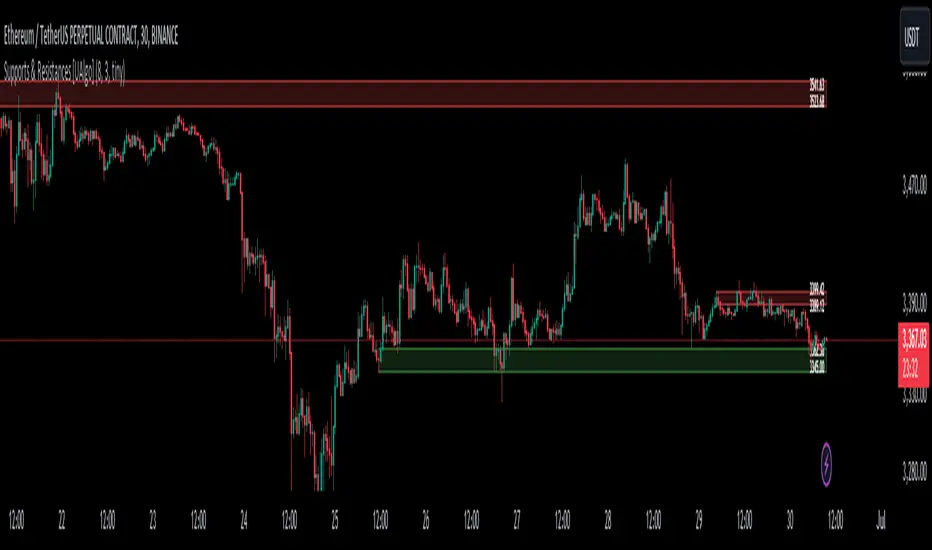
Supports & Resistances [UAlgo]The "Supports & Resistances " indicator is designed to identify and visualize key support and resistance levels on the price chart. It utilizes the Average True Range (ATR) and Pivot Points to define the boundaries of S & R zones and considers historical price action to assess the strength of these zones.
🔶 How to Obtain Zones
The script continuously analyzes the price action and identifies potential support and resistance zones based on the following criteria:
Zone Creation: For swing highs, a zone is created with the high price at the zone length as the top and the top minus the Average True Range (ATR) as the bottom. Conversely, for swing lows, the zone is created with the low price at the zone length as the bottom and the low plus the ATR as the top.
Zone Strength Calculation: The script iterates through historical bars within the zone and counts how many times the price (low for support, high for resistance) touched but failed to break entirely through the zone. This count is assigned as the zone's "strength".
Zone Display and Removal: It identifying zones by assigning a "strength" value based on how many times the price has approached but failed to break the zone. This helps prioritize stronger potential support/resistance levels. Only zones exceeding the defined "strength threshold" are visually displayed on the chart. Weaker zones or those broken by price are automatically removed.
🔶 Parameters
Zone Length: Traders can adjust S & R detection sensitivity, length to be used to find pivot points.
Strength Threshold: Set the minimum number of times the price needs to touch but fail to break a zone for it to be considered "strong" and displayed.
Visual Settings: Tailor the appearance of the support/resistance zones by defining separate colors and text size for borders, backgrounds, and zone text.
🔶 Disclaimer
The "Supports & Resistances " indicator is provided for educational and informational purposes only.
It should not be considered as financial advice or a recommendation to buy or sell any financial instrument.
The use of this indicator involves inherent risks, and users should employ their own judgment and conduct their own research before making any trading decisions. Past performance is not indicative of future results.
🔷 Related Scripts
Support and Resistance with Signals
ATR Based Support and Resistance Zones
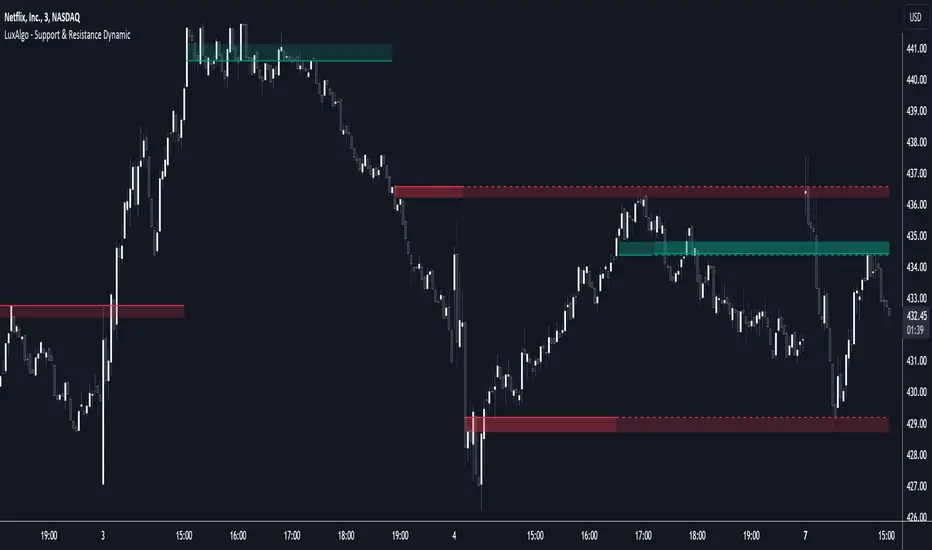
Support & Resistance Dynamic [LuxAlgo]The Support & Resistance Dynamic indicator aims to return real-time predictive support and resistance zones that are relevant to a detected trend. This makes this indicator similar to our previously published Predictive Ranges indicator.
Users can additionally extend the most recent historical support and resistance zones.
🔶 USAGE
Hypothetical resistance levels in an up-trend or supports in a down-trend would tend to be broken more easily, as such the indicator primary objective is to return reliable real-time support and resistance levels by taking this into account.
When the market is up-trending the indicator will only return support zones, while a down-trending market will cause the indicator to only return resistance zones.
If the price significantly breaks a support/resistance, rendering it unreliable, it can be a sign of a potential reversal.
Users can return support/resistance levels/zones for shorter-term trends by reducing the Multiplicative Factor setting.
🔹 Extension
Users can extend past estimated support/resistance levels, the amount of extended levels is determined by the users. Certain levels can stay relevant in the future, and can also aid in measuring the significance of a breakout, with further past levels being reached being indicative of more significant trends.
🔶 DETAILS
To determine if the price is up-trending or down-trending in order to show either support or resistance, the same method used in the predictive ranges script is used. A central tendency is estimated, if price significantly deviates from it upward an uptrend is detected, else a significant deviation downward would indicate a downtrend.
The central tendency estimate is used for the construction of the support and resistance levels.
🔶 SETTINGS
Multiplicative Factor: Determines the frequency at which new supports/resistances are returned, with lower values returning more frequent levels/zones.
ATR Length: ATR averaging length used as deviation threshold for the central tendency estimate.
Extend Last: Determines the amount of most recent historical supports/resistances to extend to the latest bar.
Support and Resistance Multiperiod (Zig Zag Based)Support and Resistance Multiperiod (Zig Zag Based)
What is the indicator?
• The indicator is a multi period (up to 5 lengths) Support and Resistance indicator calculated based on Zig Zag.
Who can use?
Scalpers to Long term investors
What timeframe to use?
• Any timeframe
What are the lines?
• Green lines are Support levels.
• Orange lines are Resistance levels.
How to use?
• Buy Low and Sell High.
• Brighter zones means strong Support or Resistance.
• Weaker zones appear lighter.
• Brighter zones are formed by overlapping of lines from multiple levels of support or resistance.
Indicator Menu
• The indicator can input 5 different Lengths.
• The default settings uses 13, 21, 52, 100 & 200.
• Every option are customizable.

Resistance/Support Indicator - FontiramisuIndicator showing resistances and support, based on pivots location
When a new pivot location is near from a resistance/support the latter gains weight.
You can modify multiple parameters :
Nb Max res/sup : Define the number max res/sup to keep in our res/sup history array. The greater it is the older bar index will be taken.
Nb show res/sup : Define the number of res/sup to be drawn.
Min weight shown : Define min res/sup weight to be shown. Weight is used to measure strengh of res/sup.
% range stack : Define price percentage change required to stack a pivot into an existing res/sup. Default is 0.015 = 1.5%.
Pivots are calculated with deviation parameter to validate with more precision.
Fontilab Library is used to code this indicator.

session min/max support&resistance [LM]Hello traders,
I would like to present you session min/max support&resistance indicator. The idea behind is to calculate min and max per session and render line at those levels and bars until the price reach the level. With this you can see levels where the price didn't reach with granular control over how many lines can be shown.
Indicator has following settings:
General control - where you can select session interval and show/hide labels
Line control - where you can adjust type of line, color of up/bottom level..
I hope you will enjoy it,
Lukas

Compression support&resistance [LM]Hello traders,
I would like to present you Compression support&resistance script. The idea behind is to look for areas of price compression(inside bar candles). Basically the S/R lines are created after three candles that are formed in certain pattern and volume conditions. First candle of pattern is usually the most volatile and fist inside bar after volatile candle high and low creates S/R lines in order to look for breakouts or for future bounces of the S/R line. Also by default volume has to be decreasing from candle to candle, although this condition can be controlled by setting.
It has various settings as my other S/R scripts for multi timeframe analysis. The current timeframe uses line API but for multi timeframe I use plot lines. There are two filters. Volume filter for declining volume of the pattern candles and volatility filter which renders line only in case that pattern occurs after some % change has happened within some lookback period.
Credit also for this indicator goes to @berkek as he took time to explain it to me.
Hope you will enjoy it,
Lukas
Volatility semaphore Support&Resistance multi timeframe [LM]Hello Traders,
I would like to introduce you volatility semaphore support&resistance levels. The idea is the same as the pivot
semaphore script of mine to spot the importance of support&resistence.
It is little bit different than previous script as it uses different line API than previous volatility support& resistance multi timeframe . You have more control over hat and how many lines are rendered(better to use odd numbers in line count setting as it always finds 2 S/R lines). Also this indicator has setup for contol whether you want wicky candles or no by setting percentage of candle body that is accepted.
I hope you will enjoy it.

Volume Cluster Support & ResistanceVolume Cluster Support & Resistance
This indicator identifies potential Support and Resistance (S/R) levels on the chart using Volume-Based Point of Control (POC) Clustering. It offers extensive customization for calculation parameters, display styles, and visualization options, including S/R zones, color gradients, and historical reaction markers.
How It Works
Volume Based S/R:
Scans the specified Clustering Lookback period for "High Volume Bars", defined as bars where volume exceeds the average volume (over Volume Lookback Period) multiplied by the High Volume Threshold Multiplier.
Calculates the Point of Control (POC) for each high-volume bar using hl2.
Clusters these high-volume bar POCs: POCs within a proximity defined by Cluster Proximity (ATR) (Average True Range multiplier) are grouped together.
Filters these clusters, requiring a Min Bars in Cluster to form a valid S/R zone.
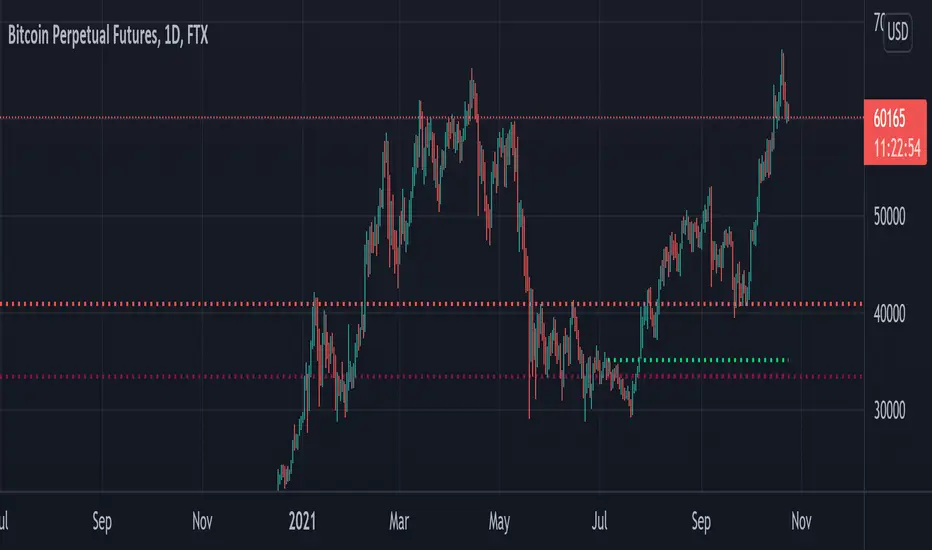
(Image showing the indicator being used on the Bitcoin 5min chart)
The center price of valid clusters determines the S/R level. Clusters above the current price become potential Resistance, and those below become potential Support.
Calculates the offset based on the most recent bar included in the cluster.
Level Selection & Display:
The indicator identifies multiple potential S/R levels.
It then selects and displays the top Number of S/R Levels to Display support levels below the current price and resistance levels above the current price.
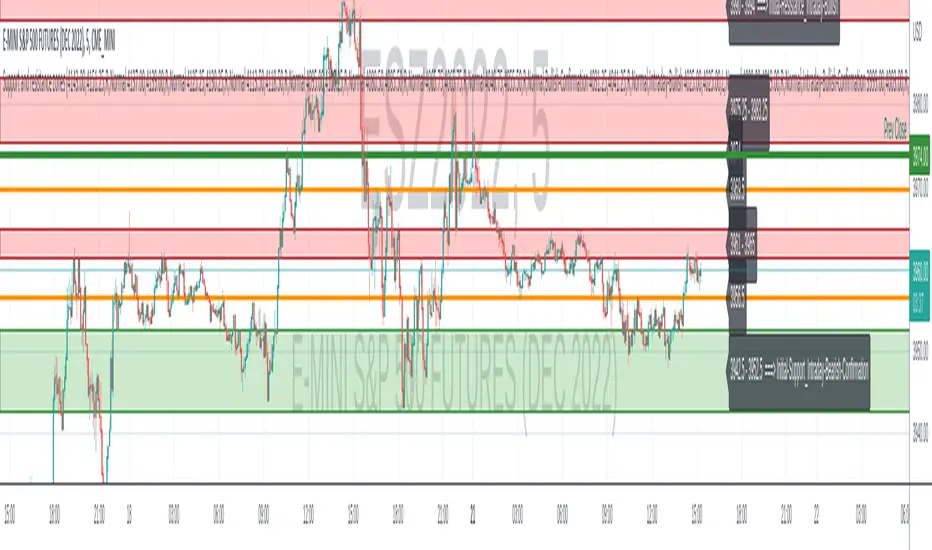
(Image showing the indicator on the GBP/USD 5min chart)
ATR Usage:
The Average True Range (ta.atr(14)) is used in two key areas:
Determining the proximity threshold for grouping POCs in the 'Volume Based' clustering (clusterProximityAtr).
Calculating the width of the S/R zones when 'Use Zone Visualization' is enabled (zoneAtrMultiplier).
Key Features & Components
Dual Calculation Methods: Choose between Pivot-based S/R or Volume-based POC clustering.
Volume Confirmation: Pivots require volume confirmation; Volume method directly analyzes high-volume bars.
POC Clustering: Groups high-volume areas to identify significant price zones.
Configurable Lookbacks: Adjust periods for volume averaging, pivot detection, and clustering analysis.
Dynamic S/R Display: Shows a configurable number of the most relevant S/R levels relative to the current price.
Optional Zone Visualization: Display levels as filled zones with configurable width (ATR-based), fill transparency, and border transparency. Includes a dashed center line.
Optional Historical Reactions: Mark past price interactions (lows bouncing off support zones, highs rejecting from resistance zones) directly on the chart (Warning: Can significantly impact performance).
Customizable Styling: Control line style (Solid, Dashed, Dotted), width, color (separate for Support & Resistance), and horizontal extension (None, Left, Right, Both).
Price Labels: Toggle visibility of price labels next to each S/R level/zone.
Visual Elements Explained
S/R Lines/Zones: Plotted lines or filled zones representing calculated support and resistance levels. Color-coded for Support (default green) and Resistance (default magenta).
Line/Zone Borders: Appearance controlled by Style settings (Style, Width, Extension). Can have a gradient color effect based on age if enabled.
Zone Fills: Semi-transparent fills for zones (if enabled), with configurable transparency. Fill color matches the border color (including gradient effect if enabled).
Zone Center Line: A thin, dashed line indicating the exact calculated S/R price within a zone.
Price Labels: Text labels showing the exact price of the S/R level.
Historical Reactions: Small dot markers appearing on historical bars where price potentially reacted to a displayed zone (only if Show Historical Reactions is enabled).
Configuration Options
Users can adjust the following parameters in the indicator settings:
Calculation Method: Select "Pivot Based" or "Volume Based".
Volume Zone Settings (Volume Based): Threshold multiplier, clustering lookback, cluster proximity (ATR), minimum bars per cluster.
Display Options: Toggle S/R visibility, price tags, set the number of levels to show.
Volume Settings: Volume lookback period, volume multiplier (for Pivot confirmation).
Style Settings: Line style, width, extension, support/resistance text and line colors, enable gradient coloring, set gradient start/end colors.
Zone Visualization: Enable/disable zones, set zone width (ATR multiplier), fill and border transparency, enable/disable historical reaction markers (performance warning).
Interpretation Notes
This indicator identifies potential areas of support and resistance based on historical price action and volume analysis. These levels are not guaranteed reversal points.
The 'Volume Based' method focuses on areas where significant trading activity occurred, while the 'Pivot Based' method focuses on price turning points confirmed by volume.
Use the displayed levels in conjunction with other technical analysis tools, price action patterns, and risk management strategies.
Be mindful of the performance impact when enabling Show Historical Reactions, especially on longer timeframes or with large lookback periods. The default setting is false for optimal performance.
The max_bars_back setting is optimized for performance; increasing it significantly may slow down chart loading.
Risk Disclaimer
Trading involves significant risk. This indicator is provided for analytical and educational purposes only and does not constitute financial advice or a trading recommendation. Past performance is not indicative of future results. Always use sound risk management practices and never trade with capital you cannot afford to lose.

Support and Resistance (High Volume Boxes) [ChartPrime]Support and Resistance (High Volume Boxes)
◆ Overview:
The "Support and Resistance" indicator identifies key support and resistance levels using pivot points and volume analysis. It visually represents these levels with dynamically colored boxes, indicating the strength of the volume. This helps traders recognize potential price reversals and key zones for buy and sell opportunities.
◆ Key Features:
Dynamic Support and Resistance Boxes:
The indicator plots support and resistance boxes based on pivot points and volume above threshold for positive volume boxes and below lower threshold for negative volume boxes.
Box colors change from transparent to more intense based on volume, reflecting the strength of support or resistance.
Boxes expands until a new box of the same type appears.
Volume-Based Color Coding:
Boxes are color-coded based on the amount of volume:
Green boxes indicate support levels with positive volume.
Red boxes indicate resistance levels with negative volume.
Hold Signals:
Green diamonds (◆) indicate when support holds, signaling potential buy opportunities.
Red diamonds (◆) indicate when resistance holds, signaling potential sell opportunities.
Breakout Labels:
If the price falls below a support level, that level will become resistance. If the price rises above a resistance level, it will often become support. As the price moves past a level of support or resistance, it is thought that supply and demand has shifted, causing the breached level to reverse its role.
Labels "Break Sup" and "Break Res" are displayed when support or resistance levels are broken, indicating significant market movements.
◆ Break Resistance:
◆Break Support:
◆ Usage Notes:
This indicator helps traders identify strong support and resistance levels, offering visual cues for potential price reversals.
By analyzing volume at these levels, traders can gauge the strength of these zones and make more informed trading decisions.
◆ Settings:
Lookback Period: The number of bars to look back for pivot points.
Delta Volume Filter Length: The length of the volume filter for more accurate volume analysis. (Higher input, will filter low volume boxes)
Adjust Box Width: Adjusts the width of the support and resistance boxes.
This indicator is designed to enhance your trading by providing clear visual cues for support and resistance levels based on volume, making it easier to spot potential price reversals and key trading opportunities.

Support and resistance zonesDiscretionary traders often use support and resistance zones that are based on past price action of the instrument traded.
This simple script is used to plot support and resistance zones for a given instrument. The data for the zones themselves has to be determined by the past price action of the instrument and are not based on the provided data by Tradingview.
The zones input has to come as a string. Each zone consists of a string with: ",,<"S"|"R"|"L">,<"Normal"|"Strong">"" The different zone strings have to be seperated by either new line or space.
An example for the zones input looks like:
3919.25,3919.25,L,Normal
3897.50,3906.50,R,Normal
3891.00,3894.50,S,Strong
I appreciate any feedback.
Support Resistance InteractiveHello All,
Using this "Support Resistance Interactive" script you can set the Support/Resistance levels interactively by clicking on the chart. Using the SR levels you set, the indicator creates Support Resistance zones. The width of the zones are calculated by using Threshold option and Threshold is the percent of the distance between Highest/Lowest levels in last 300 bars. if you set Threshold = 1 then it means 1% of the distance between Highest/Lowest levels. You can change SR levels by moving the level up/down by using your mouse anytime you want.
Now lets see it step by step;
After you added the indicator it will ask 5 Support/Resistance Levels and when you click any point then it's kept as S/R level and it asks another SR levels. if you want to use only 3 SR levels then last 2 SR levels are not important and you can click anywhere on the chart;
After you set all SR levels, it will ask "Number of Support/Resistance" . if you want to activate first 3 SR lines then set it 3. by default it's 5. when you set it click "Apply" and see the SR zones. that's it.
You can enable/disable alerts and set frequency, then create alerts. as it's interactive tool, the SR levels you set are specific for the current/active symbol. if you open another symbol then you better delete the indicator and add it again
Three Alerts exist in the script: Support Broken, Resistance Broken and Price in SR zone . you can enable/disable the alerts as you wish and you can set frequency for each one as "Once Per Bar" or "Once Per Bar Close"
by default Green/Red/Gray colors are used but You can change the colors using the options. according to the Price moves, SR zone colors are changed automatically.
when we have "Reset" feature to run the script interactively (like we added it for first time) I can update the script, then you will not need to delete/re-add each time you changed the symbol :)
In this example "Threshold" is 2 and "Number of Support/Resistance" is 4.
in this example "Threshold" is 0 and "Number of Support/Resistance" is 5.
Last example; Labels are shown for each zone, you can set location of the labels. SR order and Upper/lower band of each zone are shown in each label.
Enjoy!

Support Resistance ChannelsHello All,
For Long time I was planning to make Support/Resistance Channels script, finally I had time and here it is.
How this script works?
- it finds and keeps Pivot Points
- when it found a new Pivot Point it clears older S/R channels then;
- for each pivot point it searches all pivot points in its own channel with dynamic width
- while creating the S/R channel it calculates its strength
- then sorts all S/R channels by strength
- it shows the strongest S/R channels, before doing this it checks old location in the list and adjust them for better visibility
- if any S/R channel was broken on last move then it gives alert and put shape below/above the candle
- The colors of the S/R channels are adjusted automatically
You can set/change following settings:
- Pivot Period
- Source : High/Low or Close/Open can be used
- Maximum Channel Width %: this is the maximum channel width rate, this is calculated using Highest/Lowest levels in last 300 bars
- Number of S/R to show : this is the number of Strongest S/R to show
- Loopback Period: While calculating S/R levels it checks Pivot Points in LoopBack Period
- Show S/R on last # Bars: To see S/R levels only on last N bars
- Start Date: the script starts calculating Pivot Point from this date, the reason I put this option is for visuality. Explained below
- You can set colors/transparency
- and You can enable/disable shapes for broken S/R levels
Examples:
You can change colors as you wish:
here " Show S/R on last # Bars " set 100:
Sometimes visuality may corrupt because of old S/R levels, to solve it you need to set "Start Date" in the options to start the script in visual part (last 292 bars)
here in first screenshot it doesn't look good (shrink), then on second screenshot I set the "Start Date" it looks better, if you change time frame don't forget to set it again :)
Enjoy!

Support and ResistanceSupport & Resistance Zones
This indicator automatically identifies support and resistance zones by clustering confirmed pivot highs and lows into statistically valid price areas.
Instead of drawing single horizontal lines, it creates price zones whose width is dynamically controlled using ATR (Average True Range), allowing the zones to adapt to market volatility.
Core Logic
The indicator scans a user-defined number of historical bars and detects pivot highs and pivot lows using a configurable pivot strength.
Each new pivot is evaluated against previously detected zones:
A zone becomes visible only after receiving sufficient confirmation (minimum number of pivot touches).
This ensures that only structurally meaningful levels are drawn.
Zone Construction Rules
Zones are formed by grouping pivot points whose total price range remains within ATR range
Each zone expands dynamically as new pivots confirm it
Zones are drawn as rectangular areas, not lines
Zones extend to the right, remaining active until price structure changes
This approach avoids over-plotting and reduces noise commonly seen in traditional support/resistance tools.
Dynamic Zone Coloring
Zones automatically change color based on current price position:
Support Color → Price is above the zone
Resistance Color → Price is below the zone
Neutral (In-Zone) Color → Price is trading inside the zone
This makes it easy to visually assess market context without additional indicators.
Inputs Explained
Logic Settings
Bars to Apply
Number of historical bars scanned to detect pivots and construct zones.
Pivot Strength
Number of candles required on both sides of a pivot high/low for confirmation.
Min Pivot Confirmation
Minimum number of aligned pivots required before a zone is drawn.
Styling
Support, resistance, and in-zone colors
Zone fill transparency
Why This Approach
Uses price structure, not arbitrary levels
Adapts to market volatility via ATR
Filters out weak, single-touch levels
Works across all markets and timeframes
This indicator is designed to highlight areas of interest, not generate buy or sell signals.
It is best used in combination with trend, momentum, or volume-based tools.

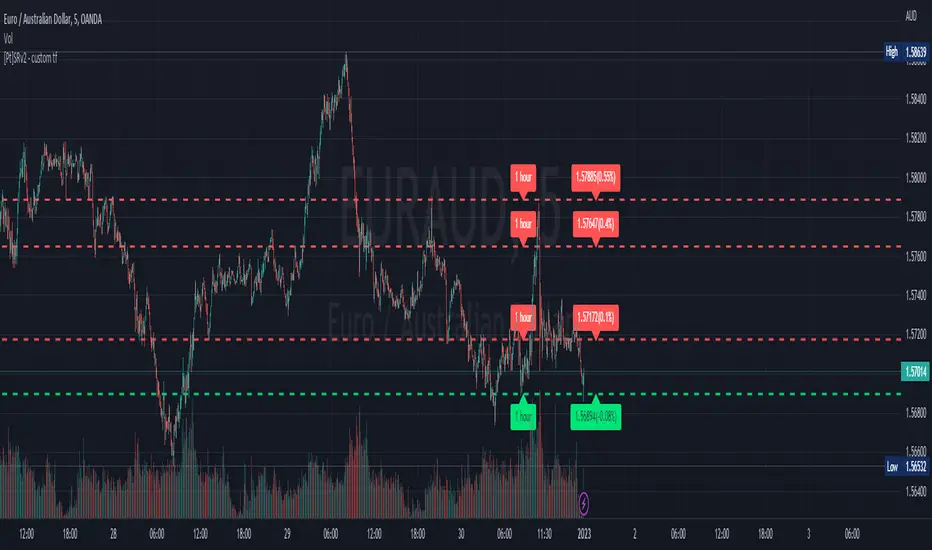
Support Line [by rukich]🟠 OVERVIEW
The indicator displays a floating line that acts as a support level. It's important to remember that any support level can be broken.
🟠 COMPONENTS
The indicator is based on the percentage difference between the closes of the n-th bar back and the current bar. The resulting percentage is smoothed to remove noise.
The indicator is displayed as a green-red line (the colors don’t carry meaning — they are used just for visual variety). When the price touches the support level, the bar background turns green.
For convenience, there is a label on the right side of the indicator showing the current value of the line.
🟠 HOW TO USE
The indicator includes several settings that can be adjusted, though optimal defaults are provided.
Settings:
Timeframe — specifies which timeframe’s data is used to calculate the line.
Candles back — specifies how many bars back from the current one are used.
The indicator should be used according to general support-zone logic. Since no support zone guarantees a price bounce, the optimal approach is to confirm the reaction after the price touches the line.
Example of use:
In the current example, the Timeframe in the indicator settings is set to 1 hour, and the currently open chart is 5 minutes. This means that on the 5-minute chart we see a 1-hour line. After the price touches the support line, you need to see a confirmation of the reaction to understand whether the support zone is holding the price.
In the examples, reaction confirmation is shown through: the formation of an M5 shift and the invalidation of an FVG M5- (the latter is more risky than the M5 shift):
🟠 CONCLUSION
The indicator shows a floating support zone, and when tested, you should confirm the reaction on a lower timeframe.

Active PMI Support/Resistance Levels [EdgeTerminal]The PMI Support & Resistance indicator revolutionizes traditional technical analysis by using Pointwise Mutual Information (PMI) - a statistical measure from information theory - to objectively identify support and resistance levels. Unlike conventional methods that rely on visual pattern recognition, this indicator provides mathematically rigorous, quantifiable evidence of price levels where significant market activity occurs.
- The Mathematical Foundation: Pointwise Mutual Information
Pointwise Mutual Information measures how much more likely two events are to occur together compared to if they were statistically independent. In our context:
Event A: Volume spikes occurring (high trading activity)
Event B: Price being at specific levels
The PMI formula calculates: PMI = log(P(A,B) / (P(A) × P(B)))
Where:
P(A,B) = Probability of volume spikes occurring at specific price levels
P(A) = Probability of volume spikes occurring anywhere
P(B) = Probability of price being at specific levels
High PMI scores indicate that volume spikes and certain price levels co-occur much more frequently than random chance would predict, revealing genuine support and resistance zones.
- Why PMI Outperforms Traditional Methods
Subjective interpretation: What one trader sees as significant, another might ignore
Confirmation bias: Tendency to see patterns that confirm existing beliefs
Inconsistent criteria: No standardized definition of "significant" volume or price action
Static analysis: Doesn't adapt to changing market conditions
No strength measurement: Can't quantify how "strong" a level truly is
PMI Advantages:
✅ Objective & Quantifiable: Mathematical proof of significance, not visual guesswork
✅ Statistical Rigor: Levels backed by information theory and probability
✅ Strength Scoring: PMI scores rank levels by statistical significance
✅ Adaptive: Automatically adjusts to different market volatility regimes
✅ Eliminates Bias: Computer-calculated, removing human interpretation errors
✅ Market Structure Aware: Reveals the underlying order flow concentrations
- How It Works
Data Processing Pipeline:
Volume Analysis: Identifies volume spikes using configurable thresholds
Price Binning: Divides price range into discrete levels for analysis
Co-occurrence Calculation: Measures how often volume spikes happen at each price level
PMI Computation: Calculates statistical significance for each price level
Level Filtering: Shows only levels exceeding minimum PMI thresholds
Dynamic Updates: Refreshes levels periodically while maintaining historical traces
Visual System:
Current Levels: Bright, thick lines with PMI scores - your actionable levels
Historical Traces: Faded previous levels showing market structure evolution
Strength Tiers: Line styles indicate PMI strength (solid/dashed/dotted)
Color Coding: Green for support, red for resistance
Info Table: Real-time display of strongest levels with scores
- Indicator Settings:
Core Parameters
Lookback Period (Default: 200)
Lower (50-100): More responsive to recent price action, catches short-term levels
Higher (300-500): Focuses on major historical levels, more stable but less responsive
Best for: Day trading (100-150), Swing trading (200-300), Position trading (400-500)
Volume Spike Threshold (Default: 1.5)
Lower (1.2-1.4): More sensitive, catches smaller volume increases, more levels detected
Higher (2.0-3.0): Only major volume surges count, fewer but stronger signals
Market dependent: High-volume stocks may need higher thresholds (2.0+), low-volume stocks lower (1.2-1.3)
Price Bins (Default: 50)
Lower (20-30): Broader price zones, less precise but captures wider areas
Higher (70-100): More granular levels, precise but may be overly specific
Volatility dependent: High volatility assets benefit from more bins (70+)
Minimum PMI Score (Default: 0.5)
Lower (0.2-0.4): Shows more levels including weaker ones, comprehensive view
Higher (1.0-2.0): Only statistically strong levels, cleaner chart
Progressive filtering: Start with 0.5, increase if too cluttered
Max Levels to Show (Default: 8)
Fewer (3-5): Clean chart focusing on strongest levels only
More (10-15): Comprehensive view but may clutter chart
Strategy dependent: Scalpers prefer fewer (3-5), swing traders more (8-12)
Historical Tracking Settings
Update Frequency (Default: 20 bars)
Lower (5-10): More frequent updates, captures rapid market changes
Higher (50-100): Less frequent updates, focuses on major structural shifts
Timeframe scaling: 1-minute charts need lower frequency (5-10), daily charts higher (50+)
Show Historical Levels (Default: True)
Enables the "breadcrumb trail" effect showing evolution of support/resistance
Disable for cleaner charts focusing only on current levels
Max Historical Marks (Default: 50)
Lower (20-30): Less memory usage, shorter history
Higher (100-200): Longer historical context but more resource intensive
Fade Strength (Default: 0.8)
Lower (0.5-0.6): Historical levels more visible
Higher (0.9-0.95): Historical levels very subtle
Visual Settings
Support/Resistance Colors: Choose colors that contrast well with your chart theme Line Width: Thicker lines (3-4) for better visibility on busy charts Show PMI Scores: Toggle labels showing statistical strength Label Size: Adjust based on screen resolution and chart zoom level
- Most Effective Usage Strategies
For Day Trading:
Setup: Lookback 100-150, Volume Threshold 1.8-2.2, Update Frequency 10-15
Use PMI levels as bounce/rejection points for scalp entries
Higher PMI scores (>1.5) offer better probability setups
Watch for volume spike confirmations at levels
For Swing Trading:
Setup: Lookback 200-300, Volume Threshold 1.5-2.0, Update Frequency 20-30
Enter on pullbacks to high PMI support levels
Target next resistance level with PMI score >1.0
Hold through minor levels, exit at major PMI levels
For Position Trading:
Setup: Lookback 400-500, Volume Threshold 2.0+, Update Frequency 50+
Focus on PMI scores >2.0 for major structural levels
Use for portfolio entry/exit decisions
Combine with fundamental analysis for timing
- Trading Applications:
Entry Strategies:
PMI Bounce Trades
Price approaches high PMI support level (>1.0)
Wait for volume spike confirmation (orange triangles)
Enter long on bullish price action at the level
Stop loss just below the PMI level
Target: Next PMI resistance level
PMI Breakout Trades
Price consolidates near high PMI level
Volume increases (watch for orange triangles)
Enter on decisive break with volume
Previous resistance becomes new support
Target: Next major PMI level
PMI Rejection Trades
Price approaches PMI resistance with momentum
Watch for rejection signals and volume spikes
Enter short on failure to break through
Stop above the PMI level
Target: Next PMI support level
Risk Management:
Stop Loss Placement
Place stops 0.1-0.5% beyond PMI levels (adjust for volatility)
Higher PMI scores warrant tighter stops
Use ATR-based stops for volatile assets
Position Sizing
Larger positions at PMI levels >2.0 (highest conviction)
Smaller positions at PMI levels 0.5-1.0 (lower conviction)
Scale out at multiple PMI targets
- Key Warning Signs & What to Watch For
Red Flags:
🚨 Very Low PMI Scores (<0.3): Weak statistical significance, avoid trading
🚨 No Volume Confirmation: PMI level without recent volume spikes may be stale
🚨 Overcrowded Levels: Too many levels close together suggests poor parameter tuning
🚨 Outdated Levels: Historical traces are reference only, not tradeable
Optimization Tips:
✅ Regular Recalibration: Adjust parameters monthly based on market regime changes
✅ Volume Context: Always check for recent volume activity at PMI levels
✅ Multiple Timeframes: Confirm PMI levels across different timeframes
✅ Market Conditions: Higher thresholds during high volatility periods
Interpreting PMI Scores
PMI Score Ranges:
0.5-1.0: Moderate statistical significance, proceed with caution
1.0-1.5: Good significance, reliable for most trading strategies
1.5-2.0: Strong significance, high-confidence trade setups
2.0+: Very strong significance, institutional-grade levels
Historical Context: The historical trace system shows how support and resistance evolve over time. When current levels align with multiple historical traces, it indicates persistent market memory at those prices, significantly increasing the level's reliability.

Support and Resistance Logistic Regression | Flux Charts💎 GENERAL OVERVIEW
Introducing our new Logistic Regression Support / Resistance indicator! This tool leverages advanced statistical modeling "Logistic Regressions" to identify and project key price levels where the market is likely to find support or resistance. For more information about the process, please check the "HOW DOES IT WORK ?" section.
Logistic Regression Support / Resistance Features :
Intelligent S/R Identification : The indicator uses a logistic regression model to intelligently identify and plot significant support and resistance levels.
Predictive Probability : Each identified level comes with a calculated probability, indicating how likely it is to act as a true support or resistance based on historical data.
Retest & Break Labels : The indicator clearly marks on your chart when a detected support or resistance level is retested (price touches and respects the level) or broken (price decisively crosses through the level).
Alerts : Real-time alerts for support retests, resistance retests, support breaks, and resistance breaks.
Customizable : You can change support & resistance line style, width and colors.
🚩 UNIQUENESS
What makes this indicator truly unique is its application of logistic regression to the concept of support and resistance. Instead of merely identifying historical highs and lows, our indicator uses a statistical model to predict the future efficacy of these levels. It analyzes underlying market conditions (like RSI and body size at pivot formation) to assign a probability to each potential S/R zone. This predictive insight, combined with dynamic, real-time labeling of retests and breaks, provides a more robust and adaptive understanding of market structure than traditional, purely historical methods.
📌HOW DOES IT WORK ?
The Logistic Regression Support / Resistance indicator operates in several key steps:
First, it identifies significant pivot highs and lows on the chart based on a user-defined "Pivot Length." These pivots are potential areas of support or resistance.
For each detected pivot, the indicator extracts relevant market data at that specific point, including the RSI (Relative Strength Index) and the Body Size (the absolute difference between the open and close price of the candle). These serve as input features for the model.
The core of the indicator lies in its logistic regression model. This model is continuously trained on past pivot data and their subsequent behavior (i.e., whether they were "respected" as support/resistance multiple times). It learns the relationship between the extracted features (RSI, Body Size) and the likelihood of a pivot becoming a significant S/R level.
When a new pivot is identified, the model uses its learned insights to calculate a prediction value—a probability (from 0 to 1) that this specific pivot will act as a strong support or resistance.
If the calculated probability exceeds a user-defined "Probability Threshold," the pivot is designated a "Regression Pivot" and drawn on the chart as a support or resistance line. The indicator then actively tracks how price interacts with these levels, displaying "R" labels for retests when the price bounces off the level and "B" labels for breaks when the price closes beyond it.
⚙️ SETTINGS
1. General Configuration
Pivot Length: This setting defines the number of bars used to determine a significant high or low for pivot detection.
Target Respects: This input specifies how many times a level must be "respected" by price action for it to be considered a strong support or resistance level by the underlying model.
Probability Threshold: This is the minimum probability output from the logistic regression model for a detected pivot to be considered a valid support or resistance level and be plotted on the chart.
2. Style
Show Prediction Labels: Enable or disable labels that display the calculated probability of a newly identified regression S/R level.
Show Retests: Toggle the visibility of "R" labels on the chart, which mark instances where price has retested a support or resistance level.
Show Breaks: Toggle the visibility of "B" labels on the chart, which mark instances where price has broken through a support or resistance level.

Advanced Support and Resistance Levels[MAP]Advanced Support and Resistance Levels Indicator
Author
Developed by:
Overview
The "Advanced Support and Resistance Levels" indicator, created, is a sophisticated tool designed for TradingView's Pine Script v6 platform. It identifies and plots key support and resistance levels on a price chart, enhancing technical analysis by incorporating pivot strength, volume weighting, and level decay. The indicator overlays lines, zones, and labels on the chart, providing a visual representation of significant price levels where the market has historically reversed or consolidated.
Purpose
This indicator, authored by , aims to:
Detect significant pivot points (highs and lows) with customizable strength requirements.
Track and rank support/resistance levels based on their recency, volume, and number of touches.
Display these levels as lines and optional zones, with strength-based visual cues (e.g., line thickness and opacity).
Offer flexibility through user-configurable settings to adapt to different trading styles and market conditions.
Features
Pivot Detection:
Identifies high and low pivots using a strength parameter, requiring a specified number of bars on either side where no higher highs or lower lows occur.
Incorporates closing price checks and SMA-based trend confirmation to filter out noise and ensure pivots align with the broader market direction.
Level Management:
Maintains a dynamic array of levels with attributes: price, type (support/resistance), bars since last touch, strength, and volume.
Merges nearby levels within a tolerance percentage, updating prices with a strength-weighted average.
Prunes weaker or older levels when exceeding the maximum allowed, prioritizing those with higher calculated strength.
Strength Calculation:
Combines the number of touches (strength), volume (if enabled), and age decay (if enabled) into a single metric.
Volume weighting uses a logarithmic scale to emphasize high-volume pivots without over-amplifying extreme values.
Age decay reduces the importance of older levels over time, ensuring relevance to current price action.
Visualization:
Draws horizontal lines at each level, with thickness reflecting the number of touches (up to a user-defined maximum).
Optional price zones around levels, sized as a percentage of the price, to indicate areas of influence.
Labels display the level type (S for support, R for resistance), price, and strength score, with position (left or right) customizable.
Line opacity varies with strength, providing a visual hierarchy of level significance.
Plots small triangles at detected pivot points for reference.
Inputs
Lookback Period (lookback, default: 20): Number of bars to consider for trend confirmation via SMA. Range: 5–100.
Pivot Strength (strength, default: 2): Number of bars required on each side of a pivot to confirm it. Range: 1–10.
Price Tolerance % (tolerance, default: 0.5): Percentage range for merging similar levels. Range: 0.1–5.
Max Levels to Show (maxLevels, default: 10): Maximum number of levels displayed. Range: 2–50.
Zone Size % (zoneSizePercent, default: 0.1): Size of the S/R zone as a percentage of the price. Range: 0–1.
Line Width (lineWidth, default: 1): Maximum thickness of level lines. Range: 1–5.
Show Labels (showLabels, default: true): Toggle visibility of level labels.
Label Position (labelPos, default: "Right"): Position of labels ("Left" or "Right").
Level Strength Decay (levelDecay, default: true): Enable gradual reduction in strength for older levels.
Volume Weighting (volumeWeight, default: true): Incorporate volume into level strength calculations.
Support Color (supportColor, default: green): Color for support levels.
Resistance Color (resistColor, default: red): Color for resistance levels.
How It Works
Pivot Detection:
Checks for pivots only after enough bars (2 * strength) have passed.
A high pivot requires strength bars before and after with no higher highs or closes, and a short-term SMA above a long-term SMA.
A low pivot requires strength bars before and after with no lower lows or closes, and a short-term SMA below a long-term SMA.
Level Tracking:
New pivots create levels with initial strength and volume.
Existing levels within tolerance are updated: strength increases, volume takes the maximum value, and price adjusts via a weighted average.
Levels older than lookback * 4 bars with strength below 0.5 are removed.
If the number of levels exceeds maxLevels, the weakest (by calculated strength) are pruned using a selection sort algorithm.
Drawing:
Updates on the last confirmed bar or in real-time.
Lines extend lookback bars left and right from the current bar, with thickness based on touches.
Zones (if enabled) are drawn symmetrically around the level price.
Labels show detailed info, with opacity tied to strength.
Usage
Add to Chart: Apply the indicator to any TradingView chart via the Pine Script editor, as designed by .
Adjust Settings: Customize inputs to match your trading strategy (e.g., increase strength for stronger pivots, adjust tolerance for tighter level merging).
Interpret Levels: Focus on thicker, less transparent lines for stronger levels; use zones to identify potential reversal areas.
Combine with Other Tools: Pair with trend indicators or oscillators for confluence in trading decisions.
Notes
Performance: The indicator uses arrays and sorting, which may slow down on very long charts with many levels. Keep maxLevels reasonable for efficiency.
Accuracy: Enhanced by trend confirmation and volume weighting, making it more reliable than basic S/R indicators, thanks to 's design.
Limitations: Real-time updates may shift levels as new pivots form; historical levels are more stable.
Example Settings
For day trading: lookback=10, strength=1, tolerance=0.3, maxLevels=5.
For swing trading: lookback=50, strength=3, tolerance=0.7, maxLevels=10.
Credits
Author: – Creator of this advanced support and resistance tool, blending precision and customization for traders.

Support & Resistance AI LevelScopeSupport & Resistance AI LevelScope
Support & Resistance AI LevelScope is an advanced, AI-driven tool that automatically detects and highlights key support and resistance levels on your chart. This indicator leverages smart algorithms to pinpoint the most impactful levels, providing traders with a precise, real-time view of critical price boundaries. Save time and enhance your trading edge with effortless, intelligent support and resistance identification.
Key Features:
AI-Powered Level Detection: The LevelScope algorithm continuously analyzes price action, dynamically plotting support and resistance levels based on recent highs and lows across your chosen timeframe.
Sensitivity Control: Customize the sensitivity to display either major levels for a macro view or more frequent levels for detailed intraday analysis. Easily adjust to suit any trading style or market condition.
Level Strength Differentiation: Instantly recognize the strength of each level with visual cues based on how often price has touched each one. Stronger levels are emphasized, highlighting areas with higher significance, while weaker levels are marked subtly.
Customizable Visuals: Tailor the look of your chart with customizable color schemes and line thickness options for strong and weak levels, ensuring clear visibility without clutter.
Proximity Alerts: Receive alerts when price approaches key support or resistance, giving you a heads-up for potential market reactions and trading opportunities.
Who It’s For:
Whether you're a day trader, swing trader, or just want a quick, AI-driven way to identify high-probability levels on your chart, Support & Resistance AI LevelScope is designed to keep you focused and informed. This indicator is the perfect addition to any trader’s toolkit, empowering you to make more confident, data-backed trading decisions with ease.
Upgrade your analysis with AI-powered support and resistance—no more manual lines, only smart levels!

Candle Body Support/Resistance [LuxAlgo]The Candle Body Support/Resistance indicator is a tool that provides Support/Resistance levels from high-volatility candles, a concept originally described by Steve Nison in "Beyond Candlesticks".
Users can define the candle body percentage used to set the detected support/resistance levels. Occurrences of price testing the returned levels are highlighted using user-customizable dots.
🔶 USAGE
Support/Resistance levels are drawn from volatile candles, that is candles having a body (range between opening and closing price) whose magnitude is larger than the Volatility Threshold , which is determined by the multiplicative factor of an ATR (Average True Range) using a user set length.
The level starts from the opening price +/- a percentage of the open-close range. Users can adjust the percentage of the candle body used as support/resistance levels respectively, with higher percentage values returning levels prone to get reached sooner by the price.
A test is considered valid when a wick passes through the Support/Resistance level while the closing price is not breaking it.
Two modes are included, Trailing and Historical , both affecting the displayed elements of the indicator, these are described in the sub-section below.
🔹 Historical
The Historical Mode will draw a separate line from every Volatile Candle . When this line is tested, a dot will be drawn.
In the above example, the red resistance line was tested once until a bullish volatile candle formed, which closed just below the resistance level. The resistance level was tested again, after which the newly created support level was broken quickly, and the price decreased. These levels proved helpful later, acting as resistance/support levels (illustrated by the extra manually drawn dashed white lines).
To prevent cluttering Support/Resistance , lines will be deleted when the line is mitigated and hasn't been tested.
When a Support/Resistance line reaches its Maximum Line Length , it will also be deleted when it has not been tested.
🔹 Trailing
When a new volatile candle of the same type (bullish/bearish) appears while the Support/Resistance isn't broken, this line will be updated with the values of the new volatile candle. This creates a trailing line and a less cluttered chart.
Unlike the Historical mode , a line will not be deleted after a while or when it is mitigated. Instead, the line won't be updated anymore. A new line will start from the next found volatile candle.
Using the same situation as the Historical Mode example, we can note the future significance of old support/resistance levels (illustrated by the extra manually drawn dashed white lines).
The user can switch between these 2 modes, each offering a unique perspective on the market. This provides a more in-depth examination of the market, enhancing the user's trading analysis.
Using a copy of our indicator while using both modes can also be helpful.
🔶 DETAILS
The Support level is the opening price of a bullish volatile candle plus a user-set percentage of the candle's body, while the Resistance level is the opening price of a bearish volatile candle minus a percentage of the candle's body.
The following example illustrates the ATR with the multiplicative factor (Volatility Threshold) where the body of Volatile candles exceeds the ATR limits. Changing the Volatility Threshold and ATR length gives users extra flexibility to adjust to their needs.
🔹 Max Line Length
When using the Historical Mode and the duration of a displayed level reaches the user-set Max Line Length value, the level will return to the last test or be deleted when it has not been tested.
🔶 SETTINGS
Display Mode: Display mode of the indicator.
Support %: Sets the distance of the Support Line from the opening price relative to the candle body.
Resistance %: Sets the distance of the Resistance Line from the opening price relative to the candle body.
🔹 Filter
Length ATR: Amount of bars for the calculation of the Average True Range.
Volatility Threshold: multiplicative factor of ATR.
Max Line Length: Maximum allowed duration/length (in bars) of a Support/Resistance level.

Support Resistance base Volume RSIThe indicator displays support and resistance levels based on volume and the Relative Strength Index (RSI).
Variable and Input Assignment:
lookback: Determines the period for data lookback.
RsiVisible, RsilabelSize, OversoldForRsi, OverboughtForRsi: Various inputs to adjust RSI indicator parameters.
Indicator Calculation:
highestVol: Finds the highest volume within a certain period.
Rsi: Calculates the RSI value with a period of 14.
roc: Calculates the Rate of Change.
Support and Resistance Level Determination:
Uses a comparison between price change (roc) and RSI value to determine whether the price is rising or falling.
If the price is rising and the current volume is greater than the previous highest volume, a new resistance level is established.
If the price is falling and the current volume is greater than the previous highest volume, a new support level is established.
Support and Resistance Lines:
Creates lines indicating the latest support and resistance levels.
These lines are updated whenever there is a change in support or resistance levels.
RSI Labels:
Displays the RSI value above or below the price chart depending on whether the RSI is above or below the overbought or oversold levels.
If the RSI value is above the overbought level, the label is displayed above the price.
If the RSI value is below the oversold level, the label is displayed below the price.
Labels are removed if the corresponding conditions are not met.
Additional RSI Label:
Adds an additional label displaying the RSI value next to the price chart on the last bar.
The main purpose of this script is to assist traders in identifying support and resistance levels based on price movement, volume, and the RSI indicator. Thus, traders can use this information to make better trading decisions.

Autodrawn Support and Resistance LevelsAutodrawn Support and Resistance Levels is an indicator that helps traders identify key support and resistance levels on a chart. These levels are important because they can help traders make decisions about when to buy or sell an asset. The indicator uses three lookback periods to identify recent highs and lows and then draws lines at the highest support and resistance levels for those periods. The lines are color-coded, with green indicating support and red showing resistance. The thickness of the lines can also be adjusted to match a trader's preferences. The lines are updated automatically as new data is added to the chart, making it easy for traders to identify new levels of support and resistance as they emerge. Overall, this indicator is a helpful tool for traders who want to quickly and easily identify critical levels on a chart to inform their trading decisions.
By having one lookback period on a medium-term timeframe (e.g. 50), a short-term timeframe (e.g. 10), and a long-term timeframe (e.g. 300), it can be easier to identify support and resistance levels that are relevant to the current market trend, and see multiple critical levels at once. This can help you make more informed decisions about when to enter and exit trades, as well as where to set stop-loss orders. It may be valuable to consider that as shorter-term and longer-term support/resistance levels become closer together, it is more likely for there to be a reversal in the opposite direction.
This indicator is less useful in markets that have strong trends, where the horizontal support and resistance levels are likely to be less useful than trend line support and resistance levels, however it works well in sideways trading markets
Note: reupload since previous description violated tradingview rules

Support Resistance - Dynamic v2 w/ Timeframe optionThis script is a modification from the awesome "Support Resistance - Dynamic v2" by @LonesomeTheBlue
This script is very similar to the original indicator mentioned above, but with a modification that, in my opinion, would be very useful for many traders. It enables the option to choose different timeframe to calculate the S/R levels. Very often, traders would like to use higher timeframes to define S/R levels, rather than using the same timeframe that they are trading at. For example, if trading at 5min, we often use 15min, 30min or 1hr timeframe to define our S/R levels.
For example, below shows S/R levels from three different timeframes:
Hope you find value in this indicator~ Enjoy~