Improved Scalping Consolidation and Squeeze IndicatorThe Improved Scalping Consolidation and Squeeze Indicator (Improved Scalp C&S) is a custom TradingView indicator designed for short-term trading, specifically scalping. It detects price consolidation and potential breakout scenarios using a combination of technical analysis tools, such as the Rate of Change (ROC), Relative Strength Index (RSI), Moving Average Convergence Divergence (MACD), Bollinger Bands, and Keltner Channels. To reduce the number of false signals, this improved version introduces a "consolidation strength" parameter, which represents the minimum number of consecutive bars required for a valid consolidation or squeeze signal.
How it works:
Consolidation Detection:
The indicator identifies price consolidation when the following conditions are met:
a. RSI is between 45 and 55, indicating a lack of strong momentum.
b. The absolute value of the MACD histogram is less than 0.1% of the closing price, suggesting a lack of directional movement.
c. The Rate of Change (ROC) is less than 1.5%, indicating relatively stable prices over the specified period.
Squeeze Detection:
The indicator detects a squeeze (a potential breakout scenario) when the Bollinger Bands are within the Keltner Channels, represented by the following conditions:
a. The lower Bollinger Band is above the lower Keltner Channel.
b. The upper Bollinger Band is below the upper Keltner Channel.
Consolidation Strength:
The consolidation strength parameter filters out weaker signals by requiring a minimum number of consecutive bars for a valid consolidation or squeeze signal. By adjusting this parameter, traders can control the sensitivity of the indicator to short-term price movements and potentially reduce the number of false signals.
When the consolidation strength criteria are met, the indicator colors the price bars within the pattern yellow for consolidation and orange for a squeeze, signaling potential trading opportunities.
Trading Strategy:
The Improved Scalping Consolidation and Squeeze Indicator can be used in various ways, depending on the trader's strategy and risk appetite. Here are some suggestions:
Range trading: During consolidation (yellow bars), traders can buy at support levels and sell at resistance levels within the range, using stop-loss orders to manage risk. However, this approach might not work well in the case of a sudden breakout.
Breakout trading: When a squeeze is detected (orange bars), traders can wait for a confirmed breakout from the consolidation pattern before entering a trade. A breakout can be confirmed by a strong price move accompanied by increased volume, a significant change in momentum, or a breach of important support or resistance levels.
Momentum-based strategies: Traders can use other momentum-based indicators (e.g., Stochastic Oscillator, On Balance Volume) in conjunction with the Improved Scalp C&S indicator to identify potential entry and exit points during consolidation or breakout scenarios.
Fine-tuning the consolidation strength: Adjust the "consolidation strength" input to find the optimal balance between the number of signals and their accuracy. A higher value will result in fewer signals, potentially reducing the number of false signals, but it may also make the indicator less sensitive to short-term price movements.
스크립트에서 "scalp"에 대해 찾기

Theft Indicator - 5Min Scalping SystemWhat is our indicator?
Theft Indicator - Buy & Sell Alert System is our first published script that shows price action on a certain period of time (We Use ATR indicator). We take pride in enabling trading to become easier for the experienced and the non-experienced traders around the globe. Buy & Sell alerts will be fired once a condition in our algo is met.
Does it Repaint?
Our indicator does NOT re-paint. Although while setting an alert it may pop up the repaint alert, please take into consideration that once a signal is fired on a "CLOSED BAR", our signal will never disappear, they do not repaint.
What Markets is it usable with?
You can use it in any market, Forex, Stocks, Crypto, Indices. All time frames are profitable, not all trades. But the Majority is profitable if you use a stop loss and target price.
How to use:
Simple plug and play it to your chart, in addition to a few other indicators we will recommend to you (we still have not published them yet), and this will confirm your trades. You can also connect TV alerts with a bot and let it run. Please be aware that SLIPPAGE time is important, If you run a bot on this indicator you HAVE to know that the buy/sell price will be on the bar AFTER the Candle close (For example: the BUY/SELL alert is on a candle, the buy/sell your bot or you will execute WILL be in the following candle depending on your trading system. We advise you to not leave the bot to trade on its own, you have to monitor and have a specific syntax that we will help you with creating according to your trading style.
How are the Buy/Sell Alerts fired?
We use the simple ATR (Average True Range) indicator. However we have modified the indicator to serve our trading system. Check below for a definition of what ATR is:
What is Average True Range - ATR?
The average true range (ATR) is a technical analysis indicator that measures market volatility by decomposing the entire range of an asset price for that period. Specifically, ATR is a measure of volatility introduced by market technician J. Welles Wilder Jr. The true range indicator is taken as the greatest of the following: current high less the current low; the absolute value of the current high less the previous close; and the absolute value of the current low less the previous close. The average true range is then a moving average, generally using 14 days, of the true ranges.
Why is our indicator special and different from the normal ATR indicators?
We have modified the mathematical equation and changed it slightly to give more accurate signals, we do not promise all trades are profitable, the use of this indicator is up to your own judgement and liability. We believe that we have an indicator like no other ATR.
P.S: This is not financial advice, we are just sharing our indicator that we know has good results, and it will take time for people in -ve profiles to recover losses and for the profiting to be more profitable. We use a specific trading method that only works with it
You can contact me for more information about the indicator, Goodluck :)

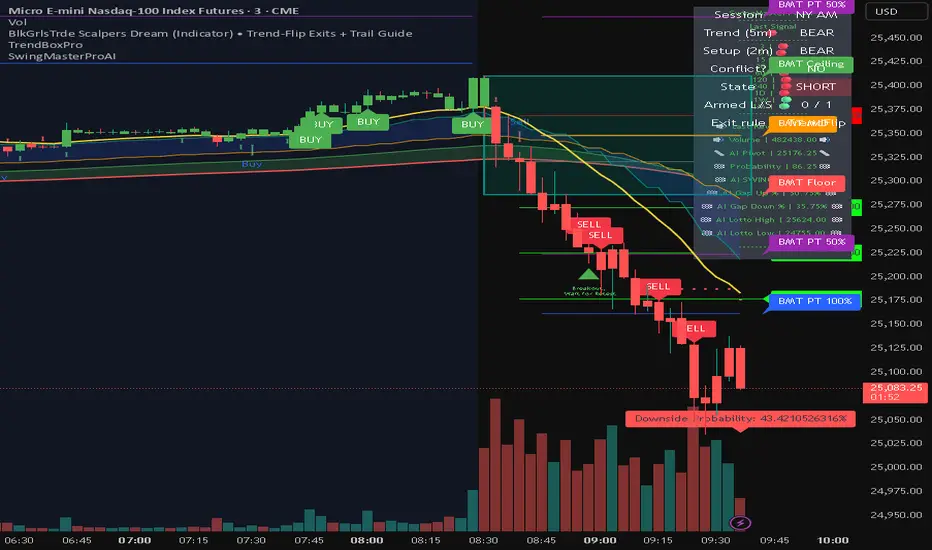
BlkGrlsTrde Scalpers DreamBlkGrlsTrde – Scalpers Dream (MNQ)
BlkGrlsTrde – Scalpers Dream is a discretionary scalping indicator designed specifically for Micro E-Mini Nasdaq (MNQ) traders who want clear, structured entries and exits without clutter or over-engineering.
This tool focuses on momentum continuation after key price reactions, helping traders stay aligned with higher-timeframe context while executing on lower timeframes such as the 1-minute chart.
What It Provides
Clear BUY and SELL signals for scalp entries
Structured trade levels with:
Stop level
TP1 (partial target)
TP2 (runner target)
Exit signals, including:
TP1 hit
TP2 hit
Stop hit
Exit on opposite signal
No-Trade (Conflict) state when conditions do not align, displayed clearly in gray so you know when to stand down
Session awareness for London, NY AM, and NY PM trading windows
On-chart status panel showing current market state at a glance
Designed For
MNQ scalpers
Traders who prefer structure but manual execution
Traders who want clarity over complexity
Live trading during active sessions without constant indicator stacking
How to Use
Best used on MNQ 1-minute charts
Take signals in the direction of the displayed bias
Manage risk using the plotted stop and targets
Stand aside during NO TRADE states
Use TP1 to reduce risk and TP2 for runners
This is an indicator, not an automated trading system. It is intended to support disciplined decision-making, not replace it.
Disclaimer
This indicator is for educational and informational purposes only. Trading futures involves substantial risk. Always manage risk appropriately and trade within your plan.
GOGO SCALPER# GOGO SCALPER - Advanced Multi-Timeframe Trading Indicator
## Overview
GOGO SCALPER is a comprehensive trading indicator that combines multiple proven trading concepts into one powerful tool. It provides automated bias detection, session analysis, market structure tracking, and high-probability entry signals for scalpers and day traders.
## Key Features
### 🎯 Auto Bias System
- **Dual Timeframe Analysis**: Automatically tracks both Lower Timeframe (LTF) and Higher Timeframe (HTF) bias using EMA-based momentum
- **Dynamic Confidence Scoring**: Real-time confidence percentage (0-100%) for BUY/SELL signals based on multiple market factors
- **Smart Signal Generation**: Only triggers entries when both timeframes align during active trading sessions
### 📊 Market Phase Detection
- **Expansion vs Consolidation**: Automatically identifies whether the market is in an expansion or consolidation phase
- **Multi-Metric Analysis**: Uses Bollinger Band Width, Average Daily Range (ADR), and ATR ratios to determine market conditions
- **Trend Strength Indicator**: Shows whether the current trend is STRONG or WEAK
### 🕒 Killzone Session Management
- **Four Major Sessions**: Asia, London, NY AM, and NY PM killzones with customizable times
- **Visual Session Boxes**: Color-coded boxes highlighting active trading sessions
- **Session Range Tracking**: Displays the price range for each killzone session
- **Auto Time Remaining**: Shows countdown timer for active sessions
### 📈 Multi-Timeframe Structure Analysis
- **HTF Candle Visualization**: Displays H1, H4, and Daily candles as mini-charts on your current timeframe
- **Sweep Detection**: Automatically identifies bullish and bearish liquidity sweeps
- **Numbered Candle System**: Labels candles 1-5 leading up to sweeps for pattern recognition
- **Counter-Sweep Protection**: Filters out invalidated sweeps automatically
### 🔍 Market Structure Tools
- **CISD (Close in Structure Detection)**: Identifies when price closes through pivot highs/lows
- **FVG Detection**: Automatically plots Fair Value Gaps (Bullish & Bearish) with mitigation tracking
- **H4 & Daily Open Lines**: Tracks key opening prices with dynamic extension
- **High/Low Levels**: Plots session highs and lows with breakout alerts
### 📋 Information Dashboard
- **Comprehensive Table Display**: Shows all critical information at a glance
- Current HTF and LTF bias
- Active session
- Trend strength
- Signal direction
- Confidence percentage
- Entry confirmation status
- Market phase (Expansion/Consolidation)
- Killzone ranges
### ⚡ Entry Signal System
- **BUY Signal**: Triggers when price crosses above Bollinger Band upper level during bullish bias
- **SELL Signal**: Triggers when price crosses below Bollinger Band lower level during bearish bias
- **Session Filter**: Signals only activate during configured killzone sessions
- **Confirmation Labels**: Clear "Long Confirm!" or "Short Confirm!" messages with "Wait!" during invalid conditions
## How It Works
### Bias Calculation
The indicator compares current price against EMA on both lower and higher timeframes:
- **BULLISH**: Price above EMA
- **BEARISH**: Price below EMA
- **NEUTRAL**: Price at EMA
### Confidence Scoring
The confidence score (0-100%) is calculated using:
- HTF/LTF bias alignment (25%)
- Active session quality (20%)
- Volume analysis (15%)
- ATR momentum (15%)
- RSI position (15%)
- Trend strength (10%)
- BB position (10%)
### Market Phase Detection
Uses a voting system from three metrics:
- Bollinger Band Width relative to average
- Average Daily Range achievement percentage
- ATR ratio to moving average
When 2+ metrics vote for expansion, market is in "EKSPANSI" phase, otherwise "KONSOLIDASI".
## Best Use Cases
- **Scalping**: 1-5 minute charts with 15m/1H/4H higher timeframes
- **Day Trading**: 5-15 minute charts with 1H/4H/Daily higher timeframes
- **Session Trading**: Focus on London and NY AM sessions for highest probability setups
- **Confluence Trading**: Wait for HTF/LTF alignment + high confidence + active session
## Customization Options
- Adjustable EMA length and Bollinger Band settings
- Customizable killzone session times and colors
- Configurable HTF timeframes and candle count
- Toggle visibility for all components (FVGs, sweeps, lines, boxes)
- Flexible table position and display options
## Recommended Settings
- **1-3 minute charts**: Use 5m/15m/1H for HTF analysis
- **5-15 minute charts**: Use 1H/4H/Daily for HTF analysis
- **Focus on major sessions**: Enable London and NY AM for best results
- **Wait for 60%+ confidence**: Higher confidence = higher probability trades
## Notes
- Works best on liquid markets (Forex majors, indices, major crypto pairs)
- Designed for active trading sessions (avoid low-volume periods)
- Combines with price action for best results
- Not a standalone system - use proper risk management
---
**Disclaimer**: This indicator is for educational and informational purposes only. Past performance does not guarantee future results. Always practice proper risk management and never risk more than you can afford to lose.

One Leg Scalper, Aren TradingOne Leg Scalper — Precision Buy/Sell Signals for Every Market:
One Leg Scalper is a clean, fast and lightweight signal-based indicator designed for traders who want simple, accurate, rule-based entries without noise or chart clutter.
This tool detects a unique three-point market formation and automatically generates Buy or Sell signals when price confirms the structure with momentum.
It works on all markets (Crypto, Forex, Indices, Commodities) and on all timeframes, including scalping charts such as 1s,5s, 15s, 1m, 5m....
No complicated settings.
No repainting beyond the natural pivot confirmation.
Just clear signals based on price structure.
Key Features
✔ Automatic Buy & Sell signals:
Signals appear only after the market completes a verified structure and confirms it with price action.
✔ Works on all timeframes (including seconds):
Ultra-fast reactions for scalpers + higher-timeframe confirmation for swing traders.
✔ Non-intrusive chart design:
No extra shapes or distracting drawings — only clean labels placed exactly where they matter.
✔ Multi-market support:
Crypto, Forex, Stocks, Indices, Metals, Futures — fully compatible with every chart on TradingView.
✔ Smart internal filtering (three filters):
Reduces noise and ignores weak structures to focus only on meaningful setups.
How it Works (Simple Version — No Mechanism Revealed)
The indicator continuously tracks price structure and identifies a specific pattern formed by three market swing points.
When this structure completes and price confirms it, the indicator prints:
Buy → when bullish validation occurs
Sell → when bearish validation occurs
This ensures signals are triggered only after confirmation, avoiding premature or fake setups.
🔥free trial is available
“A 3-day free trial is available upon request.
Message me to unlock temporary access and test the indicator in real market conditions.”
Repainting Notice
The indicator waits for confirmed swing points, which requires a few bars of confirmation.
This is normal behavior for all pivot-based tools and does not repaint after confirmation.
Version 1.0 — Initial Release
Added delay confirmation settings.
Added minimum distance & price-difference filters.
Added customizable labels and alerts.
Early-signal raw-bar system (no repaint).
Optimized pivot storage for performance.
Disclaimer:
This indicator is a tool for technical analysis. Trading involves risk. Always use proper risk management and never risk more than you can afford to lose.

God of Scalping BTCUnleash divine precision in the chaotic realm of BTC scalping with the God of Scalping BTC—a bespoke, price-action powerhouse crafted for lightning-fast entries and exits on 1-5 minute charts. Forged from raw momentum velocity (no recycled RSI or MACD here), this indicator detects micro-trend accelerations to pinpoint surge moments where BTC's volatility bends to your will.Core Mechanics:Velocity Engine: Calculates fast (default: 3-bar) and slow (default: 8-bar) price speeds, then derives normalized acceleration using ATR (14-bar) to filter noise in BTC's wild swings.
Surge Detection: Smoothed signal line confirms crossovers—bullish when acceleration surges above signal with positive bias; bearish on the downside.
Volume Guardian: Triggers only on 20%+ volume spikes above its EMA (10-bar), ensuring conviction behind the chaos.
Visual Oracle:Blue/Red Lines: Fast (EMA close, 3-bar) and slow (EMA close, 8-bar) velocity trends for trend context.
Background Glow: Subtle green/red tint for real-time momentum bias.
Divine Arrows: Green triangles below bars for BUY surges; red above for SELL—your scalp signals from the heavens.
Scalping Ritual:Optimal Altar: Load on BTCUSD/USDT (1m-5m). Tune lengths for your broker's feed.
Invocation: Enter long on green arrow (target 0.1-0.3% gains), short on red. Tight stops at recent swings; exit on opposite signal or threshold breach (1.5x mult).
Alerts: Built-in notifications—"God Surge Buy: BTC Scalp Entry!"—to summon you mid-prayer (er, trade).
Backtested for BTC's fury, this isn't a holy grail, but a scalper's Excalibur: pure, adaptive, and unyielding. Trade wisely—markets are mortal, your edge is eternal.

NTL SCALP v2 with TP & SL (Absolute)NTL SCALP v2 with TP & SL (Absolute) – Scalping Trend System
Timeframe Example: 15-minute (XAUUSD)
Indicator Type: Combined trend-following and momentum-based scalping system
🔍 Purpose of This Indicator
This script is designed as a unified tool for intraday scalpers, combining multiple essential components—trend detection, entry signal logic, and automated risk management—into one streamlined system. Rather than simply merging various indicators, it integrates them with a clear purpose: to generate trade setups with actionable entries and realistic TP/SL targets in trending markets.
📌 Core Components & How They Work Together
Multi-Ribbon EMA Trend Filter
Multiple Exponential Moving Averages (EMAs) are used to detect short-, medium-, and long-term trends.
The EMA ribbons visually shift from red (bearish) to green (bullish) depending on the overall price structure.
These ribbons not only indicate trend direction but also serve as dynamic support/resistance levels.
Momentum-Based Entry Signals
Buy and sell signals are triggered when price momentum aligns with the trend (e.g., bullish breakout above EMAs with supporting candle structure).
The system ensures that trades are only taken in the direction of the prevailing trend, reducing the likelihood of false signals.
Auto-Generated Entry, TP & SL Levels
Once a valid setup is detected, the script plots the entry price, stop-loss (SL), and up to four take-profit (TP1–TP4) targets.
These levels are based on recent volatility and trend strength, allowing traders to manage risk and reward efficiently.
Labels such as “TP1 HIT” or “SL HIT” are displayed on the chart to show trade progress in real-time.
✅ How to Use This Indicator
Designed for scalping and short-term trend trading during high-volume market sessions (e.g., London/New York).
Ideal for traders who prefer clear rules for entry, exit, and risk management.
Can be used standalone, but works even better with confirmation from price action or volume-based tools.
🛑 Note
To ensure effective performance, avoid using this tool in ranging or low-volatility markets. It is optimized for trending environments.
⚠️ Disclaimer
This script is intended for educational purposes and does not constitute financial advice. Always conduct your own analysis and apply risk management when trading.

TTM Scalper AlertTTM Scalper Alert — Real-Time Pivot Detector
Description:
This is a custom implementation of the classic TTM Scalper Alert, adapted to show early pivot detection and trend structure tracking in real-time. The script identifies potential highs and lows before the full pivot confirmation—giving traders an early edge—and removes outdated signals once pivots are confirmed.
It supports two levels of detection:
Fast Alert Pivots : Identified after Alert Period candles confirm a local reversal.
Confirmed Pivots : Validated only after Pivot Period candles on both sides ensure a true swing high/low.
How It Works:
Fast Detection (Early Pivots):
Detected after Alert Period (AP) candles. These are provisional signals, shown as triangle labels (▲▼) near current price. Only the latest signal is shown; previous fast pivots are deleted to avoid clutter.
Confirmed Pivots:
Detected with a full lookback of Pivot Period (PP) on both sides of the candle. Shown using plotshape with triangle markers (▲▼). Serve as anchors for price structure analysis (HH-HL or LL-LH tracking).
Custom Source Option:
Users can choose to base pivots on High/Low or Close/Open range. Helps adjust sensitivity depending on volatility or bar structure.
How to Interpret:
Trend & Market Structure:
Use Confirmed Pivots (plotshapes) to analyze market structure:
HH → HL: Uptrend
LL → LH: Downtrend
Watch for breaks in structure for possible reversals
Early Alerts:
The floating labels (▲▼) represent early warnings of a potential pivot. Use them to anticipate:
Short-term exhaustion
Quick scalping entries
Divergence setups
Inputs:
Source : Choose from High/Low or Close/Open — affects how pivots are calculated
Alert Period : How fast the script detects an early reversal pattern (used for entry timing)
Pivot Period : How many candles before/after to confirm a full pivot (used for structural analysis)
Best For:
Traders who follow price action and structure
Scalpers and intraday traders who want early signals
Anyone using pivot highs/lows for confluence with other tools (like RSI divergence, Bollinger Bands, VWAP, etc.)
Pro Tips:
Combine this with:
Trend Magic or Supertrend for directional bias
Volume spike filters to confirm reversal intent
RSI/CCI divergence to strengthen reversal pivots
Adjust Alert Period to tune early signal sensitivity (lower = faster but noisier)

Intraday Pivot Highs & Lows (Asia London NY)Intraday Pivot Highs & Lows (Asia London NY)
Script Description
This TradingView indicator is optimized for Forex, scalping, intraday, and day trading strategies. It accurately plots Pivot Points and levels, high/low, support and resistance levels. These are clearly identified to aid the trader during killzone sessions and session opens. Ideal for scalp trading, intraday sessions, and leveraging SMT (Smart Money Techniques). Utilize these Price Levels effectively during London Open, NY Open, and the Asia Session, utilizing Market Structure to pinpoint key levels and reversal zones for successful trading. Improve your Trade Setups, recognize reliable Chart Patterns, identify critical Price Pivots, and trade confidently off Institutional Levels.
This script marks the intraday pivot highs, lows and midpoints retracement levels for
Asia
London
New York
It also plots the previous day's high, low, midpoint, and 0.618 Fibonacci retracement levels, providing traders with critical price reference points for making intraday trading decisions.
Originality & Usefulness
This indicator uniquely integrates pivot calculations across three major Forex sessions (Asia, London, NY), clearly delineating session boundaries.
It enhances visibility by using distinct styling
solid for New York
dashed for London
dotted lines for Asia
And colour co-ordinated labeling, improving traders' ability to identify important intraday price action zones efficiently. Unlike standard pivot indicators, this script emphasizes session-specific trading dynamics.
### Key Features ###
Session-Based Levels: Automatically plots high, low, midpoint, and Fibonacci (.618) levels for each major session (Asia, London, NY).
Distinct Visual Cues: Lines and labels use session-specific styles and colors to easily differentiate between sessions.
Previous Day Reference: Clearly plots and labels yesterday's high, low, midpoint, and Fibonacci levels.
Flexible Visibility: Traders can set timeframe visibility to maintain clean charts on higher timeframes.
### How It Works
At the start of next day's session, previous session lines are cleared, ensuring the chart remains uncluttered.
High, low, midpoint, and Fibonacci retracement levels (.618) are dynamically calculated and displayed at the close of each session.
All session levels remain visible until the start of the next respective session, providing continuous actionable insights.
Trading Application:
Session highs and lows act as strong intraday support and resistance zones.
Midpoints and Fibonacci levels are effective for identifying potential reversal zones and retracements.
Daily levels provide a broader context, useful for gauging intraday volatility and range.
### Limitations and Considerations ##
Best used on liquid assets with clear session-based price action, such as Forex major pairs, if used on indexes make sure they contain 24 hour price action not just New York session.
This indicator is designed to streamline intraday trading by clearly marking essential pivot points and session-based levels, significantly improving traders' market context and decision-making accuracy. Can be used to enhance SMT decision making when scalping killzones.

TrendSync Pro (SMC)📊 TrendSync Pro (SMC) – Advanced Trend-Following Strategy with HTF Alignment
Created by Shubham Singh
🔍 Strategy Overview
TrendSync Pro (SMC) is a precision-based smart trend-following strategy inspired by Smart Money Concepts (SMC). It combines: Real-time pivot-based trendline detection
Higher Time Frame (HTF) filtering to align trades with dominant trend
Risk management via adjustable Stop Loss (SL) and Take Profit (TP)
Directional control — trade only bullish, bearish, or both setups
Realistic backtesting using commissions and slippage
Pre-optimized profiles for scalpers, intraday, swing, and long-term traders
🧠 How It Works:
🔧 Strategy Settings Image:
beeimg.com
The strategy dynamically identifies trend direction by using swing high/low pivots. When a new pivot forms: It draws a trendline from the last significant pivot
Detects whether the trend is up (based on pivot lows) or down (based on pivot highs)
Waits for price to break above/below the trendline
Confirms with HTF price direction (HTF close > previous HTF close = bullish)
Only then it triggers a long or short trade
It exits either at TP, SL, or a manual trendline break
🛠️ Adjustable Parameters:
Trend Period: Length for pivot detection (affects sensitivity of trendlines)
HTF Timeframe: Aligns lower timeframe entries with higher timeframe direction
SL% and TP%: Customize your risk-reward profile
Commission & Slippage: Make backtests more realistic
Trade Direction: Choose to trade: Long only, Short only, or Both
🎛️ Trade Direction Control:
In settings, you can choose: Bullish Only: Executes only long entries
Bearish Only: Executes only short entries
Both: Executes both long and short entries when conditions are met
This allows you to align trades with your own market bias or external analysis.
📈 Entry Logic: Long Entry:
• Price crosses above trendline
• HTF is bullish (HTF close > previous close)
• Latest pivot is a low (trend is considered up)
Short Entry:
• Price crosses below trendline
• HTF is bearish (HTF close < previous close)
• Latest pivot is a high (trend is considered down)
📉 Exit Logic: Hit Take Profit or Stop Loss
Manual trendline invalidation: If price crosses opposite of the trend direction
⏰ Best Timeframes & Recommended Settings:
Scalping (1m to 5m):
HTF = 15m | Trend Period = 7
SL = 0.5% | TP = 1% to 2%
Intraday (15m to 30m):
HTF = 1H | Trend Period = 10–14
SL = 0.75% | TP = 2% to 3%
6 Hour Trading (30m to 1H):
HTF = 4H | Trend Period = 20
SL = 1% | TP = 4% to 6%
Swing Trading (4H to 1D):
HTF = 1D | Trend Period = 35
SL = 2% | TP = 8% to 12%
Long-Term Investing (1D+):
HTF = 1W | Trend Period = 50
SL = 3% | TP = 15%+
Note: These are recommended base settings. Adjust based on volatility, asset class, or personal trading style.
📸 Testing Note:
beeimg.com
TradingView limits test length to 20k bars (~40 trades on smaller timeframes). To show long-term results: Test on higher timeframes (e.g., 1H, 4H, 1D)
Share images of backtest result in description
Host longer test result screenshots on Imgur or any public drive
📍 Asset Behavior Insight:
This strategy works on multiple assets, including BTC, ETH, etc.
Performance varies by trend strength:
Sometimes BTC performs better than ETH
Other times ETH gives better results
That’s normal as both assets follow different volatility and trend behavior
It’s a trend-following setup. Longer and clearer the trend → better the results.
✅ Best Practices: Avoid ranging markets
Use proper SL/TP for each timeframe
Use directional filter if you already have a directional bias
Always forward test before going live
⚠️ Trading Disclaimer:
This script is for educational and backtesting purposes only. Trading involves risk. Always use risk management and never invest more than you can afford to lose.

Luxmi AI Ultimate 1 Min Option ScalperThe Luxmi AI Ultimate 1 Min Option Scalper is a specialized trading indicator designed for use in options trading. This tool is particularly focused on providing actionable signals to option buyers within a one-minute timeframe, making it highly suitable for scalping—a trading strategy aimed at profiting from small price changes. Below is an elaboration on how this indicator functions and its significance in trading decisions:
### Key Features of Luxmi AI Ultimate 1 Min Option Scalper
1. **Enter and Don't Signals:**
- **Enter Signals:** These signals indicate the optimal moments to enter a trade, suggesting when to buy an option. They are typically based on sophisticated algorithms that analyze price movements, volume, volatility, and other relevant market data.
- **Don't Signals:** These signals advise traders to refrain from entering a trade. This could be due to market conditions that are not conducive to profitable trading, such as high volatility, low liquidity, or unclear directional trends.
2. **Directional Trading Strategy:**
- The Luxmi AI Ultimate 1 Min Option Scalper focuses on directional trading, which involves making trades based on the expected direction of the market. For option buyers, this means taking positions that profit from upward (call options) or downward (put options) movements in the price of the underlying asset.
3. **Scalping Approach:**
- Scalping is a short-term trading strategy that involves making numerous trades over the course of a trading session, aiming to capitalize on small price changes. The one-minute timeframe is particularly suited for scalping, as it allows traders to quickly enter and exit positions to capture minimal but frequent profits.
### Functionality and Benefits
1. **Real-Time Analysis:**
- The indicator provides real-time analysis and signals, ensuring that traders receive timely information to make quick trading decisions. This is crucial in the fast-paced environment of scalping, where delays can significantly impact profitability.
2. **Automated Decision-Making Support:**
- By automating the signal generation process, the Luxmi AI Ultimate 1 Min Option Scalper helps reduce the cognitive load on traders. This automation can lead to more consistent trading performance, as it mitigates the impact of emotional and psychological factors that often influence human decision-making.
3. **Market Adaptability:**
- The indicator is designed to adapt to changing market conditions, adjusting its signals based on the latest data. This adaptability enhances its effectiveness in various market environments, whether trending, ranging, or highly volatile.
4. **Risk Management:**
- Incorporating "Don't" signals as part of the strategy helps traders avoid entering trades in unfavorable conditions, thereby managing risk more effectively. This feature is particularly valuable in preventing losses and preserving capital.
5. **Educational Value:**
- For less experienced traders, using the Luxmi AI Ultimate 1 Min Option Scalper can provide a learning experience. By observing the signals and their outcomes, traders can develop a better understanding of market dynamics and refine their trading strategies.
### Practical Application
- **Setup:** Traders integrate the Luxmi AI Ultimate 1 Min Option Scalper into their trading platforms. This setup typically involves installing the indicator and configuring it to monitor the specific options and market data relevant to the trader's strategy.
- **Monitoring:** During trading hours, traders monitor the signals provided by the indicator. They prepare to act quickly on "Enter" signals and heed "Don't" signals to avoid unnecessary risks.
- **Execution:** When an "Enter" signal is generated, traders execute the recommended trade, buying the corresponding option. They then manage their positions closely, ready to exit based on their predetermined profit targets or stop-loss levels.
In summary, the Luxmi AI Ultimate 1 Min Option Scalper is a powerful tool for option buyers, providing critical buy and hold signals in a highly time-sensitive manner. Its primary benefits include enhancing decision-making speed, improving trading consistency, and managing risk, all of which are essential for successful scalping in options trading.

VWAP BANDS [qrsq]Description
This indicator is used to find support and resistance utilizing both buying and selling volume. It can be used on lower and higher time frames to understand where price is likely to reject or bounce.
How it works
Instead of calculating the VWAP using the total volume, this script estimates the buying/selling volume and respectively calculates their individual VWAP's. The standard deviations of these are then calculated to create the set of two bands. The top bands being the VWAP from buying volume and bottom bands are from selling volume, with the option to use a double band on either pair.
How to use it
I like to use the bands for LTF scalping as well as HTF swings, I also like to use it alongside my SMA VWAP BANDS.
For scalping:
I tend to use either the 5m or 15m TF
I then set the indicator's TF to 1m
I will take a scalp based on the bands confluence with other PA methods, if price is being either supported or rejected.
For swings:
I tend to use a variety of TFs, including: 30m, 1H, 4H, D
I then set the indicator's TF to "Chart"
I will take a swing based on the bands confluence with other PA methods, if price is being either supported or rejected.
I also tend to use them on perpetual contracts as the volume seems to be more consistent and hence results in more accurate support and resistance.

SMA VWAP BANDS [qrsq]Description
This indicator is used to find support and resistance utilizing both SMA and VWAP. It can be used on lower and higher time frames to understand where price is likely to reject or bounce.
How it works
Rather than using the usual calculation for the VWAP, instead this script smooths the volume first with the SMA and then respectively calculates the smoothed multiplication of high, low and close price with the volume individually. These values are then divided by the smoothed volume to find individual VWAP's for each of the sources. The standard deviations of these are calculated, resulting in an upper, lower and middle band. It is essentially VWAP bands with some smoothed calculations in the middle.
How to use it
I like to use the bands for LTF scalping as well as HTF swings.
For scalping:
I tend to use either the 5m or 15m TF
I then set the indicator's TF to 1m
I will take a scalp based on the bands confluence with other PA methods, if price is being either supported or rejected.
For swings:
I tend to use a variety of TFs, including: 30m, 1H, 4H, D
I then set the indicator's TF to "Chart"
I will take a swing based on the bands confluence with other PA methods, if price is being either supported or rejected.
I also tend to use them on perpetual contracts as the volume seems to be more consistent and hence results in more accurate support and resistance.

Scot Signal IndicatorThe Scot Signal Indicator is intended as a Scalping Resource. It was designed to work best on the ❗❗ 5 MINUTE CHART with Bitcoin ❗❗ / USD & USDT pairs.
🟡🔼🔽 Yellow Triangles : these are pre-signals. If the triangle is Pointing Down, then look for a possible Short to come, and vice-versa for Upward facing triangles will go Long.
* Be careful, this is a Canary in the Coal Mine, but not the full signal. Going purely on the triangle as a signal could lead to fake-outs more frequently.
🟩 🟥 Green & Red Boxes : these are "Long" & "Short" signals where the indicator feels the time is safe to enter a trade.
❗ EXITING THE TRADE ❗ : this is a scalping indicator, specifically meant for entering trades, NOT EXITING them. An ideal scalp is $100 - $200 Bitcoin move. Though, we run bots using this indicator, taking scalps as little
as $60, performing up to 8 trades a day.

Intraday rejection levels3 supports, 3 resistances and an equilibrium price per day displayed at 9am (GMT+2), calculated on the dynamic study of the market at its opening over a certain period that we could qualify as "first opening interventions"
Method: We are interested in the first reaction of the market when it discovers one of the levels.
The red and green zones (from levels R2 to R3) are the zones of rejections/daily overextensions with large RRs of which we will appreciate a rejection for the US opening (where the zones are more opaque, the Killzone!), because the session US is known to either accompany the London session or completely break the trend.
Equilibrium, on the other hand, is a retest zone that can be traded in several directions, ideal for capturing the first retracement / retest of a recently broken structure:
Activate "EL" to display an ideally early morning rejection area so levels can be scalped! They correspond to opportunistic areas above the high and below the low of a custom Asian session ignoring part of the London open - which I consider to be liquidity :):
FIRST SETUP: Confluence R1/R2 with the EL!
SECOND SETUP: The price does not frequent the R2/R3 zone during London but only during the killzone:
Anticipate rejection zones, put them in confluence to find the best opportunity!
Tips:
I'm only interested in the first reaction on these levels
You can measure the difference between R1 and EQ: on average on the EURUSD it must be 20 to 30 pips! Apart from these values, I deduce that the market is unbalanced: I lower my risk on my scalps and I am more cautious.
It is possible to use the previous day's levels to look for correlations
Ideally, the Asia range Custom should not take the high/low of the day before (see "LIquidity maps" indicator on our profile for optimal use)
As an option you can display the standard pivot, and activate the "crypto" mode to be able to use it on your favorite crypto :)

FY Forex ScalperFy Forex Scalper Indicator:
A powerful indicator that you can use to scalp forex markets, it helps you identify the trend and direction of the market in both long term and short term time frames. The Arrows give you entry points. Read the detailed explanation below and if you have any questions feel free to message.
How does it work:
Fy Forex Scalper has two main aspects one is candles and the other is band both are color coded and works independently. As we all know, markets are not always trending and often move in a tight range. The Fy Forex Scalper indicator assists you in identifying trading opportunities by displaying trading zones and non-trading zones by painting the candles in three different colors: red, yellow, and green. When the candles are red, the script is in the selling zone, when the candles are green, the script is in the buying zone, and when the candles are yellow, the script is non trading zone. The band mainly works as support and resistance and gives you overall trend direction, If the band is red the trend direction is down and if band is in green the trend is up. So both candles and band give you the trend direction how to enter the trade explained below.
How to enter the trade:
Long Entry: Enter the trade when you get the up arrow near the band and make sure the band color is green. When you get the up arrow and band is red you can consider it as false signal.
Short Entry: Enter the trade when you get a down arrow near the band and make sure the band color is also red. When you get the down arrow and the band is in green color you can consider it as a false signal.
What markets it work:
Mainly use it for Forex, Crypto or scripts that move faster.
What time frame is best:
Use 5 mins when the market is moving (like Asian or London opening) use one min when the market isn’t moving.
Can we use it for Swing Trading:
Though it works , but the primary purpose of this indicator is for scalping so better use it on shorter time frames.
How to get access:
This is invite only script so to get access message me.

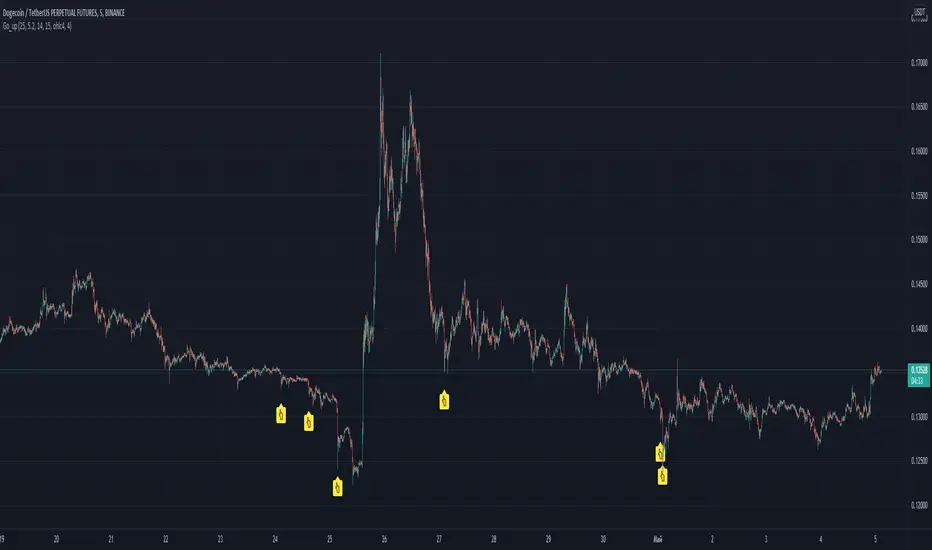
Go_up Hello. Our task is to find the local minimum. The trade is entered on the basis of RSI and SMA according to a specific formula, which is embedded in the code. When the RSI crosses the SMA upside down, a long position is entered. You can change the length of the RSI. The longer the length, the less frequent, but more accurate the entrance, and vice versa. You can use a different time frame. The default RSI length is 25 and the time frame is 15 minutes. Use hooks for auto trading, there is an alert. I recommend using a larger number of altcoins and with the default settings or TF 5 minutes. If you want to "scalp", then use the length 15-21 and take profit 0.5-2 percent. See the history of signals and you can make the optimal strategy for yourself. Due to the strong volatility, these settings are optimal. I use position averaging over history, additional purchase occurs no more than three times, before going into a plus. Entering a trade in notifications "once per bar". To exit, you can use scripts from other authors, for example, pivot / resistance points. No repainting. If anyone has any questions, write, I will answer in detail. good luck trading, dear friends!
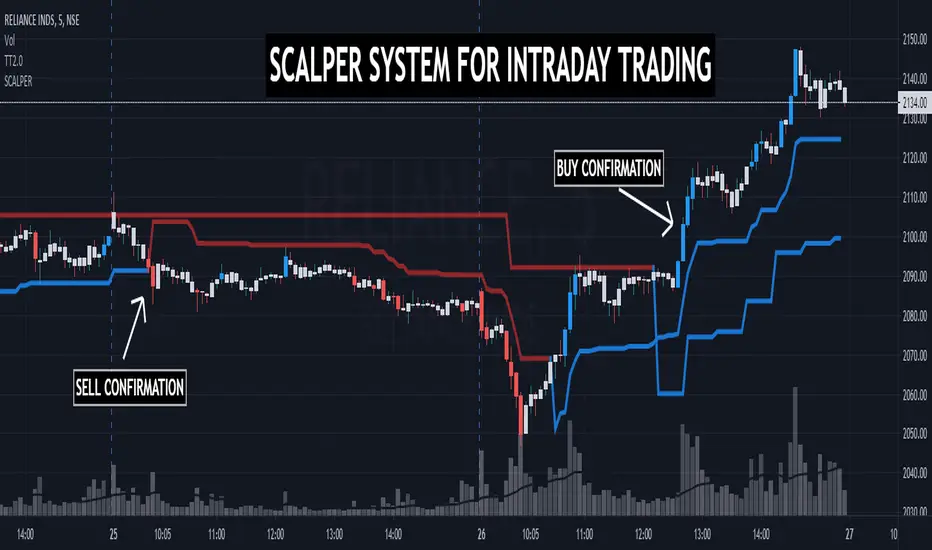
TRADINGEDGE ACADEMY'S INTRADAY SCALPING SYSTEMTE SCALPER has been designed to assist the traders during the live market hours in their decision making process. Along with Multitimeframe Trend Analyzer, this system supports the traders to quickly decide ENTRY & EXIT prices while SCALPING.
TimeFrame: Works best in 3mins & 5mins TF.
How to take entry:
1. Conifrm Trend using Multitimeframe Trend Analyzer.
BLUE - BULLISH
RED - BEARISH
2. FOR BULLISH ENTRY
1st BLUE candle shows probable BUYING ENTRY. 2nd BLUE candle closing above the 1st BLUE candle gives CONFIRMATION.
After CONFIRMATION, BUY at candle's HIGH with last wave's LOW as SL for TARGET R:R - 1:1.
REMEMBER, THIS IS A SCALPING TOOL. KEEP BOOKING PROFITS.
3. FOR BEARISH ENTRY - Folow the same rules.
NOTE - For DEMO & ACCESS, contact me.
EMA 21,13,8 - scalping3 EMAs will help identify and predict uptrends and downtrends
-If EMAs are all above the candles it a sign to sell & if the EMAs are below its a sign to buy
- If the Green-8 EMA crosses or touches red candle then flips under the other EMAs & candles then it's time to sell
-If the Green-8 EMA crosses or touches green candle then flips above the other EMAs & candles then it's time to buy
- how far is the EMAs from the candle it'll show how strong the trend. combine this strategy with the stochastic oscillator & RSI to get the maximum benefit

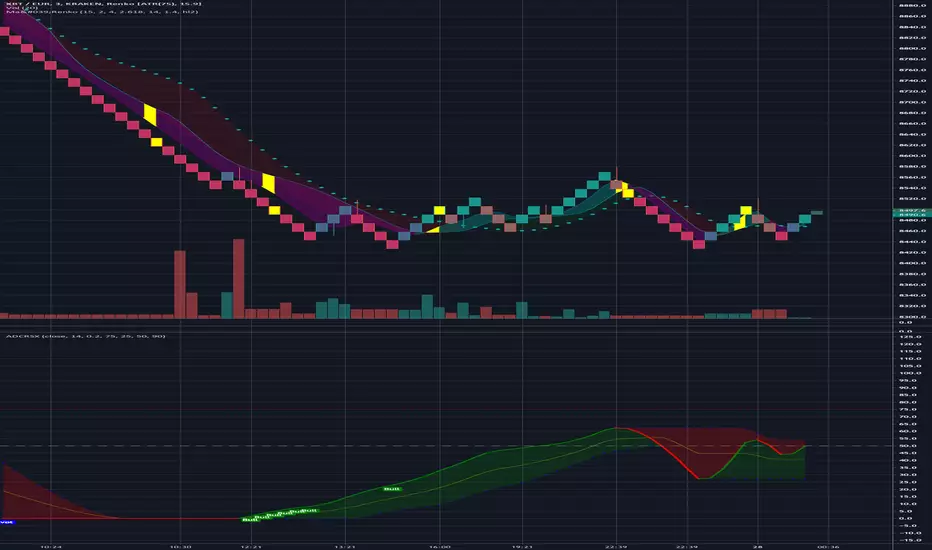
Ma'RenkoMa'Renko is simple, yet powerful trading system designed to help scalpers who use Renko charts (including ATR-based, but it should work with any type of candles as well). The thickness of color bands represents different trend characteristics (mostly volume and speed of price changing) which allow a trader to filter out false pivot points, enter and exit more wisely. The chart speaks for itself.
Dow Jones 5 Minutes Up Down Scalp with extratradeAfter my DJI 15M Scalper -> here is the 5 Min Scalper.
Only with DJI 5 Min!
No Stop LOSS!!

Crypto Market Maker w/ AlertsUltimate Trading Tool. Simple af 1.07% 1.07% . Follow signals, chart if you want to confirm.
Takes only trades with proper risk to reward ratio.
At times calls absolute top and bottom.
Can be used on ALTs as well.
Based on Neural Networks.
Can be used on 60m,30m,15m,5m, 3m 0.32% 0.32% 0.32% -0.88% - As this is basically a SCALPER. (use with leverage)
Works best in my experience on 15m.
This is the indicator for alerts, check my profile for the strategy with backtest.
Alerts -> Crypto Market Maker -> Plot -> Long/Short - Once Per Bar Close
This Level of Strategy, will not be free. PM for access - Monthly Subscription.

Crypto Market Maker w/ BacktestUltimate Trading Tool. Simple af 1.07% . Follow signals, chart if you want to confirm.
Takes only trades with proper risk to reward ratio.
At times calls absolute top and bottom.
Can be used on ALTs as well.
Based on Neural Networks.
Can be used on 60m,30m,15m,5m, 3m 0.32% 0.32% -0.88% - As this is basically a SCALPER. (use with leverage)
Works best in my experience on 15m.
This is strategy for backtest, check my profile for the indicator with alerts.
This Level of Strategy, will not be free. PM for access - Monthly Subscription.
