TTC EMA Scalping Machine with RSI Filter and MACDTTC EMA Scalping Machine with RSI Filter and MACD
TTC EMA Scalping Machine with RSI Filter and MACD is a multi-layered technical analysis tool designed for traders looking to scalp the markets with a combination of trend-following and momentum-based indicators. This strategy leverages Exponential Moving Averages (EMAs) , Relative Strength Index (RSI) , MACD , and Volume Analysis to help traders identify high-probability entry points for short and long trades. The indicator can be used in multiple market conditions and is suited for both beginners and experienced traders looking for clear entry signals.
---
Key Features :
1. EMA-Based Trend Filtering :
- The indicator uses four Exponential Moving Averages (EMAs) with different periods:
- EMA 10 (Short-Term) : The fastest-moving average for detecting quick price movements.
- EMA 20 (Medium-Term) : A central trendline for market momentum.
- EMA 30 (Long-Term) : To observe broader market trends.
- EMA 50 (Longest-Term) : To identify the overall market direction.
- These EMAs are plotted on the chart and used to create EMA bands , visually displaying potential support and resistance levels. Price action inside these bands helps identify scalping opportunities.
2. RSI Filter :
- RSI (Relative Strength Index) is used to gauge overbought and oversold conditions in the market:
- Overbought condition (RSI > 70) : The market may be overextended, signaling the possibility of a short.
- Oversold condition (RSI < 30) : The market may be undervalued, signaling the possibility of a long.
- The RSI filter ensures that trades are not taken when the market is overextended, offering a more conservative approach to trade entries.
3. MACD Momentum Analysis :
- The MACD (Moving Average Convergence Divergence) indicator is included to confirm the trend and momentum direction:
- Long Condition : The MACD line crosses above the signal line, confirming a bullish momentum.
- Short Condition : The MACD line crosses below the signal line, confirming a bearish momentum.
- This serves as an additional filter to verify if the market momentum aligns with the long or short entry criteria.
4. Long Entry (Buy Signal) :
- A long entry signal is triggered when the following conditions are met:
- The price is above EMA 20 (indicating an overall bullish market).
- The price is within the green EMA band (EMA 10 and EMA 20), suggesting short-term support.
- The RSI is below 70 (indicating the market is not overbought).
- The MACD line is above the signal line , showing bullish momentum.
- These conditions combined suggest an ideal environment for entering a long position.
5. Short Entry (Sell Signal) :
- A short entry signal is triggered when the following conditions are met:
- The price is below EMA 20 (indicating an overall bearish market).
- The price is within the green EMA band (EMA 20 and EMA 30), suggesting short-term resistance.
- The RSI is above 30 (indicating the market is not oversold).
- The MACD line is below the signal line , showing bearish momentum.
- These conditions combined suggest an ideal environment for entering a short position.
6. Signal Alerts :
- Long Alerts : Users can set alerts to notify them when a long condition is met. These alerts are triggered when all the criteria for a long entry are satisfied.
- Short Alerts : Similarly, users can set alerts for short signals, notifying them when all the conditions for a short entry are satisfied.
7. EMA Bands :
- The EMA bands are visually represented with colored fills between the EMAs, providing a visual aid to recognize potential trading zones. These zones can serve as a reference for traders to make quick decisions regarding entries and exits.
8. Volume Filter :
- The indicator also includes a volume filter , which compares the current volume to its 20-period simple moving average. Higher volumes provide confirmation of price movement, which can indicate stronger potential for the trade.
---
How It Works :
- Long Trades : The indicator suggests a long position when the price is above the EMA 20, within the green EMA band, the RSI is not overbought, and MACD confirms bullish momentum (MACD line above the signal line).
- Short Trades : The indicator suggests a short position when the price is below the EMA 20, within the green EMA band, the RSI is not oversold, and MACD confirms bearish momentum (MACD line below the signal line).
- Volume Confirmation : The indicator uses a volume-based filter to ensure the trade is backed by sufficient market participation.
---
Usage :
- Best for Scalping : This strategy is designed for short-term trades ( scalping ) and can be applied to any time frame, though it works best on intraday charts, such as 5-minute or 15-minute charts.
- Ideal for Trend-Following : With the use of EMAs and MACD, the strategy is best suited for markets that exhibit clear trends. It helps to avoid whipsaw trades and focuses on capturing medium-term trends.
- Risk Management : By using RSI, MACD, and volume analysis together, this strategy reduces the likelihood of entering a trade in an overextended market, which helps with risk management.
---
Alerts and Signals :
- Long Signals : When all conditions are met for a long trade, a green label appears below the price bar, indicating a potential buy opportunity. An alert is also generated, notifying the user.
- Short Signals : When all conditions are met for a short trade, a red label appears above the price bar, indicating a potential sell opportunity. An alert is also generated, notifying the user.
---
This combination of EMA , RSI , MACD , and volume-based filters creates a balanced approach to scalping, ensuring that traders receive clear, actionable entry signals with trend confirmation, while avoiding overbought and oversold conditions that may lead to false signals. The indicator is designed to help traders confidently identify high-probability trades while maintaining simplicity and clarity in its setup.
스크립트에서 "scalp"에 대해 찾기

Heikin-Ashi Trend ScalpHeikin-Ashi Trend Scalp is an indicator for TradingView, designed to identify short-term trends and entry points based on Heikin-Ashi candles and EMA crossovers.
Key Features:
Attention Signals: Early warning of potential entry points.
Buy/Sell Signals: Filtered signals based on the prevailing trend.
Filters (Slow Mode, Shadow Filter): Help reduce the number of false signals.
Shadow Filter: Eliminates false signals caused by shadows against the trend.
The warning bar should not have any shadow against the trend.
If the bar with the buy/sell signal has a shadow that crosses the opening level of the warning bar, the signal disappears.
Since the signal may disappear as the candle forms, entries should only be made after the signal has been confirmed.
It is not recommended to disable the Shadow Filter, as doing so may lead to an increase in false signals.
Slow Mode: Reduces false signals by using longer-term EMA crossovers. For timeframes of 1–5 minutes, it is recommended to use Slow Mode to reduce false signals.
EMA Lines (7, 21, 50): Displayed for trend determination. Depending on the selected mode: in standard mode, EMA 21 (fast) is shown, in Slow Mode, the longer-term EMA 50 (slow) is displayed.
Stop-Loss Price: Automatically set at the opening level of the candle two bars ago and displayed on the chart.
RSI: Displays the current value of the RSI indicator and visualizes it with color:
Red — for overbought conditions (above 70).
Green — for oversold conditions (below 30).
Yellow — for values in the neutral zone (between 30 and 70).
Alerts: Notifications for new signals in real-time.
The indicator is ideal for scalping and short-term trading, especially when used in conjunction with other technical analysis tools.

Ultimate T3 Fibonacci for BTC Scalping. Look at backtest report!Hey Everyone!
I created another script to add to my growing library of strategies and indicators that I use for automated crypto trading! This strategy is for BITCOIN on the 30 minute chart since I designed it to be a scalping strategy. I calculated for trading fees, and use a small amount of capital in the backtest report. But feel free to modify the capital and how much per order to see how it changes the results:)
It is called the "Ultimate T3 Fibonacci Indicator by NHBprod" that computes and displays two T3-based moving averages derived from price data. The t3_function calculates the Tilson T3 indicator by applying a series of exponential moving averages to a combined price metric and then blending these results with specific coefficients derived from an input factor.
The script accepts several user inputs that toggle the use of the T3 filter, select the buy signal method, and set parameters like lengths and volume factors for two variations of the T3 calculation. Two T3 lines, T3 and T32, are computed with different parameters, and their colors change dynamically (green/red for T3 and blue/purple for T32) based on whether the lines are trending upward or downward. Depending on the selected signal method, the script generates buy signals either when T32 crosses over T3 or when the closing price is above T3, and similarly, sell signals are generated on the respective conditions for crossing under or closing below. Finally, the indicator plots the T3 lines on the chart, adds visual buy/sell markers, and sets alert conditions to notify users when the respective trading signals occur.
The user has the ability to tune the parameters using TP/SL, date timerames for analyses, and the actual parameters of the T3 function including the buy/sell signal! Lastly, the user has the option of trading this long, short, or both!
Let me know your thoughts and check out the backtest report!

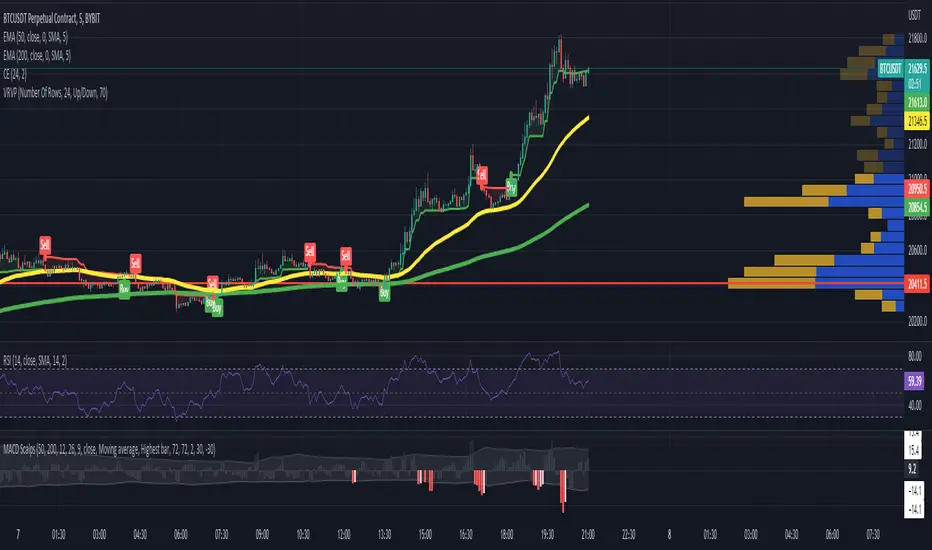
Scalp System# Scalp System
A premium scalping system designed specifically for 2-minute charts, combining multiple timeframe analysis with trend-based trading decisions. This indicator helps identify high-probability scalping opportunities through color-coded moving averages and their crossovers.
## Strategy Overview
### Entry Signals
- ONLY trade LONG when price is above RED line
- ONLY trade SHORT when price is below RED line
- Primary entry: BLUE/GREEN crosses
- Strong trend confirmation: YELLOW/PURPLE crosses
### Best Practices
1. Trade with the trend (follow RED line direction)
2. Wait for price pullbacks of faster lines
3. Combine crosses with support/resistance levels
4. Use smaller targets
5. Quick exits on failed breakouts
6. Monitor volume for confirmation
### Color Guide
- YELLOW: Fast trend identifier
- BLUE: Very short-term momentum (1min)
- GREEN: Short-term momentum (3min)
- RED: Trend filter
- PURPLE: Strong trend baseline
### Risk Management
- Place stops beyond the RED line
- Scale out at key levels
- Use 1:1.5 minimum risk/reward
- Avoid trading during major news
- Reduce position size in choppy markets
### Best Trading Hours
- Most effective during first 2 hours after market open
- Good opportunities during power hour (last hour)
- Avoid lunch hour chop (11:30-1:30 EST)
## Tips
- Less is more - wait for clean setups
- Respect the RED line as your trend filter
- Multiple timeframe confirmation increases success rate
- Use crosses as triggers, not absolute signals
- Practice in simulator before live trading

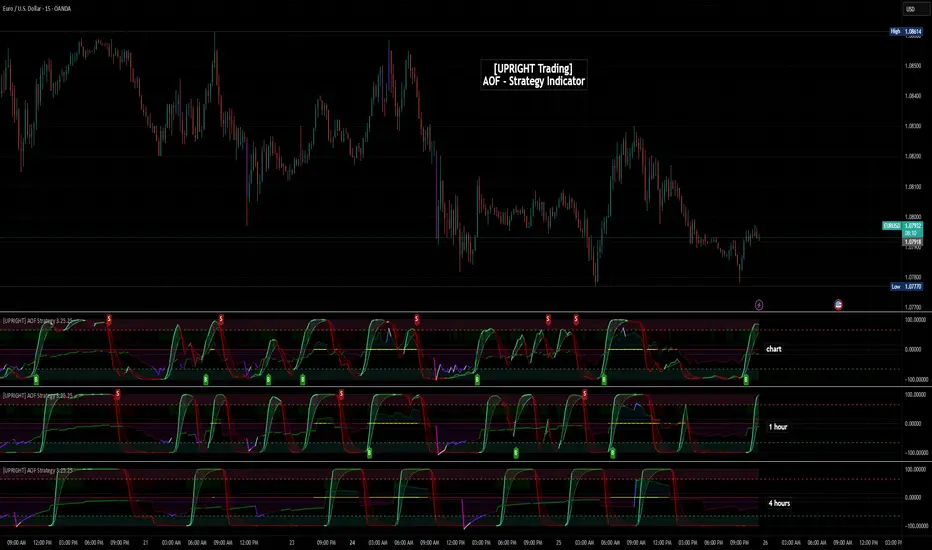
[UPRIGHT Trading] Academy of Forex - Scalp Strategy█ OVERVIEW
This is a collaboration of efforts of The Academy of Forex and UPRIGHT Trading .
The Academy of Forex - Scalp Strategy Indicator is a clean & reimagined lower indicator. To enable optimization & potential automation, we re-coded & optimized it at UPRIGHT Trading.
It is based on the one presented on its YT channel.
The idea is for it to be an easy to use - simple indicator - that works not just for confirmation, but also entering and exiting quickly (scalping).
█ CONCEPTS
The idea is that %B (derived from BBs) is able to pick up some pretty significant moves. With that as one of the bases the Inverse Fisher Transform (Ribbon) acts to show some of the movement of the asset highlighting when it at extremes. The RSI highlights are there as another confirmation to help normalize the sometimes too frequent movement of %B.
As expected the indicator often acts as a reversal indicator, but with the optimizations of logic it's able to pick up more than just the reversals and works as a pretty decent Buy/Sell Algorithm.
█ CALCULATIONS
Calculations used included, but not limited to:
- %B - Quantifies the price as a percentage to the Upper and Lower Band of the Popular Bollinger Bands, which were named after their inventor John Bollinger in 1980.
- Inverse Fisher Transform RSI - is a variation of the IFT, created by John Ehlers, the idea is for the IFT to convert Gaussian normal distribution and to take it a step further the RSI version is to just use overbought and oversold placements. This indicator is meant to highlight when price has moved to an extreme and in this process helps to spot turning points.
- Relative Strength Index (RSI) - As most of you know already the RSI is a technical analysis tool invented by J. Welles Wilder, that oscillates and is used to measure the momentum of price changes. It normalizes to index 0-100 with overbought and oversold defined by the user, but often around 70 as overbought and 30 as oversold.
- Pivot/Swing Points - Implemented to show recent Higher-Highs or Lower-Lows, Pivot points are included in the indicator for structure tracking.
- Moving Averages - Moving averages help to get an idea of when price is moving near the norm or outside to extremes.
█ FEATURES
Indicator Features:
-2 Buy/Sell Signals.
-U Signals (UPRIGHT optimized).
-Exit Reminders.
-Alerts allowing Automation of Scalp Strategy.
-H/L Swings.
-Color Customization.
-Clean Mode.
-Inverse Fisher Transform Ribbon.
-RSI Bullish/Bearish Highlights.
-Options for More Signals (including: Oversold/Overbought Circles, %B Bull/Bear Squares and Triangles, and IFT Highlights).
Showing some of the signals close up.
Should look like this:
Enjoy!
Sincerely,
Mike
3 Fib EMAs To Scalp Them AllThe "3 Fib EMAs To Scalp Them All" was made in order to clear up when we should look for shorts, longs, or walk away. Also it can alert you when a trend starts, or when there is a possible reversal. I use it for scalping/day trading in 5m-1h timeframes.
1. EMAs: By default, the indicator uses Fibonacci numbers (21, 55, 233), but you can change them.
2. Color Changes: The color of the Micro EMA line changes depending on its relation to the Mid and Macro EMAs.
When Micro EMA < Mid < Macro EMA, it turns red, indicating a potential bearish trend - that's when you should look for shorts
When Micro EMA > Mid > Macro EMA, it turns green, indicating a potential bullish trend - that's when you should look for longs
A white Micro EMA is when you need to take some rest, enjoy your coffee, and avoid overtrading.
3. Signals: The indicator provides visual signals in the form of diamonds and crosses and corresponding alert signals.
A red diamond above the bar signals a potential beginning of a downtrend
A red cross above the bar signals the end of the downtrend and can be used as a signal for a possible reversal up/breakout.
A green diamond below the bar signals a potential beginning of a downtrend,
A green cross below the bar signals the end of the uptrend and can be used as a signal for a possible reversal down/breakout.
4. Alerts: For algo traders and people who prefer to stay away from the monitor... there are alerts for every signal.
Friendly note: Don't blindly follow the signals for your long and short entries. The signals only pop up when the EMA cross value gets a confirmation. A smart move would be to wait for a retracement to the EMA line and use momentum indicators like market cipher B to pinpoint those ideal entry points.

[SPOILED]SuperTrench - ETH Super ScalperHi Traders,
I'm republishing this script as I finally polished it to perfection IMO. The script uses 5 coding sections: entry, trend filter, pivot filter, take profit, and stop loss. The script mainly uses trailing as take profit; this is probably the easiest way to make a profitable scalper strategy.
Backtest capital is set to 1000 USDT, 35% equity, 0.04% commission, limited backtest date from Jan 2022 to now, backtested on ETH/USDT prep contracts 15m timeframe, result as shown below.
It looks unreal right? Hell no, I actually tested this strategy on Binance from Dec 06 to Dec 10. I got 8.29% return with 4x leverage, 50% equity setup; 75% win rate,1.58 profit factor, with 4.3% max drawdown, it is amazingly close to the backtest result.
User Manual
Entry >>> Stoch RSI:
I added 5 MA types to the Stoch RSI which is HMA/VWMA/WMA/EMA/SMA, HMA with Length setting of 5, 8 seems to be most efficient, VWMA and WMA with 8, 13 will generate less entry signals but with less entry risks.
Entry >>> R Style:
It based on price action, with candlestick makes a U turn, after 2nd candlestick confirmed, it generates entry signal, this will give you some extra entries, better leave it enabled.
Entry >>> Price Step:
This probably is the core feature of this strategy; also my secret ingredient to making this strategy this efficient. It is recommended to enable step 1-5, more steps basically means more entries, but they are not necessarily profitable.
Trend Filter >>> Price Step:
I couldn't tell you much details about how this indicator works, but it is a reliable indicator, based on price action, and I got some ideas from Demark9 indicator. The bigger the level, the stronger the filter is, please note that if 'Price Step Entries' less than Price Step Trend, entries will be ignored.
Pivot Filter >>> RSI Pivot & Pinbar Pivot:
RSI Pivot detects if the RSI signal line making U turn in certain condition, Pinbar detection combines R Style entry when price action U turn took place, these 2 pivot filter will close the trade once it is counter trend, so it better enable and leave it as is.
Trend Filter >>> Trend Magic:
Trend Magic uses CCI and ATR to calculate trend status, green means uptrend, red means downtrend, pretty straight forward, the best value for this indicator would be, 21, 34, 55, 89.
Trend Filter >>> Alpha:
This filter combines R style pivot, price step, EMA all together to detects consolidation area, because EMA was involved, so the best look back period would be around 15-35, it is best to use default value IMO, in another hands, if you need stronger filter, feel free to use 10, 18, 20, 25, 30, 35, make sure look back period should increase or decrease by 5 every time.
Take Profit and Stop Loss:
The default value for tp is set to 0.4%, but I also give you option to switch to ATR TP; you can adjust in the ATR multiplier, default ATR trailing stop loss uses 1 ATR, but you can adjust it for better drawdown tolerance. Fixed ATR SL is also given when fixed ATR is enabled. There will be a failsafe SL default set to 1% if price moves counter direction of opened position, it will close trade no matter what happens.
Enjoy :)

Morning Scalp StrategyThe Morning Scalp Strategy combines the 50EMA with the Stochastic Momentum Index. The morning period is when penny stocks usually have the highest volatility, so the strategy works between 10:00 AM and 12:10 PM.
***It opens only long positions. The ideal timeframe for this scalping strategy is 5 minutes on low-price stocks. The stock should spike in the morning with momentum and Volume.
***Look for a daily or intraday support area, close to the open position, to increase the confidence in the play
The components are:
- EMA50: Exponential Moving Average (EMA50)
- Stochastic Momentum Index (SMI)
Rules:
- Period: 10:00 AM and 12:10 PM
- if SMI Crossover and SMI < 0, open a position
- If close < EMA50, close the position
- Profit target: To be decided by the user, default value = 10% above the entry price
If you have any questions, let me know!

MACD ScalpsMACD Scalping
50 EMA crosses below 200 EMA = Only shorts
50 EMA crosses above 200 EMA = Only longs
For longs: -> Enter on red MACD bar
For shorts: -> Enter on green MACD bar
Bars not big enough or that do not follow the EMA rule are greyed out.
Crypto Scalper Divergence Macd Psar Ema 200This is a very efficient crypto scalper adapted to very short timeframes, however it can be optimized for other timeframes and assests as well.
Its components are
MACD
P SAR
EMA 200
Risk management
Rules for entry:
For short : we have an uptrend on PSAR , histogram is positive (divergence MACD) and close of a candle is below EMA 200
For long : we dont have an uptrend on PSAR, histogram is negative(divergence MACD) and close of a candle is above EMA 200
Rules for exit:
We exit when we either find a reverse condition than the entry one, or based on stop loss/take profit that are calculated on % movements of the price.
If you have any questions, let me know !

Swing/Scalper HULL + T3 avg Crypto StrategyThis is a both a swing and a scalper strategy(depends on the timeframe that you use), that works with all timeframes, however I noticed that with swing 3h works the best on most crypto pairs, such as ETH, BTC and so on.
Its main components are:
Hull moving average
T3 moving average
Risk management
With them I make an average and use it as the main moving average.
Rules for entry
For long: Average moving average is bigger than previous average moving average value.
For short:Average moving average is lower than previous average moving average value.
Rules for exit
We exit when either the TP/SL has been hit, or when we get a different condition than previous one(both for long and short).
If you have any questions, let me know !

Options Scalping V2This Indicator is Owned by Team Option Scalping.
It has 4 Plots and 2 Tables.
This indicator to be used only in BankNifty Futures
VWAP ( Volume weighted average price )
• User can input the source and enable/disable the VWAP from input section.
• When price is more than the VWAP its Bullish Trend and vice versa.
VWMA ( Volume weighted moving average )
• Default value of 20 is used in VWMA . User can enable/disable it from input section.
• When price is more than the VWMA its Bullish Trend and vice versa.
Parabolic SAR
• User can input “start”, “increment” and “maximum” values from input section and can enable/disable SAR also.
• When price is more than the Parabolic SAR its Bullish Trend and vice versa.
SuperTrend
• User can input ATR Period and ATR Multiplier values from input section. By defaults it’s 10 and 2.
• User have option of enable/disable “Change ATR calculation Method”, if enabled then ATR is calculated differently for SuperTrend.
• Enable/disable “BUY/SELL signals” on SuperTrend.
• When price is more than the SuperTrend its Bullish Trend and vice versa.
Top Right Corner TABLE ( 6 , 10 )
When you are trading in Banknifty futures , we have to check major Banks which is contributing to Banknifty move. So we have given that in this tab.
This table consist data of 9 following stocks:
• BankNifty
• Nifty
• Dow
• INDIA
• VIX
• HDFC
• ICICI
• KOTAK
• AXIS
• SBI
And following data of each stock has been provided:
• LTP
• Daily Change
• Daily Percentage Change
• 15-minute Change Percentage
• 1-Hour Change Percentage
Bottom Right Corner TABLE (3, 6 )
This table consist of 4 indicators values and Up/Down indicator:
• VWMA (When price is more than the VWMA its Bullish and vice versa)
• SuperTrend (10.2, When price is more than the SuperTrend its Bullish and vice versa.)
• RSI (14)
• VWAP (When price is more than the VWAP its Bullish and vice versa.)

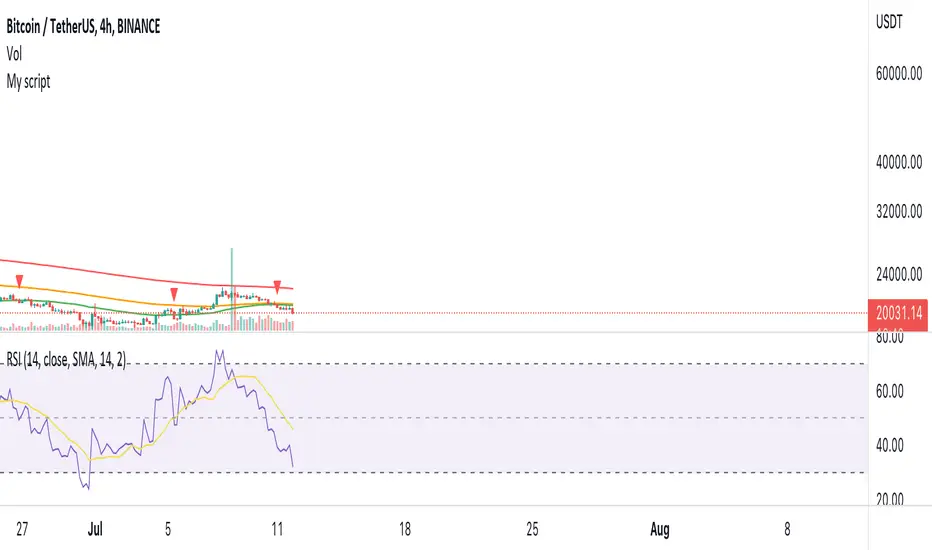
Moving Average ScalperThe main goal of a scalping strategy is to open and close trades frequently, profiting from small gains and limiting the downside risk.
This strategy, on average, manages to close trades within one day, meaning that you are not exposed to the risk of holding that coin for long. In this way, market conditions affect much less the overall performance of the trading system.
The setup of this strategy uses four moving averages combined with an unconventional approach. On one side, the strategy aims to catch assets trading in a downtrend but on the verge of a possible reversal. Then, the goal of the trading strategy is not to ride the eventual uptrend but to close the trade with minimal profit so that it can scan the market for a new opportunity again.
ENTRY
The buy order is placed on assets that most likely are about to have at least a short-term "relief rally." To capture this setup, the strategy buys when
the MA9 crosses above the MA50
the MA50 is lower than the MA100
the MA100 is lower than the MA200
EXIT
The trading system closes the trade when the MA9 crosses above the MA200, which could be the first major resistance the asset faces before developing a more sustained uptrend.
As a reminder, the goal of the strategy is not to catch the whole upside of the asset but has a more conservative approach. This allows keeping the risk of the strategy low.
Pro tip: The 15-min time frame has proven to return the best results on average. The strategy can work well also in the 5-min time frame.
The strategy assumes each order to trade 30% of the available capital and opens a trade at a time. A trading fee of 0.1% is taken into account.
Hourly Scalp Engine◆ Purpose of this Script
The Hourly Scalp Engine (HSE) is designed to show scalp long opportunities on lower timeframes (H, 2H or 4H) based on a Fibonacci-valued MA-like structure. It was tested for Bitcoin and Ethereum, with the 2H timeframe seemingly giving the best test results. The chart shows a few instances where the price crossed below the HSE to trigger an entry (marked manually with arrows).
◆ Settings
Default scaling input (10.6) is tuned for Ethereum (ETH/USD) on Kraken.
Scaling input for Bitcoin (XBT/USD) on Kraken: 10.4.
Reasonable timeframes: H, 2H, 4H. Recommended timeframe: 2H.
You should probably set an alert for when Price crosses under the HSE.
◆ Instructions
As this is purely a scalp engine (and not feasible for long-term trades), the instructions have to be followed precisely for intended functionality:
As soon as Price crosses below the HSE, contemplate if you want to scalp, i.e. check current price, other indicators and market conditions. If yes, enter a scalp long. Do not enter the trade if : price has crossed above the HSE already and sits more than 1 % above it, or the down-wick was so deep and quick that it already retraced 10 % to the upside from the wick low (even if price is still below the HSE). In both cases it might be too late to enter.
Watch the 2H candle, at which you entered the trade, closing. Draw a 10 % price range from the wick low to the upside. The range high is your exit point. Set a take profit trigger there. Set a stop loss slightly below the wick low.
Observe the price action for the next 6 hours (i.e. the next three 2H candle closes). If price bounces up and hits the target, you exit with 10 % gains. If price hasn't moved to the target after 6 hours, close the trade at current price. If the stop loss should be hit in the meantime, you will have closed the trade automatically. The 10 % gain as a target was chosen because it seems to be hit very often, while higher targets are not reliably hit.
◆ Example Trade
Shown below is an example trade with correct drawing of the 10 % price range.
◆ Viability
From backtesting this should be a viable strategy for most instances where the HSE is crossed. However the HSE is not as hard as a boundary as e.g. the Confidence Bands (also published by DeanTrader), so that price can and will sometimes breach through (= close below) the HSE (as e.g. in the case of the March 2020 black swan event). Still even there a profitable trade could have been performed on the first bounce dependent on actual entry, although more risky due to very high volatility. Before using the HSE please make yourself familiar with the price action history of the considered asset and review the instances where the price crossed below the HSE in connection with the rules laid out in "Instructions" to understand the system and how to execute the trades. Also note that scalp trades are generally harder to perform than slower-paced swing trades, as timing becomes much more important and noise becomes relevant.
◆ Access
For access to this indicator please contact me via DM on TradingView or on Twitter (linked on my TradingView profile and in my signature).

Pagoda of scalping, excessivetradingThis is a system I developed initially for scalping. Please be careful because trading only by this system blindly can cause total losses!
This system uses a risky technique by taking profits very fast.
It is build around moving averages and japanese candlesticks close prices cross the moving averages. The stop loss in this example is the reversal of the moving average crossing the prices.
You can feel free to play with parameters and let me know what other good stuff you did find out!
Peace!

Amazing scalper for majors with risk managementHello,
Today I am glad to bring you an amazing simple and efficient scalper strategy.
Best suited for 1M time frame and majors currency pairs.
Its made of :
Ema (exponential moving average) , long period 25
Ema(exponential moving average) Predictive, long period 50,
Ema(exponential moving average) Predictive, long period 100
Risk management , risking % of equity per trade using stop loss and take profits levels.
Long Entry:
When the Ema 25 cross up through the 50 Ema and 100 EMA. and we are in london or new york session( very important the session, imagine if we have only american or european currencies, its best to test it)
Short Entry:
When the Ema 25 cross down through the 50 Ema and 100 EMA, and we are in london or new york session( very important the session, imagine if we have only american or european currencies, its best to test it)
Exit:
TargetPrice: 5-10 pips
Stop loss: 9-12 pips
Hope you enjoy it :)

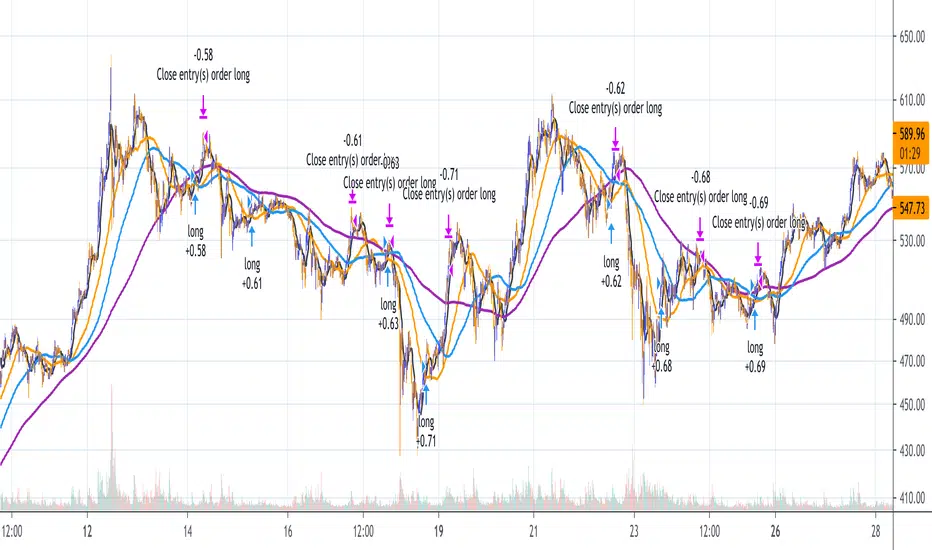
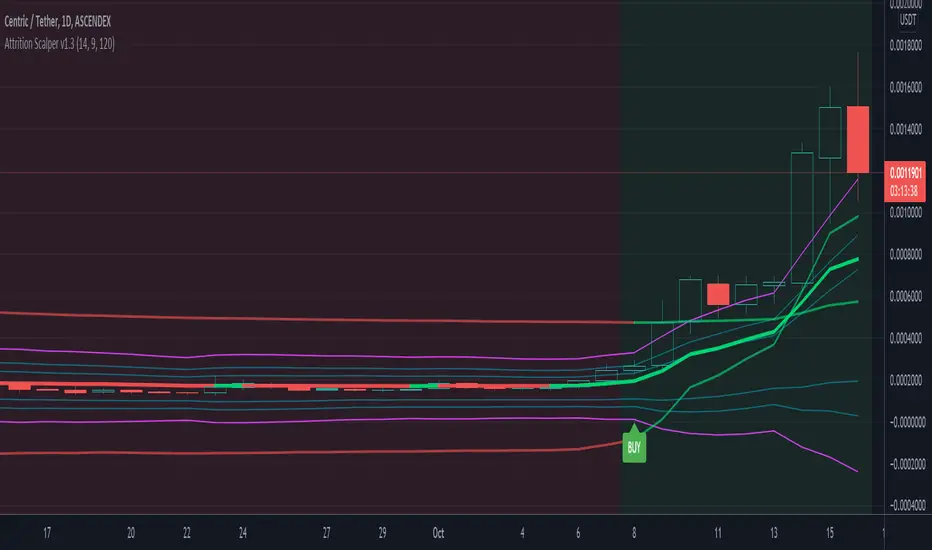
Attrition Scalper v1.0A weird indicator to catch tops/bottoms and scalp with the signals. You should buy/sell with the signals but you should also analyze the chart manually before jumping straight into the trade. One of the most important thing is the middle VIDYA line. It is a very strong support/resistance and if you've taken a long/short from top/bottom, you might want to target there to exit as the indicator will not give you a sell signal there probably.
You should also after trying the indicator for a bit. Make a proper SL/TP strategy for it.
By default the indicator will only load with charts up to 30 minute frame. If you want to load on higher timeframe charts you have to increase the Timeframe to Lookback and the Timeframe options in it's settings.
I really recommend lower timeframes though, the default settings with 5 minute chart is most likely the best.
Each of the lines you see are pretty strong support/resistance and pivot points . So if you've taken an entry for a quick scalp you should most likely start partially closing the position on each line.
I wouldn't really recommend a tight stop as we're most likely entering at or near the bottom and the price really can't stay that overextended unless it's a major/flash dump, at that point no indicator is safe anyways. So finding the sweet spot is up to you.
If more lines are on top of each other, be careful of that spot too as it's a great confluence of support/resistance . For example if the top VIDYA line is near the upper purple 4.236 line. That is a major resistance and if price is above it, it will almost certainly test it back or fall back inside the channel.
Another strategy is to not use the buy/sell signals but use the channel/lines yourself on higher timeframe for swing trading or just putting orders at the other extreme ends/lines in the channel to catch a nice entry in flash/major dumps/pumps.
Price will most likely retrace to the middle VIDYA line after touching or overextending from the top VIDYA and upper purple 4.236 line. Same also applies for the opposite side too. Any close above/below the VIDYA might mean continuation but that's better seen and confirmed on much higher timeframes, not 5 minutes probably.
Special thanks to: www.tradingview.com i got inspired from some of his indicators and even used some snippets of code which he allowed me to do.
In the near future i'm thinking of implementing new logic with Weis Waves and few other indicators to increase the signal count as i think it's currently very low. But overtrading might be bad anyways.
Megalodon Pro Bollinger Scalper SetUpIt is designed to find scalping opportunities. It combines Megalodon Pro Bollinger Band Calculator and another momentum tool to enter and exit positions.
Usage
Follow the green and red color changes to buy and sell, respectively. You may also set your alarms and start automate your trading via alarms.
Settings
Setting 1 defines buy below level for Bollinger Band Calculator.
Setting 2 defines sell above level for Bollinger Band Calculator.
Enlightening the modern investors
~Bo Bugra Sukas
Use the links below at the signature part to get access to these indicators.

Megalodon Pro ScalperIt is designed to find scalping opportunities. It combines Megalodon Pro Shorter Term Trader and another momentum tool to enter and exit positions.
Usage
Follow the green and red color changes to buy and sell, respectively. You may also set your alarms and start automate your trading via alarms.
Settings
Setting 1 defines the trend. Possible options are up, down, sideways. Default: "Sideways"
Setting 2 defines how many bars to wait for looking for a momentum buy or sell signal after a buying opportunity has been found in Megalodon Pro Shorter Term Trader to enter or exit. Default: 16 bars to look after
Setting 3 defines time frame to look for a buy and sell signal. This setting is used for setting up alarms. Default: 15 bars
Enlightening the modern investors
~Bo Bugra Sukas
Use the links below at the signature part to get access to these indicators.

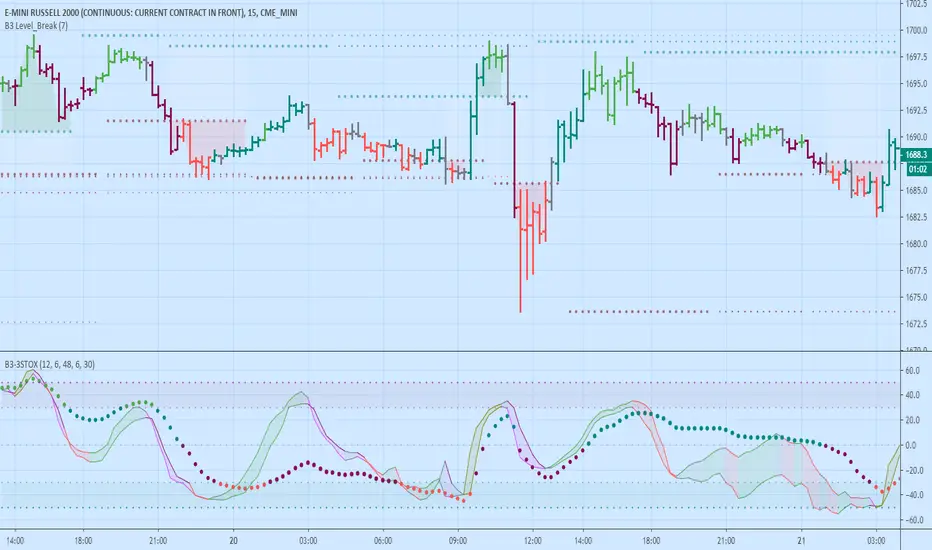
B3 3-Stox - Scalping OscillatorThis is an indicator that combines what I see some scalpers use on youtube videos and webinars.
3 Stox = Three Stochastic Readings
Fast Stochastic of Highs
Fast Stochastic of Lows
Slow Stochastic of Bar Average
Bar Color Code
Bar Color Coded
Light Green = Long with trend
Dark Green = Long counter trend
Light Red = Short with trend
Dark Red = Short counter trend
Fast Line Color Code
Green = Lows leading highs up (Organized Rise)
Olive = Highs leading lows up (Rapid Rise)
Red = Highs leading lows down (Organized Fall)
Fuchsia = Lows leading lows down (Rapid Fall)
Trades to be looked at:
Trading in the direction of the fast lines, when they are similar to and near one another, in the same direction as the Slow stochastic line's color or slope
Trading Long Fastline green color when all 3 lines are oversold
Trading Short Fastline red color when all 3 lines are overbought
AVOID Trading when fast lines are spread out and a large cloud appears between them (Chop Filter)
Look for solid up & down & up & etc. oscillation or you can use the slow line to find trends to trade
Green and red fast lines are organized moves, the olive and purple lines are faster moves and harder to lock in sometimes
Things to note:
Pairs nicely with a level printing study like B3 Level Break (applied on above chart)
There are 2 color schemes for the Fast High and Low Stochastic lines, and 2 color schemes for the bars
In this script the bar average is defined as (open+high+low+close+close ) / 5, keep the slow line at a large length input so that you can get a macro trend reading without zooming out the chart
The Extended Stochastics from one of my previous scripts is defaulted as the style used, however, you may turn that feature off and use the classic Stochastics
More details: drive.google.com
Enjoy!
~ B3 d^.^b
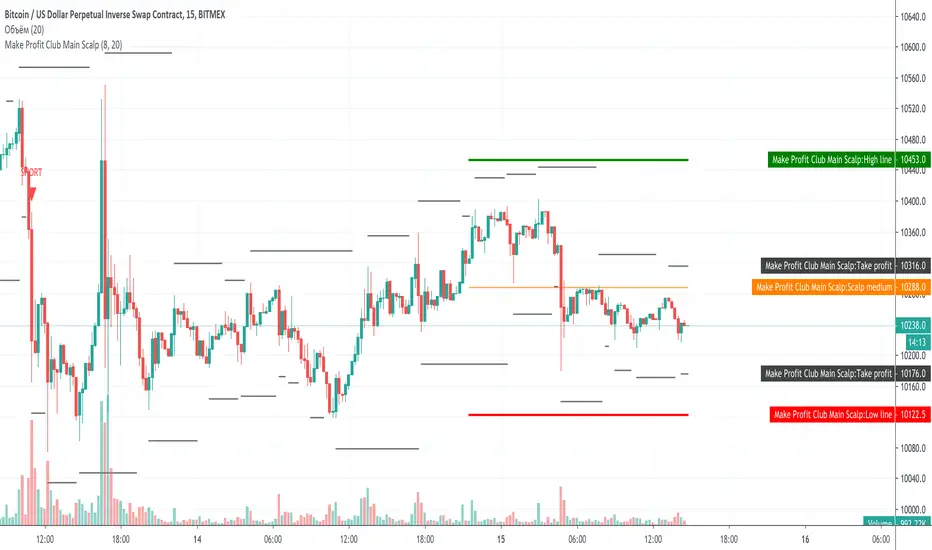
Make Profit Club Main ScalpThe main scalping indicator.
We use this indicator to trade for a short time in a TF of 5-15 minutes.
We have created takeprofit zones for you so that you can understand where we can get to and take your profit. these points are mostly very helpful.
There are basic settings that allow you to adjust the indicator individually for each situation; because of this, this indicator can be used for any exchange and any currency pair.
For Scalp trading, we use 3 different strategies available to our clients. If you enter them correctly, you can never see the minus sign.
Use the link below to obtain access to this indicator.
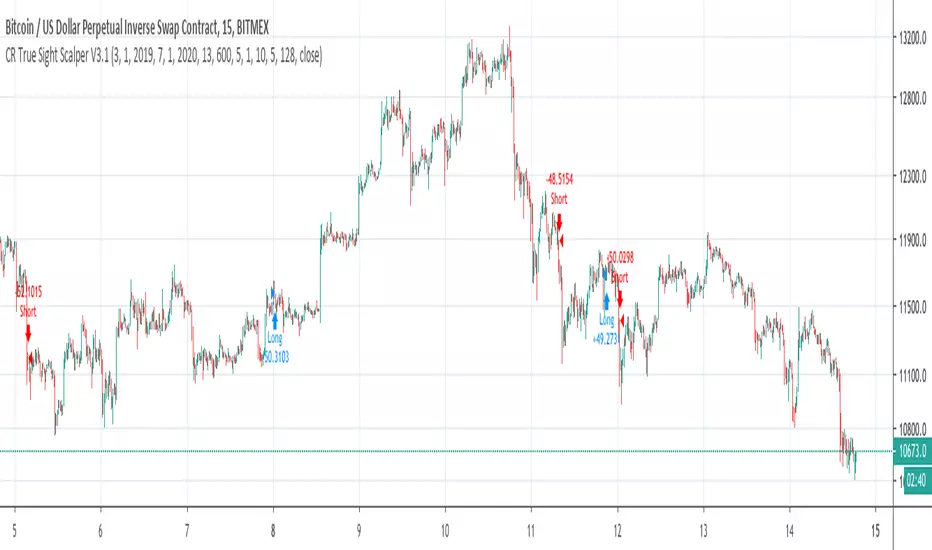
CR True Sight Scalper V3.1True Sight Scalper V3.1 is an incompatible update to V3.0, with much smaller losses.
$100,000 Initial capital.
From 2019-04-04 to 2019-07-14