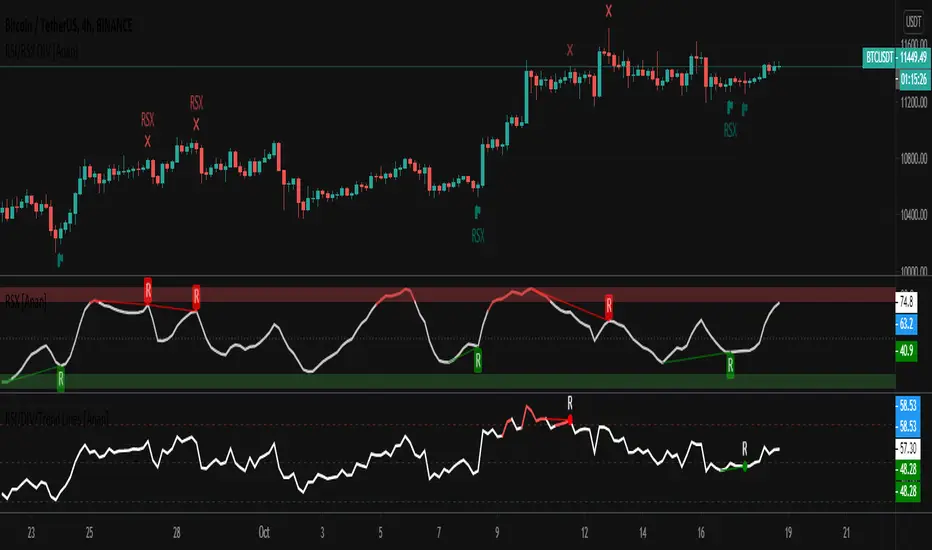
RSI/RSX Divergance on chart [Anan]This script points Regular/Hidden Bull/Bear RSI/RSX divergences on the chart.
Options:
-RSI/RSX source
-RSI/RSX length
-Show/hide Regular/hidden Bull/Bear divergences
스크립트에서 "rsi"에 대해 찾기
Multi-RSI Trend IndicatorRSI 14 crosses up over RSI 250 when RSI 250 > 50 indicates a strong and high probability uptrend or reversal. Can be further confirmed by MACD Golden Cross.

RSI and market strength with alerts By combining the true strength of the Nasdaq (NDX) and S&P500 ( SPY ) we can then compare that against the volatility /fear index ( VIX ). The true strength of the Volatility Index ( VIX ) is shown by the red area and the Nasdaq (NDX) and S&P500 ( SPY ) by the silver /teal areas.
The yellow EMA area shows the average difference between the VIX and the NDX/ SPY indexes. When the yellow area crosses above the zero line and is climbing it means that the NDX/ SPY are strengthening. When the yellow area is decreasing or crosses under the zero line it means the fear/volatility index ( VIX ) is becoming stronger and NDX/ SPY are weakening. The RSI is overlaid as a white line to show the correlation of the instrument strength compared to the market.
When looking at charts of companies/components listed on the Nasdaq and/or S&P 500 you will notice a frequent correlation between the movement of the yellow area depicting index health and the RSI of the chart you are viewing. It’s a very quick and effective method of seeing the strength and fear within the market indexes and how they are effecting your chart.
The background color changes when the market strength combined with the active symbol RSI and higher timeframe MACD signals are aligned. Green is a buy zone, Red is a sell zone.
There are also red and green indicator x’s at the top/bottom of the indicator. They show a drastic change in Relative strength within a short period. This often indicates a buy or sell opportunity.
It is tested and works well on all timeframes with Stocks listed on NASDAQ & S&P500 .
Buy, Sell, Exit Buy and Exit Sell alerts are included.
There are also red and green indicator x’s at the top/bottom of the indicator. They show a drastic change in Relative strength within a short period. This often indicates a buy or sell opportunity.

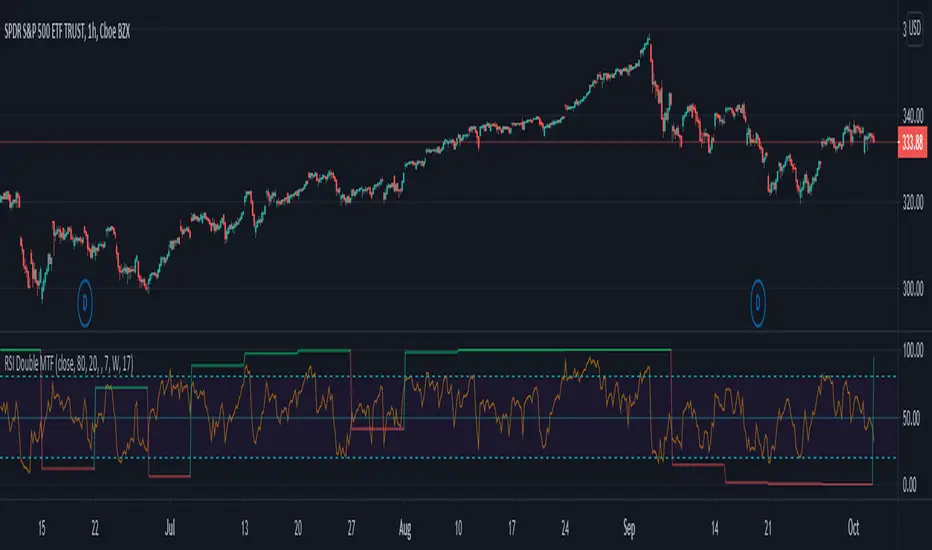
RSI Double MTFCool little gudget of Multi time frame RSI with additional RSI. Both can be set to a different time frames.
Higher time frame (Second RSI) indicates the main trend by different colors - 'red' (down trend) and 'green' (up trend), where the first RSI can act as a normal RSI.
Suggestions/Questions or a thanks below :)
Follow for more updates and new indicators follow: www.tradingview.com
RSI week/month level on daily Time frame- You can analyse the trend strength on daily time frame by looking of weekly and monthly is greater than 60.
- Divergence code is taken from tradingview's Divergence Indicator code.
#Strategy 1 : BUY ON DIPS
- This will help in identifying bullish zone of the price when RSI on DAILY, WEEKLY and Monthly is >60
-Take a trade when monthly and weekly rsi is >60 but daily RSI is less thaN 40.

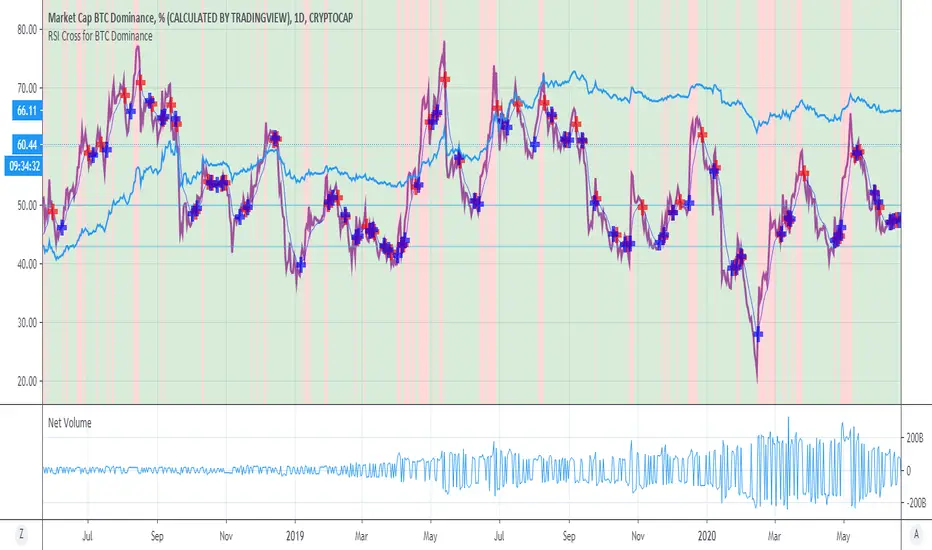
RSI Cross for BTC DominanceIn order to get stable alt-coin investments, the BTC dominance (BTC.D) is of parmaount importance.
With this script, I plotted both RSI (28) and the EMA (9).
Whenever the RSI is decreasing and is below EMA, alt-coins are more likely thrive.
Viceversa, when the RSI is mounting the is at least 10% above the EMA, BTC is growing in dominance.
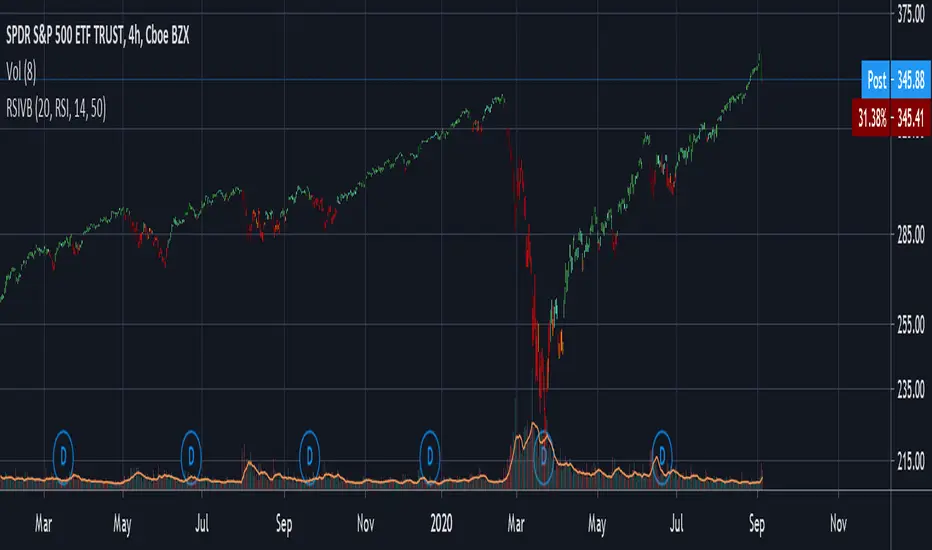
RSI + MFI - Crypto Bull and Bear market A fancy styled version of the RSI (Relative Stochastic Index) + MFI (Money Flow Index) oscillators in order to emphasize buy and sell opportunities.
The 80 and 20 Bands are meant to be used in Bull or Bear markets. Better performing in D timeframes.
The circles represent the cross between RSI and MFI .
Designed for Crypto Markets
Thanks @micheleprandina
Credits:

RSI-ChartBarsFibo75-25This chart will help you plot on following condition
Source:
1. RSI Subtraction between two series
2. Historic Volatility (HV)
The conditions are:
1. RSI sub should cross over 0 (any direction)
2. EV should be high for last 5 values
3. If RSI Sub is above 0 - the direction of trade is Long (flag Green), if its below 0 - the direction of trade is short (flag red)

RSI & Volume Coloured BarsCandles get darker when volume is high, and brighter when volume is low. They are red or green depending on whether the RSI is above or below a threshold value, or alternatively you can pick a more vanilla coloring based on current close vs last close or last open.
For personal use as I enjoy the aesthetics of it. The more solid RSI coloring helps highlight the brightness variations from changing volume and makes trends crystal clear.
Inspired by "Volume Based Coloured Bars" by KivancOzbilgic:
and by and by RSI bars chart by taskman9:
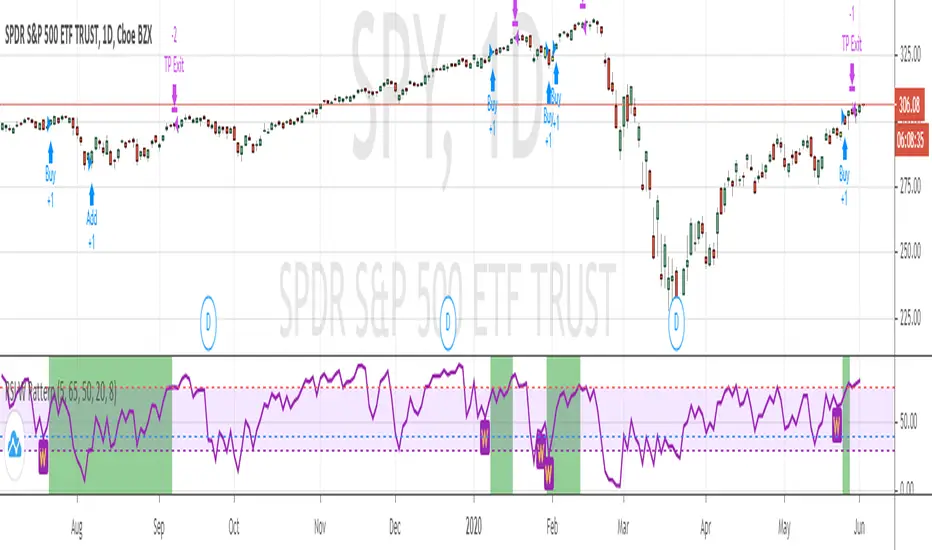
RSI W Pattern strategyThis strategy is similar to RSI V pattern strategy, but it looks for W pattern in RSI chart.
RULES
======
BUY
1. ema20 is above ema50
2. RSI5 crossing up 30 from oversold area
3. and RSI5 must be below overbought area (default value set to 65)
Add to existing Position
1. You can add on the next W pattern OR
2. if RSI5 is crossing up from below 20
Exit
1. when RSI5 reaches 75
Note: This is for short term/swing trading . which gets on when price dip in trending and quickly gets you out on RSI overbought area
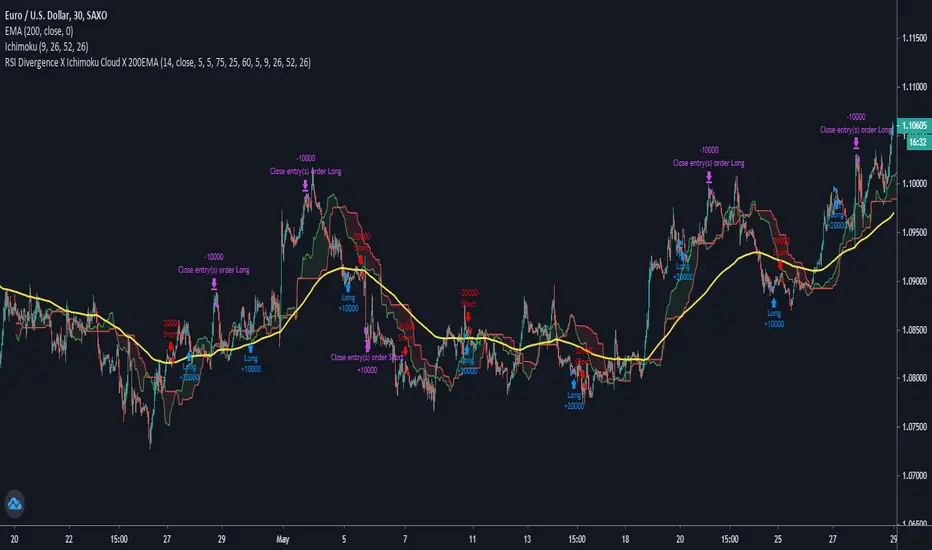
RSI Divergence X Ichimoku Cloud X 200EMAHi all,
This script is a combination of the RSI Divergence Strategy combined with Ichimoku Cloud and 200 EMA .
A long position is entered only when the RSI identifies a bullish divergence (either regular or hidden), and that the Ichimoku Cloud is above the 200 EMA . This is to ensure that there is a confirmation of a bullish trend before an entry.
Similarly, a short position is entered only when the RSI identified a bearish divergence (either regular or hidden), and that the Ichimoku Cloud is below the 200 EMA . This is to ensure that there is a confirmation of a bearish trend before an entry.
I find that this script works best on Intraday charts.
This is just a simple script I built on my third attempt of backtesting strategies on TradingView. Do give it a go and let me know if you guys have any feedback or comments about it. Happy trading!
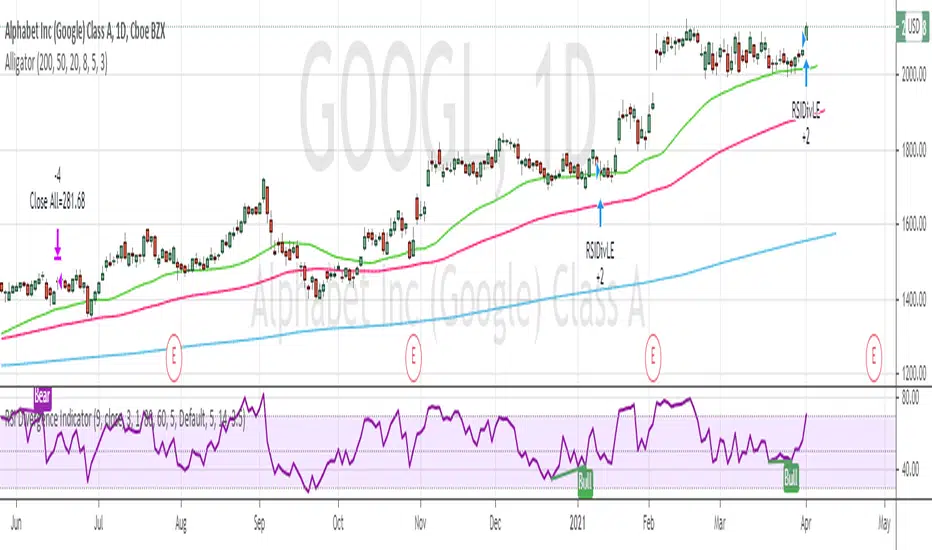
RSI Divergence Indicator strategyThis strategy is based on RSI divergence indicator.
RSI period setting 5
Go Long when Bull or Hidden Bull is shown
Exit when RSI goes above 75 OR when bear condition appears
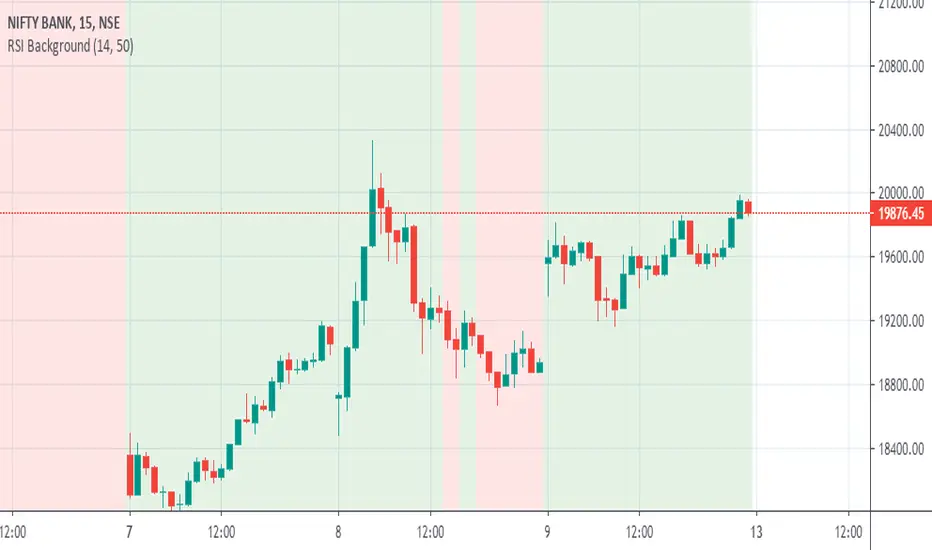
RSI 50 BackgroundThe script changes the background depending on the RSI 14 values. If RSI 14 values is above 50 the background is green and if RSI value is below 50, the background will be red.
Rsi, Ema , Ma and Bollinger Bands for 1 min BtcusdtThis is for 1 min Btcusdt pair.
I am tring to find a way to catch %1 ups and downs.
Basicly it buys when rsi low and minute candle closes under ema,ma and lower bollinger band,
it sells when candle goes over upper bb,low ma, when rsi high.
It sells when rsi high ,candle closes over upper bb,over low ma and does the opposite when buying.
I know it's crowded but still tring to learn what to do ^^
I welcome any suggestions to improve.
It works better with shorts for now.
Don't buy with this !! You might lose big !

RSI Divergence (Pine v4)Summary
Script highlights the divergences in RSI worth taking notice of. By comparing current envionment to relative sample we can see more than
the standard divergences that many catch through analysis. This framework aims to remove the bias or noise many see when looking for any supporting
evidence to their given emotion on a market.
Step-by-Step Walkthrough
Calculates RSI
Sets Divergence Framework
-------> a. Defining variable values, mandatory in Pine 4)
-------> b. Identify Divergences --> "If bar with lowest / highest is current bar, use it's value"
Compare high of current bar being examined with previous bar's high --> "If curr bar high is higher than the max bar high in the lookback window range"
Finds pivot point with at least 2 right candles with lower value
Finds pivot point with at least 2 right candles with lower value
Plot
Set Alerts
This RSI Script is intended for public use and can be shared / implemented as needed
Questions? I do not monitor my TradingView inbox. See email address in signature at the bottom of this page for contact information.

RSI-VWAPBacktest script based on the previous RSI-VWAP indicator:
It's the popular RSI indicator with VWAP as a source instead of close:
- RSI_VWAP = rsi(vwap(close), RSI_VWAP_length)
What is the Volume Weighted Average Price ( VWAP )?
VWAP is calculated by adding up the dollars traded for every transaction (price multiplied by the number of shares traded) and then dividing by the total shares traded.
Trades are laddered to improve the average entry price and each entry is increased, improving the entry but increasing the risk of being liquidated.
It can be easily converted to study (alerts)
Settings for BINANCE:BTCUSDT at 30m
