INVEST BTC RSI (from @tradinglord)RSI VERSION - no alerts
The script highlight point of interest for investors using EMA , RSI and a bit of criticism.
The script is built to be used on a weekly timeframe
When RSI is bellow 35 it can be interesting to invest in BTC , on the opposite when it is above 80 can be where to take a bit of profits.
Also using EMA to flow with the power of the trend or change your bias depending on conditions.
Feel free to use the included alerts to be informed when RSI is telling you something.
The idea is quite simple, and you will not gain x100 your investment, but with these kind of investments and some patience you could make your way out.
Obviously not financial advice, understand what you are doing.
"Sometimes it's better to be rational monkey than a greedy baboon" - Tradinglord 2022
스크립트에서 "rsi"에 대해 찾기

RSI DoubleJust another RSI indicator with a plus: shows the current symbol RSI in black plus another symbol RSI in blue.
This is useful for example if you are trading alt-coins and you want to see also the RSI of Bitcaoin as reference, or is you are trading forex and want to see another index...
See my other scripts in: es.tradingview.com

Panel RSI MACD DMI//RSI
//--Default length : 14
//--RSI > 70 : Background is RED
//--RSI < 30 : Background is GREEN
//--RSI Between 30 and 70 : Background is BLUE
//MACD
//--Default: 12,26,9
//--MACD cross above Zero Line / Signal Line : Background is GREEN
//--MACD cross below Zero Line / Signal Line : Background is RED
//--Others condition : Background is BLUE
//DMI
//--Default: 14, 14
//--ADX > 20 : Text is GREEN
//--ADX < 20 : Text is RED
//--DI+ > DI- : Background is BLUE
//--DI- > DI+ : Background is YELLOW
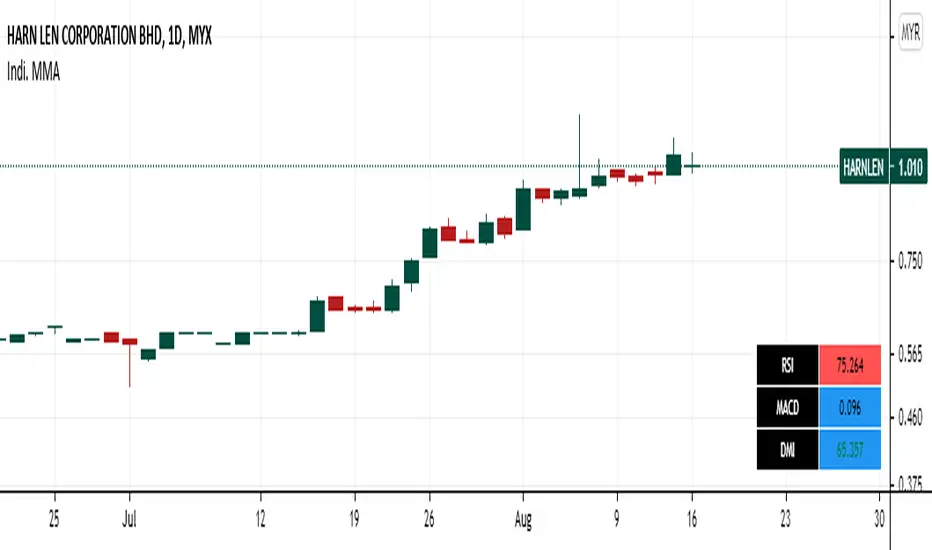
RSI TableIt prints the RSI values for all timeframes in tabular format.
Gives overall picture of RSI in all timeframes.
We can compare with RSI value of one stock to another ( like comparing its index performance vs stock performance in terms of RSI).
Note: This is designed to work with 5 min timeframe. When switching to higher timeframes then lower timeframe values would be incorrect. Kindly use it for 5 min timeframe or lower.

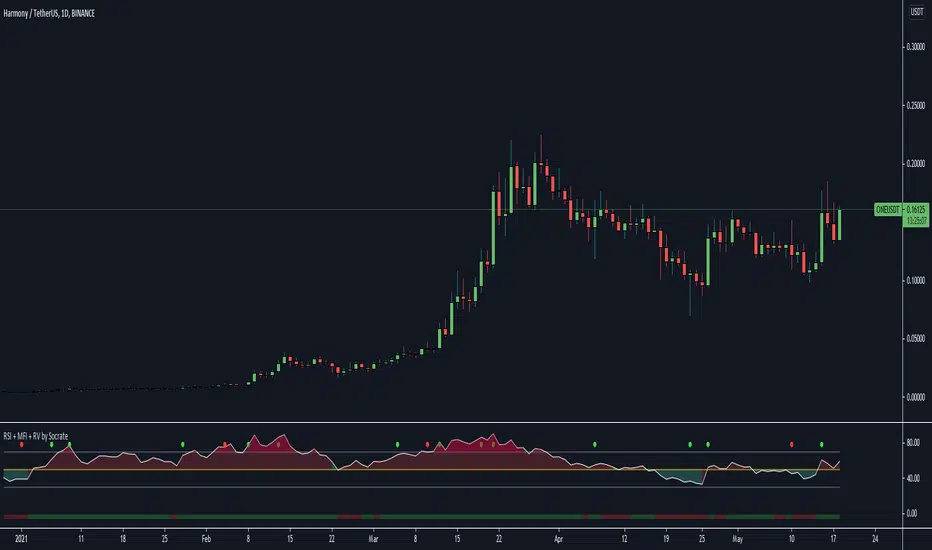
RSI , Money Flow Index, Anormal Relative Volume 3in1 indicator
RSI , Money Flow Index and Anormal Relative Volume indicator.
How the indicator works ? You have dot's on the top to show you the anormal relative volumes (you can adjust it with the treshold), you have a classical RSI cloud wich give you an quick opinion about the trend momemtum strengh, and the bar on bottom gives you a quick hint on the actual moneyflow stream.
Inputs that you can setup :
- Source
- RSI Lenght
- Neutral level
- Overbought value
- Oversold value
- MFI Lengh
- RV length
- RV Period
- RV Treshold
- RV smoothing value
- RV Breakout Based on
!!!!!!!!!!!!!!!!!!!!!!!!!!
Remember, an oversold RSI doesn't mean you should BUY an asset, it means the momentum is week on the bull side, the same but opposit for Overbought ;)
!!!!!!!!!!!!!!!!!!!!!!!!!
Relative anormal volumes are a good hint on something is happening on an asset, remember, dont put the treshold too low, i recommended min value on 1.25 for stocks, min value 1.5/1.8 for crypto-currencies.
!!!!!!!!!!!!!!!!!!!!!!!!!
Have fun !
RSI of MACD Strategy [Long only]This strategy uses the RSI on MACD indicator.
BUY
====
When RSI indicator crossing over 30 or 35 line and price above slow ema
Note: when the position already taken, you may reenter on the purple candle
Partial Exit
==========
Partial profit taking option is available in settings. If this is selected , 1/3 position exited when RSI indicator crossing down 80 line
Close
=====
When RSI indicator crossing below 15
Stop Loss
=========
I havent used hard stop loss in this strategy. Reason is , when price going down , indicator may go up ... so just wanted to ride along with indicator ...
Stop loss mentioned in the settings is used in calculation of how many units can be be purchased based on risk level
Tested with SPY and QQQ ETFs on hourly chart
Warning
=========
For the eductional purposes only ...
This is not a financial advise. please do your own research before taking any trading decission

RSI Support and Resistance Finder [JV] V1Hi Traders.
In my never ending obsession with Support and Resistance , I built an indicator to show the last Support and Resistance Lines based on RSI .
The indicator draws a new Support Line when RSI comes out of oversold and a new Resistance Line when RSI comes out of overbought.
It also shows a panel with the current Support and Resistance Levels.
It's a pretty decent indicator to detect Entry / Exit / Take Profit levels.
This indicator is not to be used as a stand-alone indicator. Add your favourite indicator to get confirmations.
RSI length and overbought / oversold levels can be adjusted in Settings.
Any suggestions or remarks are more than welcome!

RSI Tops and BottomsHello Traders
This script finds Tops when RSI is in overbought area or Bottoms when RSI is in oversold area and checks the divergence between them. it checks divergence at tops/bottoms after RSI exited from OB/OS areas.
You can change overbought / oversold levels.
You can limit the time that RSI is in OB/OS area with the option "Max Number of Bars in OB/OS"
you can set the minimum/maximum distances between Tops/Bottoms with the options "Min Number of Bars between Tops/Bottoms" and "Max Number of Bars between Topss/Bottoms"
and you can set the color and line widths as you wish.
These tops or bottom must be sequential, means there mustn't be another top while checking tops or bottom while checking bottoms between them.
in next example you can see valid and invalid bottoms:
After you got signal then you better use Stop Order, a few pips higher than the high of colored candle for long positions, ( vise versa in short positions ). so you may escape from traps. ("Stop order" is filled when the price reached a pre-specified price. for example the price is now 10.0 and you set Buy Stop Order at 11.0 then if price reaches 11.0 then your buy order get filled. you can put stoploss a few pips lower than the low of colored candle or you can use ATR to decice stoploss level. how you wish)
For example in following screenshot you can see that buy stop order was not filled and you didn't take long position.
Enjoy!

RSI with Self-Adjusting Linear Regression Bands (Expo)RSI with Self-Adjusting Linear Regression Bands (Expo) makes use of RSI and Linear Regression to create an RSI that follows the current trend. The indicator has an upper and lower self-adjusting Linear Regression Band that act as RSI boundaries.
HOW TO USE
The indicator can be used in multiple ways, for instance, to find overbought and oversold areas. Or to identify trends as well as pullbacks in trends.
INDICATOR IN ACTION
This indicator is a modification of RafaelZioni's work "Linear Regression Trend bands"
Credit to: RafaelZioni
I hope you find this indicator useful , and please comment or contact me if you like the script or have any questions/suggestions for future improvements. Thanks!
I will continually work on this indicator, so please share your experience and feedback as it will enable me to make even better improvements. Thanks to everyone that has already contacted me regarding my scripts. Your feedback is valuable for future developments!
-----------------
Disclaimer
Copyright by Zeiierman.
The information contained in my scripts/indicators/ideas does not constitute financial advice or a solicitation to buy or sell any securities of any type. I will not accept liability for any loss or damage, including without limitation any loss of profit, which may arise directly or indirectly from the use of or reliance on such information.
All investments involve risk, and the past performance of a security, industry, sector, market, financial product, trading strategy, or individual’s trading does not guarantee future results or returns. Investors are fully responsible for any investment decisions they make. Such decisions should be based solely on an evaluation of their financial circumstances, investment objectives, risk tolerance, and liquidity needs.
My scripts/indicators/ideas are only for educational purposes!

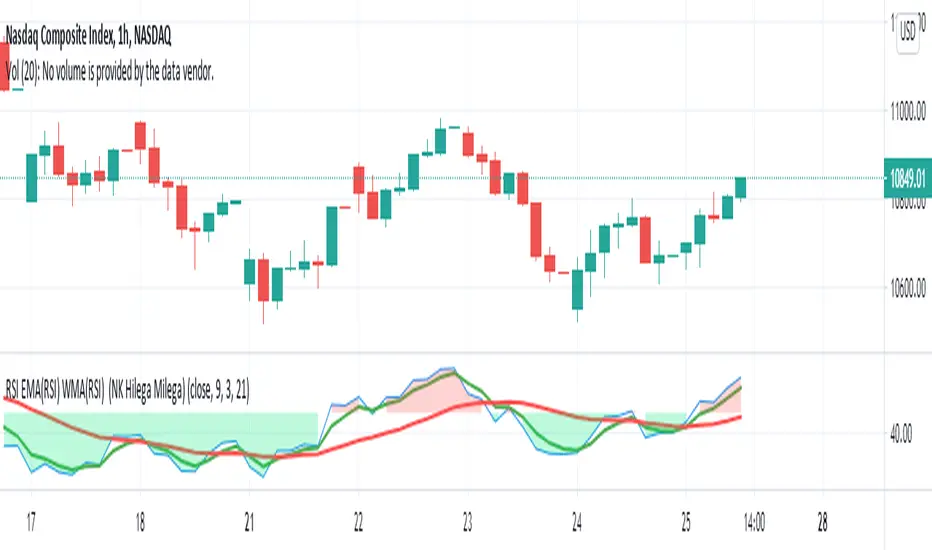
RSI EMA(RSI) WMA(RSI) (NK Hilega Milega)This indicator is works on RSI, Price and volume to give leading Indicator to Buy or Sell.
This indicator works on all financial markets
Hilega-Milega System.
For intraday trade, enter with 10 mins chart.
For positional trade, enter with 1-hour chart.
For Investment this system can be used with daily/weekly/monthly chart.
• RED line is for Volume.
• Green line is for the Price.
• Black line is for the RSI (9).
SELL Trade
1. When Volume (RED line) is above/crossed above Price (Green line) and Strength (Black line), then stock price will go down. This means we will SELL.
2. When there is a GAP in the RED line and the Green line till the time price will go down.
Exit criteria
Whenever Red line exit the shaded area of Oversold zone OR Red line cross over the Green and black line then we will exit.
In case of the SELL trade, after the entry we will monitor the trade in 5 min chart, if the candle is closed above the VWAP then exit.
If the price is crossed the 50 SMA then we will exit trade.
BUY Trade
1. When Volume (RED line) is below/crossed below Price (Green line) and Strength (Black line), then stock price will go up. This means we will BUY.
2. When there is a GAP in the RED line and the Green line till the time price will go down.
Exit criteria
Whenever Red line exit the shaded area of Overbought zone OR Red line cross over the Green and black line then we will exit.
In case of the Buy trade, after the entry we will monitor the trade candle is closed below the VWAP then exit.
If the price is crossed the 50 SMA then we will exit trade.
Rsi BotOk This is MTF RSI bot
it has two way to approach it . one is strict with no repaint at all , just click to remove the repaint in the menu .
its still make profit but sure not crazy unrealistic one:)
The other option is the "repaint version" which is under my special repaint control system (not perfect but since we can never truly control the repaint the signal may be not perfect ) , but in general it not so much repainting :)
to verify just use the bar control to see how it work.
the buy and sell depend on the rsi crossing oversold and overbought level that you can control in the menu
Also in the menu you see a factor . this has two function . since it based on % , when you buy you want to be buying in upswing
so let factor let say of 0.8 (is 0.8% above the entry ) this to make sure we buy in upswing and vice versa when we sell. this to correct many wrong entry of the rsi . the other function is important in the repainting model since it reduce the repainting by allot.
the min distance in menu is to control the difference between the two rsi (red color and the blue color= slow and fast)
for Forex i find factor of 0.1 % in the repaint model to work find
on Crypto best is between 0.5 to 1
there is option to check and see if stop loss and take profit improve your profit or not (i put both on very high level so it will not be a factor but you can change it as you wish
you can test to see if it better to go longs or shorts in this model or both direction
i put the setup of 50% eqiuty maybe it too much but it you choice if you test the model to reduce it to proper amount (best is 10-30%)
The repainting model is much more profti but does not matter what i do to correct it is sometime repaint. most of time it actual work fine so it your choice if you want to use it or not . just be sure on what you are doing if you put money on it
the non repaint model is much more safe nut much less profit. still it can make profit with proper setting can work very nice
so if you are not sure what you doing the use the more stable one and remove the repaint in the option
if you have any question just pm or write remarks

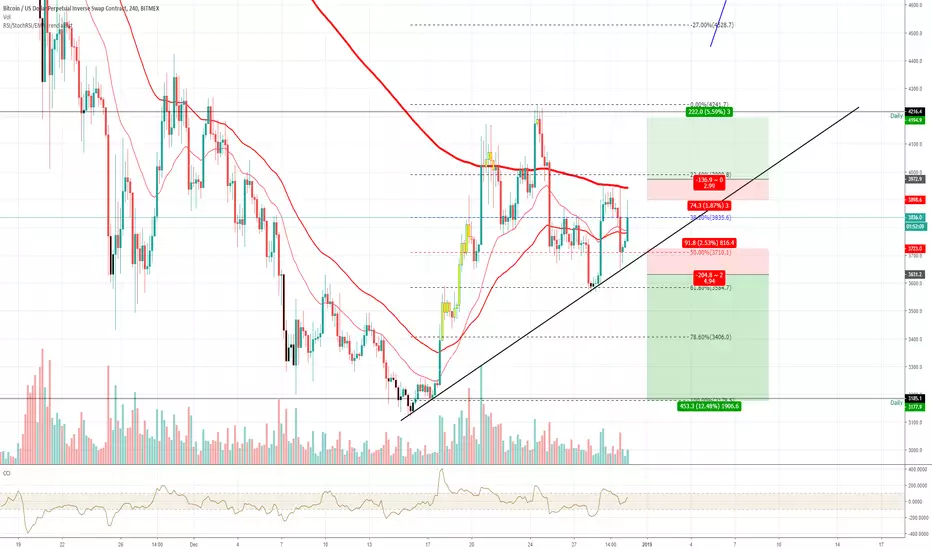
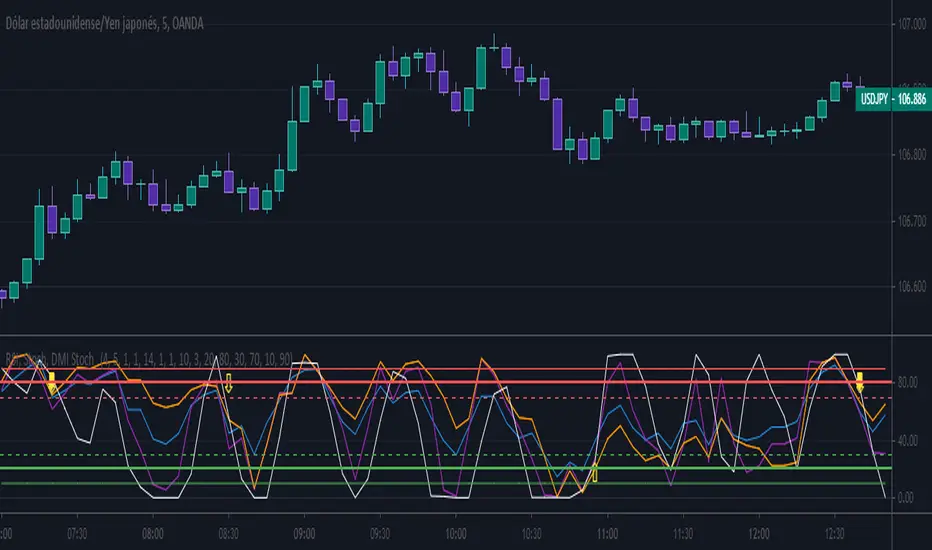
RSI, Stoch, DMI Stoch / By Mochero
With this indicator, we seek to find convergence of RSI, Stoch and DMI for purchases or sales.
Search Buy when,
-Rsi over sold
-Stoch over sold
-DMI Over sold
Search Sell when,
-Rsi oon purchased
-Stoch on purchased
-DMI on purchased
Suggested values
Rsi: 4
Stoch: 5.1.1
DMI: 10.3
Suggested time, 5M 15M
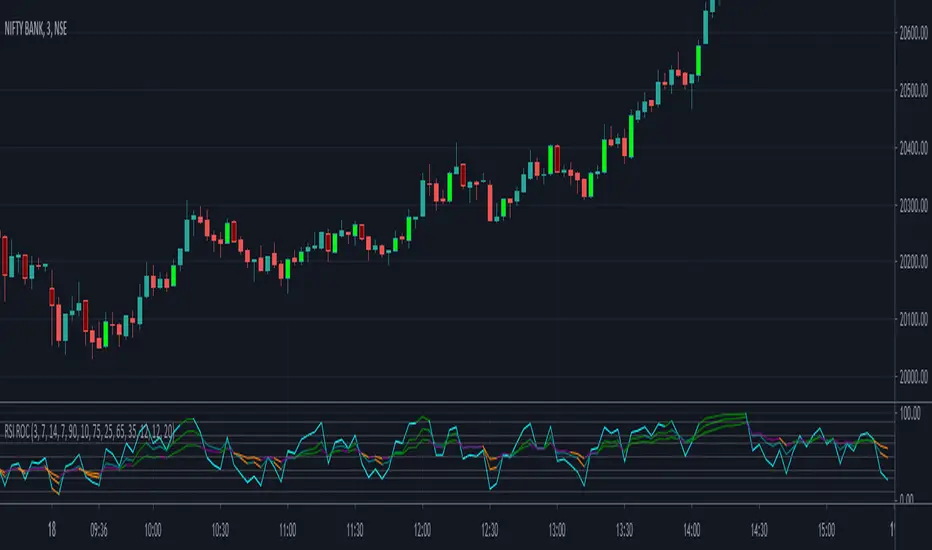
RSI - Rate of ChangeCode based on RSI lower value crossing over higher value
RSI Rate of Change of different lengths used in all parts of code
ADX and CCI use is limited in V1.0
Script provides 3 RSIs and overbrought and oversold for each of these RSIs. When RSI cross over each other clearly Buy and Sell signals are fired.
Lime is buy and Maroon means sell. Use it along with EMA
RSI (w/ Curve and Volatility)This is a centered triple oscillator which measures RSI, RVI (volatility), and Coppock Curve (trend). This is centered so it ranges from negative 50 to positive 50. This indicator is used most accurately when all 3 indicators show above/below 0.
RSI is the bright pink line. RSI determines strength in a direction. When it is above 20 or below -20, a pullback is likely - this could be a prime time to scale out of position. Remember do not enter a trade just because it is oversold, as the strength is still greatly against you.
RVI is the thin lighter line. RVI was created by Donald Dorsey to use in conjunction with other indicators. The instructions for using RVI is to sell/short when below -10 and buy/cover when above 10. Use this indicator to confirm your bias.
The purple area is the Coppock curve . This curve is used to analyze longer term trends in a chart. RSI and RVI struggle to indicate long term trends, use the Coppock curve to confirm your bias. The curve is bullish when above 0 and bearish when below 0. Be cautious when trying to buy or sell it early when its falling. If it is falling and pops back up without reaching 0, it is typically indicate of a big price movement in that direction.

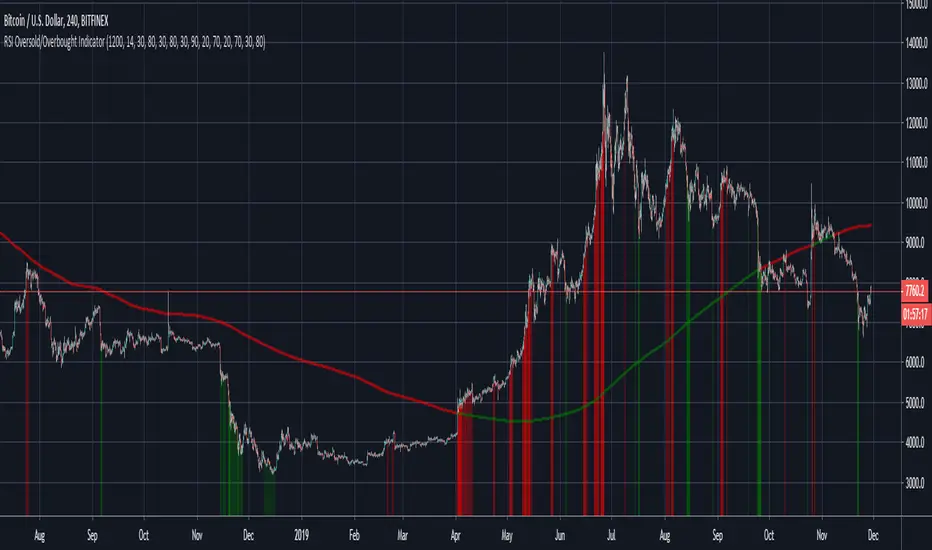
RSI Oversold/Overbought IndicatorThis is a very simple but quite powerful indicator which looks at the RSI simultaneously over the 4h, Daily and Weekly timeframes, and places bands on the chart when one or more timeframes move into oversold/overbought territory. For further filtering I use the 200 day SMA to determine if we are in a Bull or Bear market, which puts a bias on the RSI (30/80 in a Bull market and 20/70 in a Bear market).
The deeper the colour, the more oversold the market is. The weekly RSI can be used as an early warning sign, with the Daily/ 4h RSI useful to identify local peaks.
RSI X-Factorel índice de fuerza relativa (RSI) es un indicador que nos determina la fuerza que está teniendo la moneda en sí, va en un rango de 0 a 100, si el RSI esta mayor al rango 70 se lo considera sobrecomprado, es decir, exceso de compras, el precio de la moneda esta alto. En ese momento el indicador costumizado por X-factor indicadores nos marcará una barra roja que significa momento de vender. Caso contrario cuando el RSI esta por debajo de la zona del 30 significa que el precio esta sobrevendido, exceso de ventas, es decir, el precio de la moneda esta barato, por ende hay una gran probabilidad de que cambie de tendencia para alcista. El RSI nos va a mostrar una barra verde para decirnos que es momento de comprar

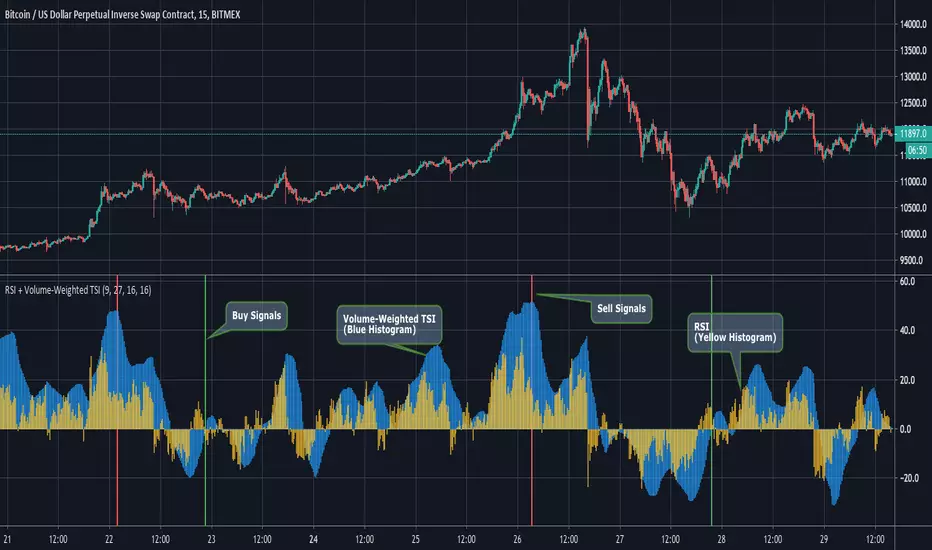
RSI + Volume-Weighted TSIThis indicator combines a standard RSI with a modified TSI.
Although a double smoothing process is already used in calculating the normal TSI, we decided to apply a volume weighted moving average of length (length_of_slow_TSI_EMA // 2) to it. This resulted in a smoother TSI that picked up on large-scale swings very nicely.
Entry Signals are generated when the Volume-Weighted TSI crosses above zero from negative into positive territory. Exit signals are generated when the TSI is above 40 and then begins its downward fall, along with a declining RSI value.
The Graph:
The Volume-Weighted TSI is plotted as the blue histogram, wile the RSI is plotted as the yellow histogram. We definitely wanted to go the simplicity route on this one's graphics, since the RSI and TSI are both classic and reliable indicators.
The green background highlights indicate an entry signal and red highlights signify an exit signal.
Input Options:
-length of Slow EMA for TSI
-length of Fast EMA for TSI
-Length of Volume Weighted MA of TSI.
-Length of RSI.
~Happy Trading~
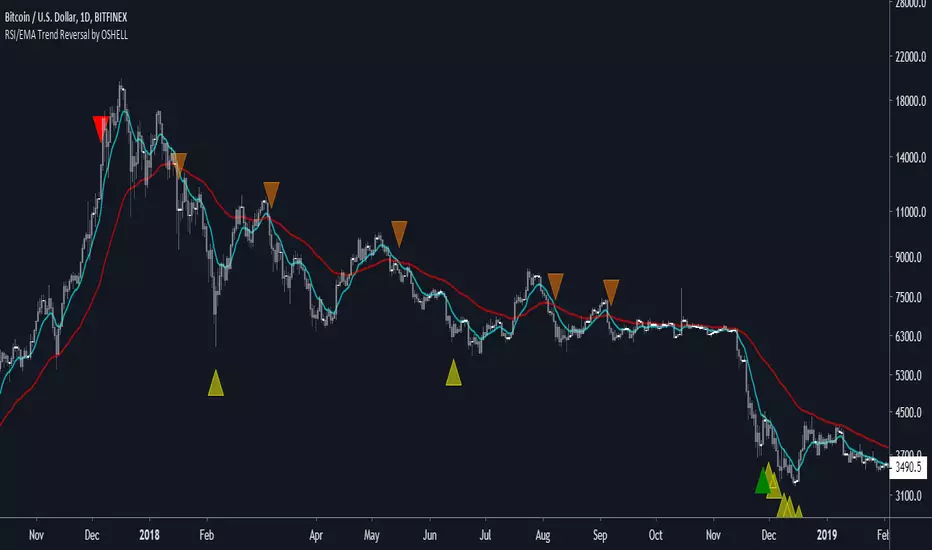
RSI/EMA Trend Reversal by OSHELLSELL SIGNALS
Red Arrow Down: RSI highly overbought
Yellow Arrow Down: RSI Overbought
Orange Arrow Down: 50EMA/10EMA Cross down
BUY SIGNALS
Green Arrow Up: RSI highly oversold
Yellow Arrow Up: RSI oversold
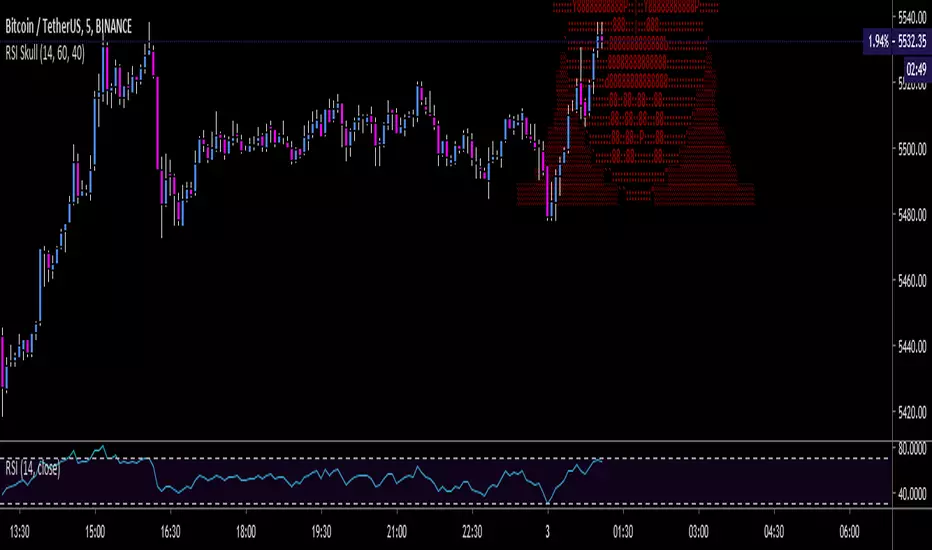
RSI Skull - Novelty Graphical Chart ArtGraphical RSI, just for fun.
RSI >= 60 = red
RSI < 60 and > 40 = blue
RSI <= 40 = green
Skull art by Alan De Smet
RSI VOL StochasticFor a friend's request, a way to switch from basic rsi , volume or stochastic .
Even if it's possible to display multiple indicators at the same time it's not really usefull, the main use here is to use one most of the time and if needed switch between them.
By the way, I'm using only RSI 95% of the time and don't need more indicator but sometimes we juste need to check quickly something on volume or stochastic , so this script can be usefull for those type of usecase without losing display capabilities.
Pour la demande d'un ami, un moyen de passer de rsi , volume ou stochastique de base.
Même s'il est possible d'afficher plusieurs indicateurs en même temps, ce n'est pas vraiment utile, l'utilisation principale ici est d'en utiliser un la plupart du temps et si nécessaire de basculer entre eux.
D'ailleurs, je n'utilise que du RSI 95% du temps et je n'ai pas besoin de plus d'indicateur mais parfois nous avons juste besoin de vérifier rapidement quelque chose sur le volume ou la stochastique, donc ce script peut être utile pour ces types d'utilisation sans perdre les capacités d'affichage.

RSI-ATR Divine StrategyLive, non-repainting strategy using ATR and RSI mixed together to take long and short positions. Includes:
Live entry direction with trade warnings and alerts
Live trade building buy and sell stops (for buy/sell stop limits)
Entry location icons as well as pyramid entries (to add to existing position)
3 separate targets based on the ATR setting and entry location
2 separate trailing stops, 1 for "absolute stop" and 1 for "take profit stop"
Alert conditions for every update and condition change of the strategy
4 pre-built color themes, including candlestick coloring
This strategy is best used with my RSI Shaded Indicator using the identical RSI settings.

RSI Based Automatic Supply and DemandA script that draws supply and demand zones based on the RSI indicator. For example if RSI is under 30 a supply zone is drawn on the chart and extended for as long as there isn't a new crossunder 30. Same goes for above 70. The threshold which by default is set to 30, which means 30 is added to 0 and subtracted from 100 to give us the classic 30/70 threshold on RSI, can be set in the indicator settings.
By only plotting the Demand Below Supply Above indicator you get automatic SD level that is updated every time RSI reaches either 30 or 70. If you plot the Resistance Zone / Support Zone you get an indicator that extends the zone instead of overwrite the earlier zone. Due to the zone being extended the chart can get a bit messy if there isn't a clear range going on.
There is also a "confirmation bars" setting where you can tell the script how many bars under over 30 / 70 you want before a zone is drawn.
Here is an image of only using the "Demand Below / Supply Above" plot.
As you can see, this could be useful "Price Flow" indicator, where we would only short if a zone appears below another zone, or long if two zones in a row are going up, like stairs.

RSI/StochRSI/EMA trend assist updated- Trend determined by the crossover of the 4hr 13 and 26 EMA's (or whatever you set the Short and Mid term EMA to) All settings customisable in the 'cog' wheel of the indicator in the top right of the screen.
- Oversold conditions ( Stoch RSI and RSI ) are shown with a black candle
- Black candle = Potential long WITH the trend
- Black candle and small green circle below = Potential long AGAINST the trend (used better as a warning to watch trade in case exit required.)
- Overbought Conditions ( Stoch RSI and RSI ) are shown with a yellow candle
- Yellow candle = Potential short WITH the trend
- Yellow candle with small red circle above = Potential short AGAINST the trend (used better as a warning to watch trade in case exit required.)
Best used to confirm your TA and provide additional confirmation on market conditions. (not as a standalone buy sell indicator)
I've found it useful for keeping my head right by showing me clearly the trend on the larger timeframes and keeping me out of the market until I see conditions that meet my entry criteria. Backtesting seems to show good results on the 1hr (default settings)