ORB 9:30 AM 15-Min Range - All TimeframesMy NYC session ORB stategy script. It find the NYC opening range on the 15min timeframe and displays it across all timeframes.
스크립트에서 "range"에 대해 찾기

20 Day Range High/Low (Turtle Soup)This indicator identifies the Highest High and Lowest Low of the last 20 periods (customizable) and projects horizontal support/resistance lines to the right.
Unlike standard Donchian Channels or other High/Low indicators that clutter the chart with historical "steps" or extend lines infinitely to the left, this script focuses on chart cleanliness.
Key Features:
Pivot-Point Start: The lines do not span the whole chart. They start exactly at the candle where the High or Low occurred.
Right Extension: Lines extend only to the future, providing a clear visual for potential breakouts or support levels.
No Historical Clutter: It does not draw the past movement of the High/Low, keeping your chart clean for price action analysis.
Dynamic: As new Highs or Lows are made, the lines instantly update to the new positions.
How to Use:
Trend Identification: Use the High line as a resistance/breakout level (similar to Turtle Trading strategies).
Stop Loss Placement: The Low line of the last 20 days often acts as a trailing stop location for long-term trends.
Timeframes: While designed for the classic "20-Day" lookback on the Daily chart, this script works on any timeframe (e.g., finding the 20-hour range on a 1H chart).
Settings:
Length: Default is 20 bars. You can change this in the settings to any lookback period you prefer (e.g., 50, 100).

Asian Range [FE]This script will help you mark out the Asian session range as well as write down your trading rules at the top right corner,


Average True Range Stop Loss Finder [MasterYodi]This indicator utilizes the Average True Range (ATR) to help traders identify optimal stop-loss levels that reduce the risk of premature exits caused by market volatility or tight stop placements. The default multiplier is set to 1.5, providing a balanced stop-loss buffer. For more conservative setups, a multiplier of 2 is recommended; for tighter risk management, use 1.
ATR values and corresponding stop-loss levels are displayed in a table at the bottom of the chart.
Use the high-based (red) level for short positions
Use the low-based (teal) level for long positions

[Asian Range + Sweeps]Main Features
Asian Range (S2) — fully configurable session band (start/end, hour:minute) with automatic detection and visual high/low markers.
HOD/LOD (S1) — adaptive cutoff logic for Forex vs Indices, with optional manual override.
Gap Correction — optional true HOD/LOD detection using a 1-minute base with overnight gap adjustment.
Sweep Detection — real-time alerts for S1 and S2 sweeps, with independent cooldown control to avoid duplicate signals.
Visual Controls — customizable colors, line thickness, and transparency.
KeepDays Setting — allows you to manage how many past session drawings are preserved on the chart

Monday 1H BODY Range → End of Week (solid + levels)lines marking out monday range with fibonacci extensions

Session Streaks [LuxAlgo]The Session Streaks tool allows traders to identify whether a session is bullish or bearish on the chart. It also shows the current session streak, or the number of consecutive bullish or bearish sessions.
The tool features a dashboard with information about the session streaks of the underlying product on the chart.
🔶 USAGE
Analyzing session streaks is commonly used for market timing by studying the number of consecutive sessions over time and how long they last before the market changes direction.
We identify a bullish session as one in which the closing price is equal to or greater than the opening price, and a bearish session as one in which the closing price is below the opening price.
Each session is labeled according to its bias (bullish or bearish) and the number of consecutive sessions of the same type that conform the current streak.
🔹 Dashboard
The dashboard at the top shows information about the current session.
Under the "Streaks" header, historical information about session streaks is displayed, divided into bullish and bearish categories.
Number: Total number of streaks.
Median: The average duration of those streaks. We chose the median over the mean to avoid misrepresentation due to outliers.
Mode: The most common streak duration.
As the image shows, for this particular market, there are more bullish streaks than bearish ones. Bullish streaks have an average duration that is longer than that of bearish streaks, and both have the same most common streak duration.
If the current session is bullish and the median streak duration for bullish sessions is three, then we could consider scenarios in which the next two sessions are bullish.
🔶 DETAILS
🔹 Streaks On Larger Timeframes
On timeframes lower than or equal to Daily, the tool identifies each consecutive session, but this behavior changes on larger timeframes.
On timeframes larger than daily, the tool identifies the last session of each bar. Let's use the chart in the image as a reference.
At the top of the image, there is a daily chart where each session corresponds to each candle. One candle equals one day.
In the middle, we have a weekly chart where each session is the last session of each week, which is usually Friday for the Nasdaq 100 futures contract. The levels and labels displayed correspond to the last session within each candle, which is the last day of each week.
The levels and labels on the monthly chart correspond to the last session of each month, which is the last day of each month.
🔹 Gradient Style
Traders can choose between two different color gradients for the session background. Each gradient provides different information about price behavior within each session.
Horizontal: Green indicates prices at the top of the session range and red indicates prices at the bottom.
Vertical: Green indicates prices that are equal to or greater than the open price and red indicates prices that are below the open price of the session.
🔶 SETTINGS
🔹 Dashboard
Dashboard: Enable or disable the dashboard.
Position: Select the location of the dashboard.
Size: Select the dashboard size.
🔹 Style
Bullish: Select a color for bullish sessions.
Bearish: Select a color for bearish sessions.
Transparency: Select a transparency level from 100 to 0.
Gradient: Select a horizontal or vertical gradient.

50-Minute Opening Range BreakoutThis is a test of the opening range with Bearish/Bullish confirmation

Narrowing Range Predictor - EnhancedNarrowing Range Predictor - draws triangles and beaks from the price action. Recommended to play around with settings.

Narrowing Range PredictorNarrowing Range Indicator with several configurables. Recommended to play around with customised settings.
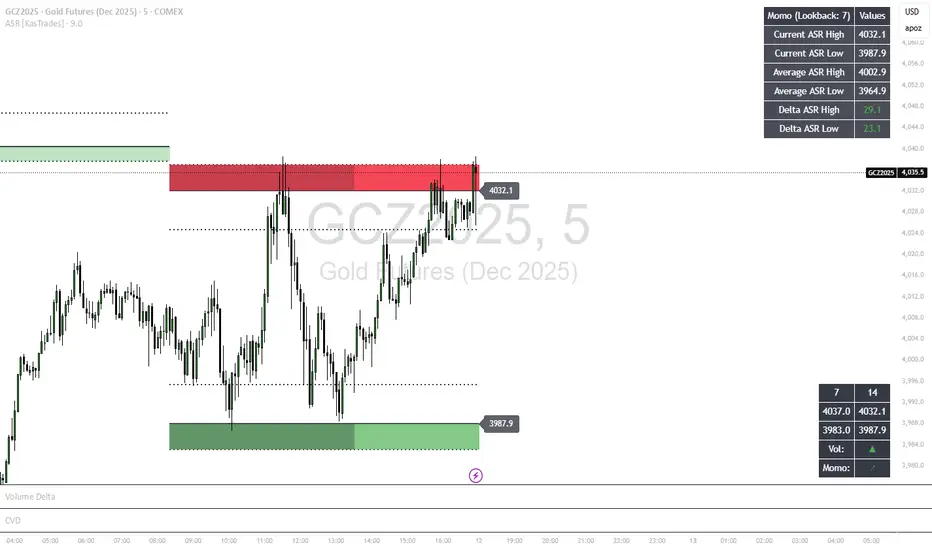
ASR - Average Session Range [KasTrades]This indicator displays the Average Session Range based on the session of your choice.
You can turn the tables off if you don't want to see a table version of the ASR levels. There is also a momentum table showing the current momentum, which you can also turn off.
Opening Range Fibonacci Extensions (ATR Adjusted)this script displays daily, weekly, or monthly range extensions as a function of ATR in a Fibonacci retracement

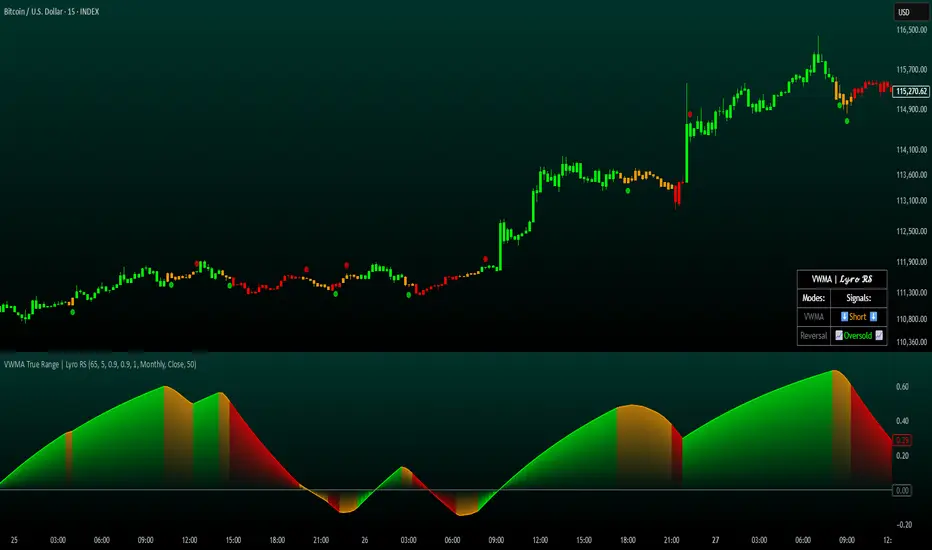
VWMA True Range | Lyro RSVWMA True Range | Lyro RS
This script is a hybrid technical analysis tool designed to identify trends and spot potential reversals. It employs a consensus-based system that uses multiple smoothed, Volume-Weighted Moving Averages (VWMA) to generate both trend-following and counter-trend signals.
Understanding the Indicator's Components
The indicator plots a main line on a separate pane and provides visual alerts directly on the chart.
The Main Line: This line represents a smoothed average of momentum scores derived from multiple VWMAs. Its direction and value are the foundation of the analysis.
Signal Generation: The tool provides two distinct types of signals:
Trend Signals: These trend-following signals ("⬆️Long" / "⬇️Short") activate when the indicator's consensus reaches a pre-set strength threshold, indicating sustained momentum in one direction.
Reversal Signals: These counter-trend alerts ("📈Oversold" / "📉Overbought") trigger when the main line breaks a previous period's level, hinting at exhaustion and a potential short-term reversal.
Visual Alerts:
Colored Background: The indicator's background highlights during strong trend signals for added visual emphasis.
Chart Shapes: Small circles appear on the main chart to mark where potential reversals are detected.
Colored Candles: You can choose to color the price candles to reflect the current trend signal.
Information Table: A compact table provides an at-a-glance summary of all currently active signals.
Suggested Use and Interpretation
Here are a few ways to incorporate this indicator into your analysis:
Following the Trend: Use the "Long" or "Short" trend signals to align your trades with the prevailing market momentum.
Spotting Reversals: Watch for "Oversold" or "Overbought" reversal signals, often accompanied by chart shapes, to identify potential market turning points.
Combining Signals: Use the primary trend signal for context and look for reversal signals that may indicate a pullback within the larger trend, potentially offering favorable entry points.
Customization Options:
You can tailor the indicator's behavior and appearance through several settings:
Core Settings: Adjust the Calculation Period and Smooth Length to make the main line more or less responsive to price movements.
Signal Thresholds: Fine-tune the Long threshold and Short threshold to control how easily trend signals are triggered.
Visual Settings: Toggle various visual elements like the indicator band, candle coloring, and the information table on or off.
Table Settings: Customize where the information table appears and its size to suit your chart layout.
⚠️Disclaimer
This indicator is a tool for technical analysis and does not guarantee future results. It should be used as part of a comprehensive trading strategy that includes other analysis techniques and strict risk management. The creators are not responsible for any financial decisions made based on its signals.
OBR 15min Session Opening Range Breakout + Volume Trend DeltaMLGOBR 15min Session Opening Range Breakout + Volume Trend DeltaMLG

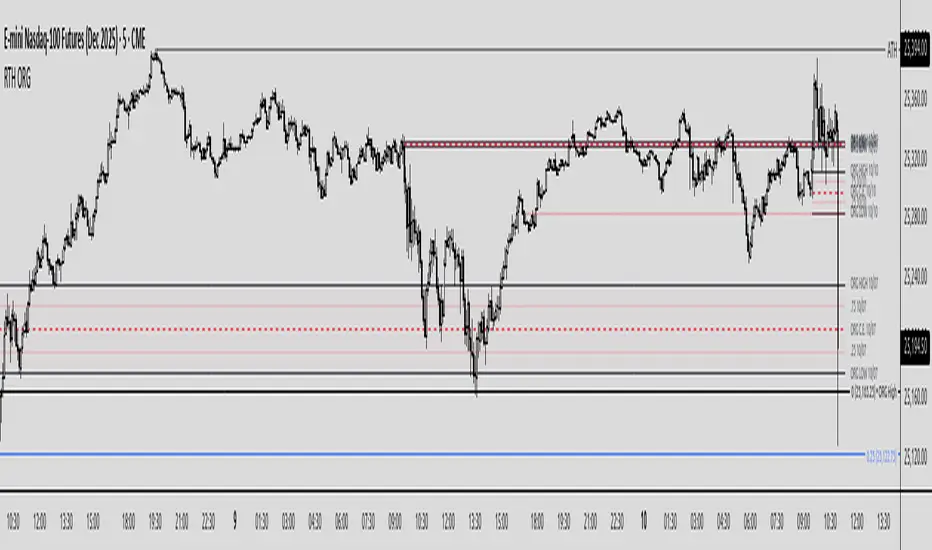
Regular Trading Hours Opening Range Gap (RTH ORG)### Regular Trading Hours (RTH) Gap Indicator with Quartile Levels
**Overview**
Discover overnight gaps in index futures like ES, YM, and NQ, or stocks like SPY, with this enhanced Pine Script v6 indicator. It visualizes the critical gap between the previous RTH close (4:15 PM ET for futures, 4:00 PM for SPY) and the next RTH open (9:30 AM ET), helping traders spot potential price sensitivity formed during after-hours trading.
**Key Features**
- **Standard Gap Boxes**: Semi-transparent boxes highlight the gap range, with optional text labels showing day-of-week and "RTH" identifier.
- **Midpoint Line**: A customizable dashed line at the 50% level, with price labels for quick reference.
- **New: Quartile Lines (25% & 75%)**: Dotted lines (default width 1) mark the quarter and three-quarter points within the gap, ideal for finer intraday analysis. Toggle on/off, adjust style/color/width, and add labels.
- **High-Low Gap Variant**: Optional boxes and midlines for gaps between the prior close's high/low and the open's high/low—perfect for wick-based overlaps on lower timeframes (5-min or below recommended).
- **RTH Close Lines**: Extend previous close levels with dotted lines and price tags.
- **Customization Galore**: Extend elements right, limit historical displays (default: 3 gaps), no-plot sessions (e.g., avoid weekends), and time offsets for non-US indices.
**How to Use**
Apply to 15-min or lower charts for best results. Toggle "extend right" for ongoing levels. SPY auto-adjusts for its 4 PM close.
Tested on major indices—enhance your gap trading strategy today! Questions? Drop a comment.
Thanks to twingall for supplying the original code.
Thanks to The Inner Circle Trader (ICT) for the logical and systematic application.
Total Points Range by exp3rtsThis indicator measures and displays the true intraday movement of a market by approximating tick-level activity using 1-second data aggregation. Instead of only looking at net candle movement, it sums every price change during a session, giving traders a more accurate picture of market effort and volatility.
Total Points Moved (TPM) – Captures the full distance traveled by price, not just the net gain/loss.
Bullish vs. Bearish Movement – Separates upward and downward moves so you can see who dominated the session.
Custom Sessions – Define your own session start/end times and time zone for precise tracking.
End-of-Session Summary – Automatically plots a label at session completion with totals for TPM, bullish, and bearish movement.
Visual Session Highlighting – Background shading makes it easy to see when the chosen session is active.
This tool is useful for:
Understanding the true effort vs. result of price movement
Comparing volatility across sessions
Identifying whether bulls or bears contributed more to market swings
Supporting order flow and tick-based trading strategies

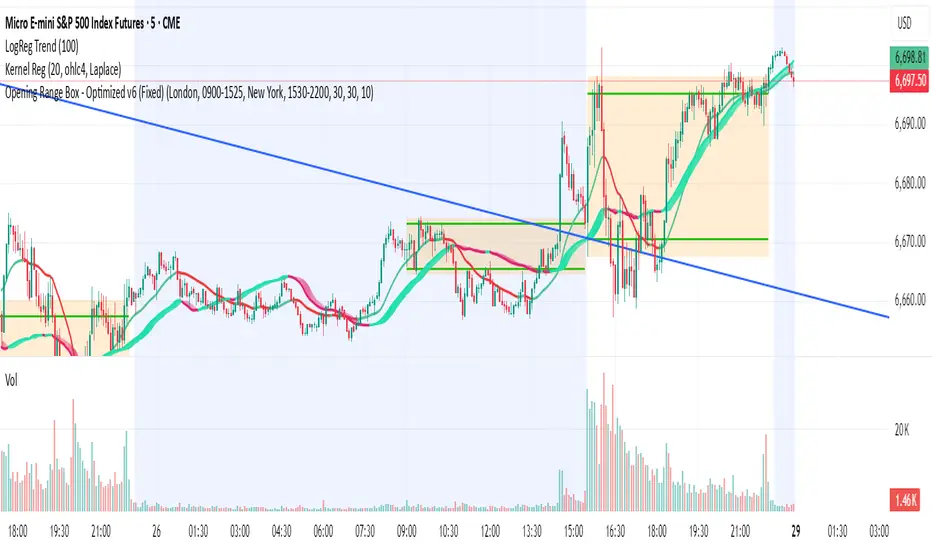
Opening Range BoxThis indicator, called the "Opening Range Box," is a visual tool that helps you track the start of key trading sessions like London and New York (or whatever session you set).
It does three main things:
Finds the Daily 'First Move': It automatically calculates the High and Low reached during the first 30 minutes (or whatever time you set) of each defined session.
Draws a Box: It immediately draws a colored, transparent box on your chart from the moment the session starts. The top of the box is the OR High, and the bottom is the OR Low. This box acts as a clear reference for the session's initial boundaries.
Extends the Levels: After the initial 30 minutes are over, the box stops growing vertically (it locks in the OR High/Low) but continues to stretch out horizontally for the rest of the trading session. This allows you to easily see how the price reacts to the opening levels throughout the day.
In short: It visually highlights the most important price levels established at the very beginning of the major market sessions.

Opening Range BoxThis indicator, called the "Opening Range Box," is a visual tool that helps you track the start of key trading sessions like London and New York.
It does three main things:
Finds the Daily 'First Move': It automatically calculates the High and Low reached during the first 30 minutes (or whatever time you set) of each defined session.
Draws a Box: It immediately draws a colored, transparent box on your chart from the moment the session starts. This box acts as a clear reference for the session's initial boundaries.
Extends the Levels: After the initial 30 minutes are over, the box stops growing vertically (it locks in the OR High/Low) but continues to stretch out horizontally for the rest of the trading session. This allows you to easily see how the price reacts to the opening levels throughout the day.
In short: It visually highlights the most important price levels established at the very beginning of the major market sessions.
2nd 1H: Midpoints (white=2nd mid, blue=2-candle range mid)2nd 1H: Midpoints (white=2nd mid, blue=2-candle range mid)
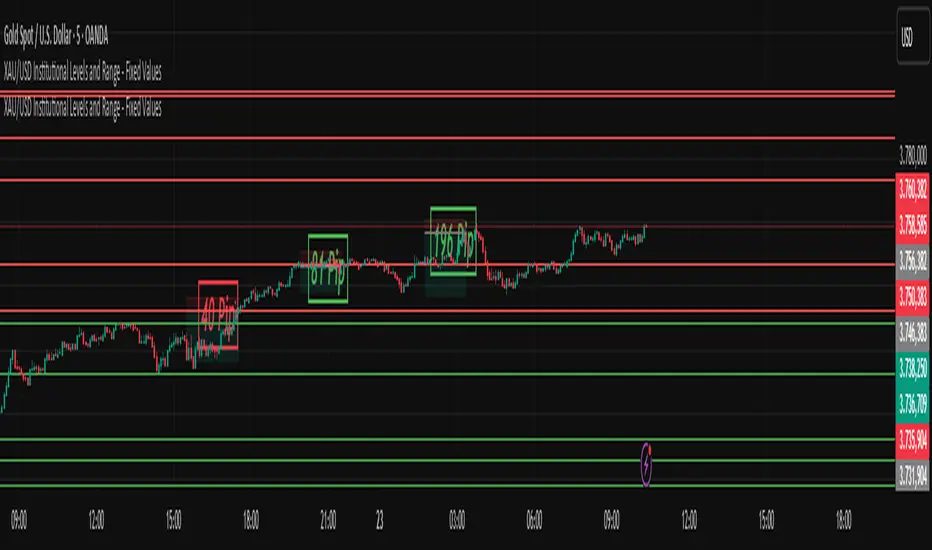
XAU/USD Institutional Levels and Range - Final VersionXAU/USD Institutional Levels and Range - Final Version