Cycle Swing MomentumAdaptive Ultra-Smooth Momentum indicator
The Cycle-Swing-Indicator "CSI" provides an optimized "momentum" oscillator based on the current dominant cycle by looking at the swing of the dominant cycle instead of the raw source momentum. Offering the following improvements:
Smoothness
Zero delay
Sharpness at turning points
Robust and adaptable to market conditions
Accurate deviation detection
The following common problems with standard indicators are solved by this indicator:
First, normal indicators introduce a lot of false signals due to their noisy signal line. Second, to compensate for the noise, one would normally try to add some smoothing. But this only results in adding more delay to the indicator, which makes it almost useless. Third, standard indicators require a length adjustment to derive reliable signals. However, you never know how to set the right length.
All three problems described above are solved by the developed adaptive cyclic algorithm.
The above chart shows current Bitcoin 4h data from the last days as of writing with the proposed signal reading for this indicator. The standard momentum indicator is included for comparison.
HOW TO USE
The indicator works without any parameter and can be applied to any chart and any time-frame. It will adapt automatically to the Dominant Cycle and use the dominant cycle of the source data to derive the ultra smooth momentum curve. Adaptive upper/lower bands are included and highlight areas with extreme readings. Automatic divergence detection can be turned off/on.
HOW TO READ
The indicator can be used like any oscillator. In addition, it provides adaptive high and low bands.
* Look for turns above the upper/lower bands
* Look for divergences between source and signals line
Further reading/Original source:
The indicator uses the dominant cycle to optimize signal, smoothing and cyclic memory. To get more in-depth information on the Cycle Swing Indicator, please read Chapter 10 "Cycle Swing Indicator: Trading the swing of the dominant cycle" of the book "Decoding the Hidden Market Rhythm, Part 1" available at your favorite book store.
Related ideas:
Please also check the cyclic RSI indicator which also uses cyclic information to improve the signal.
스크립트에서 "momentum"에 대해 찾기

Adaptive Momentum Oscillator(AMO)Here is a new experimental indicator that we've been developing that is focused on gauging momentum.
The indicator fluctuates above and below zero, but instead of using zero as the threshold for differentiating positive and negative momentum, it uses an 89 period median(plotted as the thick white line).
The momentum over the previous 10 periods is then calculated and then smoothed using a 6 period Exponential Moving Average (EMA). This, as well as the choice to use a median as the central divider were done to eliminate the whipsaws that are often generated when making strategies based on pure momentum and crossings above/below 0. The EMA alternates between lime green when it is above the median and pink when it is below. The area between the EMA and median is filled in green when EMA > median and pink when the EMA is less than the median.
Then, a 29 period Simple Moving Average of momentum is calculated. Here, going with a SMA over EMA and a longer window(29) seemed to make sense as it is counteracts the high responsiveness of the EMA. The SMA is green when greater than the median and red when less than the median.
There's two ways to trade using this system. One way would be to go long when the momentum EMA crosses over the white median line and turns lime green, then short when it crosses back under the median line and turns white. Another option is to go long under the same conditions, but short when both the EMA and SMA are above the median and the EMA crosses under the SMA.
Not sure if this exact configuration has already been created by someone, but it'll be interesting to see how it holds up with more backtesting and then running it fully automated.
-Strategy version coming soon-

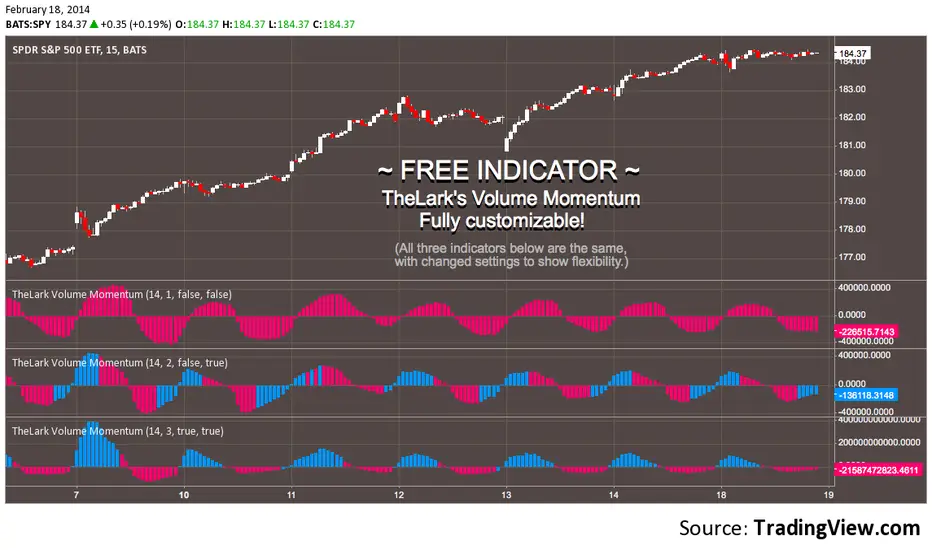
FREE INDICATOR: VOLUME MOMENTUMFor the momentum trader there are plenty of price momentum indicators, here's one that tracks the volume's momentum. Rising momentum in both price and volume is great for any momentum trader.
Add this to your chart, play with the settings, and maybe you'll notice something new!
Grab the source code here: pastebin.com
Installation video by @ChrisMoody here : vimeopro.com
·´¯`·.¸¸.·´¯`· Feel free to follow me to keep up with my latest scripts! ·´¯`·.¸¸.·´¯`·
·´¯`·.¸¸.·´¯`· PLEASE THUMB UP OR STAR IF YOU LIKE THIS INDICATOR! ·´¯`·.¸¸.·´¯`·
I'd like as many people as possible to get it :)
FluxPulse Momentum [JOAT]FluxPulse Momentum - Adaptive Multi-Component Oscillator
FluxPulse Momentum is a composite oscillator that blends three distinct momentum components into a single, smoothed signal line. Rather than relying on a single indicator, it synthesizes adaptive RSI, normalized rate of change, and a Kaufman-style efficiency ratio to provide a multi-dimensional view of momentum.
What This Indicator Does
Combines RSI, Rate of Change (ROC), and Efficiency Ratio into one weighted composite
Applies EMA smoothing to reduce noise while preserving responsiveness
Displays overbought/oversold zones with optional background highlighting
Generates buy/sell signals when the oscillator crosses its signal line in favorable zones
Provides a real-time dashboard showing current state, momentum direction, and efficiency
Core Components
Adaptive RSI (50% weight) — Standard RSI calculation normalized around the 50 level
Normalized ROC (30% weight) — Rate of change scaled relative to its recent maximum range
Efficiency Ratio (20% weight) — Measures directional movement efficiency, inspired by Kaufman's adaptive concepts
The final composite is smoothed twice using EMA to create both a fast line and a signal line.
Signal Logic
// Buy signal: crossover in lower half
buySignal = ta.crossover(qmo, qmoSmooth) and qmo < 50
// Sell signal: crossunder in upper half
sellSignal = ta.crossunder(qmo, qmoSmooth) and qmo > 50
Signals are generated only when the oscillator is positioned favorably—buy signals occur below the 50 midline, sell signals occur above it.
Dashboard Information
The on-chart table displays:
Current oscillator value with gradient coloring
Momentum state (Overbought, Oversold, Bullish, Bearish, Neutral)
Momentum direction and acceleration
Efficiency ratio percentage
Active signal status
Inputs Overview
RSI Length — Period for RSI calculation (default: 14)
ROC Length — Period for rate of change (default: 10)
Smoothing Length — EMA smoothing period (default: 3)
Overbought/Oversold Levels — Threshold levels for zone detection
Await Bar Confirmation — Wait for bar close before triggering alerts
How to Use It
Watch for crossovers between the main line and signal line
Use overbought/oversold zones to identify potential reversal areas
Monitor the histogram for momentum acceleration or deceleration
Combine with price action analysis for confirmation
Alerts
Buy Signal — Bullish crossover in the lower zone
Sell Signal — Bearish crossunder in the upper zone
Overbought/Oversold Crosses — Level threshold crossings
This indicator is provided for educational purposes. It does not constitute financial advice. Always conduct your own analysis before making trading decisions.
— Made with passion by officialjackofalltrades

Gap-Up Momentum Screener (S.S)
ENGLISH-VERSION
1) TradingView Gap Screener (for US stocks)
➤ Conditions
Gap-Up ≥ +3% (large gaps indicate institutional pressure)
Pre-market volume ≥ 150% of the 20-day average
RS line > 50
Price > 50 SMA
Market cap ≥ 1 billion USD
No penny stocks
2) Minervini Gap-Entry Strategy (Swing Trading)
This is a variant specifically optimized for gaps + momentum.
A) Setup Criteria
The stock must meet the following conditions:
Gap-Up ≥ +3%
First retracement ≤ 30% of the gap
High relative strength (RS line rising)
Volume on the gap day > 2× average
Price above 20 EMA, 50 SMA, 150 SMA, 200 SMA
No immediate resistance within 2–5%
B) Entry Setups
Entry 1: First Pullback Entry (FPE)
Wait for the first 1–3 day consolidation.
Entry → Breakout of the small range.
Stop → Below the low of the pullback.
Rule: No entry on the gap day itself.
Entry 2: High Tight Flag above the Gap
Stock rises > 10% after the gap
Then forms a 3–8 day sideways phase
Entry → Break above the flag’s high
Stop → Below the flag base
Entry 3: ORB Entry (Opening Range Breakout, 30 minutes)
Very effective for strong gaps.
Wait 30 minutes after the market opens
Entry → Break above the high of these first 30 minutes
Stop → Below the 30-minute low
C) Stop Levels
For FPE: 4–8%
For ORB: 1–2 × ATR(14)
For flags: 3–5%
D) Add Rules
Only if the stock continues showing strong volume:
Add on every new 3–5 day high
Add only above half-range levels
Maximum 3 adds
3) Early-Warning Module (Setup forming but not ready for entry)
This module marks stocks that are forming a setup but are not yet buyable.
➤ Criteria
Gap-Up ≥ 3%
Strong volume
Stock pulls back and consolidates (1–5 bars)
BUT no breakout yet
4) Exact Entry Checklist (Minervini-style, optimized for gaps)
Checklist before entry:
Gap ≥ +3%
20 EMA rising
Volume > 2× average
RS line rising
Price > 50 SMA
Pullback not deeper than 30% of the gap
3+ green signals from the Early-Warning diamonds
If all 7 are fulfilled → green light.
5) How to apply the strategy in daily practice
Morning (08:00–09:00)
Check the screener
Build your watchlist
Identify gaps
US Market Open (15:30)
Monitor the Early-Warning module
Sort gap momentum opportunities
16:00–17:00
Enter: First Pullback / ORB / Flag
Set stops
Determine position size based on risk
After 20:00
Check volume strength
If momentum fades → no more adds

RSI Momentum ScalperOverview
The "RSI Momentum Scalper" is a Pine Script v5 strategy crafted for trading highly volatile markets, with a special focus on newly listed cryptocurrencies. This strategy harnesses the Relative Strength Index (RSI) alongside volume analysis and momentum thresholds to pinpoint short-term trading opportunities. It supports both long and short trades, managed with customizable take profit, stop loss, and trailing stop levels, which are visually plotted on the chart for easy tracking.
Why I Created This Strategy
I developed the "RSI Momentum Scalper" because I was seeking a reliable trading strategy tailored to newly listed, highly volatile cryptocurrencies. These assets often experience rapid price fluctuations, rendering traditional strategies less effective. I aimed to create a tool that could exploit momentum and volume spikes while managing risk through adaptable exit parameters. This strategy is designed to address that need, offering a flexible approach for traders in dynamic crypto markets.
How It Works
The strategy utilizes RSI to identify momentum shifts, combined with volume confirmation, to trigger long or short entries. Trades are controlled with take profit, stop loss, and trailing stop levels, which adjust dynamically as the price moves in your favor. The trailing stop helps lock in profits, while the plotted exit levels provide clear visual cues for trade management.
Customizable Settings
The script is highly customizable, allowing you to adjust it to various market conditions and trading styles. Here’s a brief overview of the key settings:
Trade Mode: Select "Both," "Long Only," or "Short Only" to determine the trade direction.
(Default: Both)
RSI Length: Sets the lookback period for the RSI calculation (2 to 30).
(Default: 8)
A shorter length increases RSI sensitivity, suitable for volatile assets.
RSI Overbought: Defines the upper RSI threshold (60 to 99) for short entries.
(Default: 90)
Higher values signal stronger overbought conditions.
RSI Oversold: Defines the lower RSI threshold (1 to 40) for long entries.
(Default: 10)
Lower values indicate stronger oversold conditions.
RSI Momentum Threshold: Sets the minimum RSI momentum change (1 to 15) to trigger entries.
(Default: 14)
Adjusts the sensitivity to price momentum.
Volume Multiplier: Multiplies the volume moving average to filter high-volume bars (1.0 to 3.0).
(Default: 1)
Higher values require stronger volume confirmation.
Volume MA Length: Sets the lookback period for the volume moving average (5 to 50).
(Default: 13)
Influences the volume trend sensitivity.
Take Profit %: Sets the profit target as a percentage of the entry price (0.1 to 10.0).
(Default: 4.15)
Determines when to close a winning trade.
Stop Loss %: Sets the loss limit as a percentage of the entry price (0.1 to 6.0).
(Default: 1.85)
Protects against significant losses.
Trailing Stop %: Sets the trailing stop distance as a percentage (0.1 to 4.0).
(Default: 2.55)
Locks in profits as the price moves favorably.
Visual Features
Exit Levels: Take profit (green), fixed stop loss (red), and trailing stop (orange) levels are plotted when in a position.
Performance Table: Displays win rate, total trades, and net profit in the top-right corner.
How to Use
Add the strategy to your chart in TradingView.
Adjust the input settings based on the cryptocurrency and timeframe you’re trading.
Monitor the plotted exit levels for trade management.
Use the performance table to assess the strategy’s performance over time.
Notes
Test the strategy on a demo account or with historical data before live trading.
The strategy is optimized for short-term scalping; adjust settings for longer timeframes if needed.

52SIGNAL RECIPE AMA Momentum Vector═══52SIGNAL RECIPE AMA Momentum Vector═══
◆ Overview
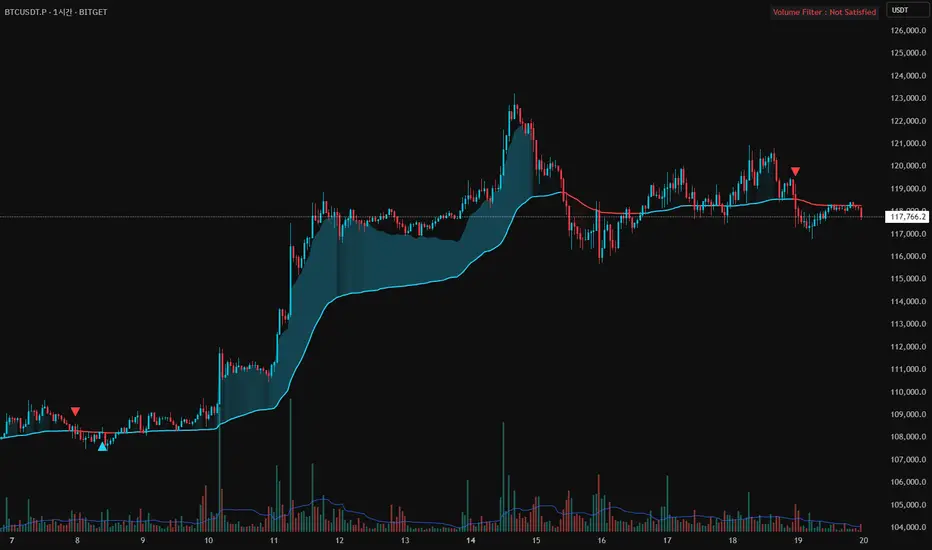
52SIGNAL RECIPE AMA Momentum Vector is an advanced technical indicator based on Adaptive Moving Average (AMA), integrating volume filtering and gradient zone visualization to provide comprehensive analysis of price trends and momentum.
It automatically adjusts to market conditions by calculating efficiency ratios, reducing noise while clearly capturing significant trends. The volume confirmation system helps traders identify high-probability entry and exit points with precision.
─────────────────────────────────────
◆ Key Features
• Adaptive Moving Average: Smart moving average that automatically adjusts based on market conditions
• Volume Filter Integration: Double-confirmation of important price movements through volume analysis
• Momentum Gradient Zones: Intuitive visualization of trend strength through color gradation
• Signal Confirmation System: Generation of high-reliability buy/sell signals by combining multiple factors
• Trend Direction Identification: Clear color distinction between bullish and bearish market conditions
• Automatic Adaptation: Intelligent design that self-adjusts to various market situations
─────────────────────────────────────
◆ Technical Foundation
■ AMA Calculation Principles
• Efficiency Ratio (ER): Measures how efficiently price moves in one direction
• Dynamic Smoothing Coefficient: Automatically adjusts faster or slower based on market conditions
• Adaptive Algorithm: Less sensitive during sideways markets, more responsive during trending markets
• Noise Reduction Function: Filters out meaningless price movements while capturing important signals
■ Momentum Vector Implementation
• Trend-Price Distance Calculation: Measures trend strength by the distance between AMA and current price
• Color Gradation: Visual system where color intensity changes proportionally to trend strength
• ATR-Based Adjustment: Automatically adjusts gradient zone width according to market volatility
• Directional Color Distinction: Intuitive display with blue/cyan for uptrends and red for downtrends
─────────────────────────────────────
◆ Practical Applications
■ Price Trend Interpretation
• Trend Direction Assessment:
▶ Price above AMA with blue gradation indicates ongoing bullish momentum
▶ Price below AMA with red gradation indicates ongoing bearish momentum
• Momentum Strength Verification:
▶ Deeper gradient colors mean stronger momentum and healthier trends
▶ Lighter gradient colors suggest weakening momentum and potential reversal
■ Trading Strategy Utilization
• Trend Following Strategy:
▶ Buy signal when price crosses above AMA with increased volume
▶ Sell signal when price crosses below AMA with increased volume
• Momentum Confirmation Trading:
▶ Deep gradation increases confidence in trend continuation for entry decisions
▶ Multiple consecutive candles staying on one side of AMA increases trend reliability
─────────────────────────────────────
◆ Advanced Configuration Options
■ Input Parameter Guide
• Fast Period (Default: 2)
▶ 1-2: Responds very quickly to price changes. Suitable for short-term trading.
▶ 3-5: Moderate response that reduces frequent signals.
▶ 6-10: Slower response but captures only more definitive trends.
• Slow Period (Default: 30)
▶ 20-25: AMA moves faster. Good for shorter timeframe trading.
▶ 26-35: Balanced speed suitable for most market conditions.
▶ 36-50: AMA moves slowly, smoothly following long-term trends.
• Efficiency Ratio Period (Default: 10)
▶ 5-8: Focuses more on recent price movements. Responds quickly to changes.
▶ 9-12: Balanced period suitable for most situations.
▶ 13-20: Considers longer-term price movements, ignoring temporary fluctuations.
• Volume Average Period (Default: 20)
▶ 10-15: Compares with the average volume of the last 10-15 days. More sensitive to changes.
▶ 16-25: Compares with the average volume of approximately the last month. Balanced setting.
▶ 26-50: Compares with long-term average volume, capturing only truly significant volume changes.
• Volume Threshold Multiplier (Default: 1.2)
▶ 1.0-1.1: Recognizes volume just 10% above average as valid.
▶ 1.2-1.5: Requires volume 20-50% higher than average (e.g., 1.2 means 120% of average).
▶ 1.6-2.0: Recognizes only very high volume at least 1.6 times (160%) above average.
■ Timeframe-Specific Recommended Settings
• Short Timeframes (5min-1hr):
Fast Period 2, Slow Period 20, Efficiency Ratio Period 8
→ Responds quickly to price changes, suitable for day trading.
• Medium Timeframes (4hr-daily):
Fast Period 2, Slow Period 30, Efficiency Ratio Period 10
→ Most balanced setting for general swing trading.
• Long Timeframes (daily-weekly):
Fast Period 2, Slow Period 40, Efficiency Ratio Period 14
→ Optimized for smoothly tracking longer trends.
■ Market-Specific Recommended Settings
• Stock Market:
Volume Threshold 1.2, Volume Average Period 20
→ Signal is valid when volume is 20% above average.
• Forex Market:
Volume Threshold 1.5, Efficiency Ratio Period 12
→ Forex requires higher volume to be meaningful and slightly longer efficiency measurement.
• Cryptocurrency Market:
Volume Threshold 1.3, Fast Period 2, Slow Period 25
→ Settings optimized for highly volatile cryptocurrencies.
─────────────────────────────────────
◆ Synergy with Other Indicators
• Moving Averages: Trend reliability increases when AMA and key moving averages point in the same direction
• RSI/Stochastic: Powerful reversal signals when AMA crossovers occur in overbought/oversold zones
• MACD: Signal probability greatly increases when MACD histogram direction changes coincide with AMA crossovers
• Bollinger Bands: Trend strength can be determined by AMA's position within Bollinger Bands
• Support/Resistance Levels: Success probability dramatically increases when AMA breakouts occur at key price levels
─────────────────────────────────────
◆ Conclusion
AMA Momentum Vector provides accurate price trend analysis by combining the advanced features of adaptive moving averages with momentum visualization technology.
It perfectly adapts to constantly changing market environments through its self-adjusting algorithm and generates highly reliable trading signals through its volume confirmation system.
Users can optimize the indicator for their trading style and market conditions with simple parameter adjustments, enabling effective trading decisions that comprehensively consider price direction, momentum strength, and volume confirmation.
─────────────────────────────────────
※ Disclaimer: Past performance does not guarantee future results. Always use appropriate risk management strategies.
═══52SIGNAL RECIPE AMA Momentum Vector═══
◆ 개요
52SIGNAL RECIPE AMA Momentum Vector는 적응형 이동평균(AMA)을 기반으로 한 고급 기술적 지표로, 볼륨 필터링과 그라데이션 존 시각화를 통합하여 가격 추세와 모멘텀을 종합적으로 분석합니다.
시장 효율성 비율을 자동으로 계산하여 시장 상황에 맞게 스스로 조정되며, 노이즈는 줄이고 중요한 추세는 선명하게 포착합니다. 또한 볼륨 확인 시스템을 통해 높은 확률의 매매 시점을 정확하게 식별할 수 있도록 도와줍니다.
─────────────────────────────────────
◆ 주요 특징
• 적응형 이동평균: 시장 상황에 따라 자동으로 조정되는 스마트한 이동평균선
• 볼륨 필터 통합: 중요한 가격 움직임을 볼륨으로 한번 더 확인
• 모멘텀 그라데이션 존: 색상 그라데이션으로 추세의 강도를 직관적으로 시각화
• 신호 확인 시스템: 여러 요소를 종합하여 신뢰도 높은 매수/매도 신호 생성
• 추세 방향 식별: 상승세와 하락세를 색상으로 명확하게 구분
• 자동 적응 기능: 다양한 시장 상황에 알아서 맞춰지는 지능형 설계
─────────────────────────────────────
◆ 기술적 기반
■ AMA 계산 원리
• 효율성 비율 (ER): 가격이 얼마나 효율적으로 한 방향으로 움직이는지 측정
• 동적 평활화 계수: 시장 상황에 따라 빠르거나 느리게 자동 조절되는 계수
• 적응형 알고리즘: 횡보장에서는 둔감하게, 추세장에서는 민감하게 반응
• 노이즈 감소 기능: 무의미한 가격 움직임은 걸러내고 중요한 신호만 포착
■ 모멘텀 벡터 구현
• 추세-가격 거리 계산: AMA와 현재 가격 사이의 거리로 추세 강도 측정
• 색상 그라데이션: 추세 강도에 비례하여 색상 농도가 변하는 시각화 시스템
• ATR 기반 조정: 시장 변동성에 맞춰 그라데이션 영역 너비 자동 조절
• 방향성 색상 구분: 상승세는 파란색/청록색, 하락세는 빨간색으로 직관적 표시
─────────────────────────────────────
◆ 실용적 응용
■ 가격 추세 해석
• 추세 방향 판단:
▶ 가격이 AMA 위에 있고 파란색 그라데이션이 보이면 상승 모멘텀 진행 중
▶ 가격이 AMA 아래에 있고 빨간색 그라데이션이 보이면 하락 모멘텀 진행 중
• 모멘텀 강도 확인:
▶ 그라데이션 색상이 진할수록 모멘텀이 강하고 추세가 건강함을 의미
▶ 그라데이션 색상이 옅을수록 모멘텀이 약해지고 있으며 반전 가능성 시사
■ 트레이딩 전략 활용
• 추세 추종 전략:
▶ 가격이 AMA를 상향 돌파하고 볼륨이 증가하면 매수 신호
▶ 가격이 AMA를 하향 돌파하고 볼륨이 증가하면 매도 신호
• 모멘텀 확인 트레이딩:
▶ 진한 그라데이션은 추세 지속 가능성이 높음을 의미하므로 진입 확신 강화
▶ 여러 캔들이 연속해서 AMA 한쪽에 머물면 추세의 신뢰도가 높아짐
─────────────────────────────────────
◆ 고급 설정 옵션
■ 인풋 파라미터 가이드
• 빠른 기간 (Fast Period) (기본값: 2)
▶ 1-2: 가격 변화에 매우 빠르게 반응합니다. 단기 거래에 적합합니다.
▶ 3-5: 적당히 반응하여 잦은 신호를 줄여줍니다.
▶ 6-10: 반응이 느리지만 더 확실한 추세만 포착합니다.
• 느린 기간 (Slow Period) (기본값: 30)
▶ 20-25: AMA가 더 빠르게 움직입니다. 짧은 시간 거래에 좋습니다.
▶ 26-35: 균형 잡힌 속도로 대부분의 시장 상황에 적합합니다.
▶ 36-50: AMA가 천천히 움직여 장기 추세를 부드럽게 따라갑니다.
• 효율성 비율 기간 (Efficiency Ratio Period) (기본값: 10)
▶ 5-8: 최근 가격 움직임에 더 집중합니다. 변화에 빠르게 반응합니다.
▶ 9-12: 균형 잡힌 기간으로 대부분의 상황에 적합합니다.
▶ 13-20: 더 긴 기간의 가격 움직임을 고려하여 일시적인 변동을 무시합니다.
• 볼륨 평균 기간 (Volume Average Period) (기본값: 20)
▶ 10-15: 최근 10-15일의 평균 볼륨과 비교합니다. 변화에 민감합니다.
▶ 16-25: 지난 약 한 달간의 평균 볼륨과 비교합니다. 균형 잡힌 설정입니다.
▶ 26-50: 장기 평균 볼륨과 비교하여 정말 큰 볼륨 변화만 포착합니다.
• 볼륨 임계값 승수 (Volume Threshold Multiplier) (기본값: 1.2)
▶ 1.0-1.1: 평균보다 약 10% 정도만 높아도 유효한 볼륨으로 인정합니다.
▶ 1.2-1.5: 평균보다 20~50% 높은 볼륨을 요구합니다(예: 1.2는 평균의 120%).
▶ 1.6-2.0: 평균의 최소 1.6배(160%) 이상 되는 매우 높은 볼륨만 인정합니다.
■ 타임프레임별 추천 설정
• 짧은 시간 차트 (5분-1시간):
빠른 기간 2, 느린 기간 20, 효율성 비율 기간 8
→ 가격 변화에 빠르게 반응하며 단타에 적합합니다.
• 중기 차트 (4시간-일봉):
빠른 기간 2, 느린 기간 30, 효율성 비율 기간 10
→ 일반적인 스윙 트레이딩에 가장 균형 잡힌 설정입니다.
• 장기 차트 (일봉-주봉):
빠른 기간 2, 느린 기간 40, 효율성 비율 기간 14
→ 더 긴 추세를 매끄럽게 추적하는 데 최적화되었습니다.
■ 시장별 추천 설정
• 주식 시장:
볼륨 임계값 1.2, 볼륨 평균 기간 20
→ 평균보다 20% 많은 볼륨이 있을 때 신호가 유효합니다.
• 외환 시장:
볼륨 임계값 1.5, 효율성 비율 기간 12
→ 외환은 볼륨이 더 높아야 의미가 있으며, 약간 더 긴 효율성 측정이 필요합니다.
• 암호화폐 시장:
볼륨 임계값 1.3, 빠른 기간 2, 느린 기간 25
→ 변동성이 큰 암호화폐에 최적화된 설정입니다.
─────────────────────────────────────
◆ 다른 지표와의 시너지
• 이동평균선: AMA와 주요 이동평균선이 같은 방향을 가리킬 때 추세 신뢰도 상승
• RSI/스토캐스틱: 과매수/과매도 구간에서 AMA 교차 발생 시 강력한 반전 신호
• MACD: MACD 히스토그램 방향 변화와 AMA 교차가 일치하면 신호 확률 대폭 증가
• 볼린저 밴드: AMA가 볼린저 밴드 내에서 어떤 위치에 있는지로 추세 강도 판단
• 지지/저항 레벨: 중요 가격대에서 AMA 돌파 시 성공 확률이 크게 증가
─────────────────────────────────────
◆ 결론
AMA Momentum Vector는 적응형 이동평균의 고급 기능과 모멘텀 시각화 기술을 결합하여 정확한 가격 추세 분석을 제공합니다.
자체 조정 알고리즘으로 시시각각 변하는 시장 환경에 완벽하게 적응하며, 볼륨 확인 시스템을 통해 신뢰도 높은 매매 신호를 생성합니다.
사용자는 간단한 파라미터 조정으로 자신의 거래 스타일과 시장 상황에 맞게 지표를 최적화할 수 있어, 가격 방향, 모멘텀 강도, 볼륨 확인을 종합적으로 고려한 효과적인 거래 결정을 내릴 수 있습니다.
─────────────────────────────────────
※ 면책 조항: 과거 성과가 미래 결과를 보장하지 않습니다. 항상 적절한 리스크 관리 전략을 사용하세요.
Anit Momentum IndicatorAnit Momentum Indicator: A Powerful Trend Continuation Tool for Long-Only Strategies
The "Anit Momentum Indicator" (AMI) is a powerful technical analysis tool designed to assist traders in identifying potential trend continuation opportunities in the financial markets. Unlike traditional trend reversal indicators, AMI is specifically crafted for long-only strategies, making it an ideal tool for traders seeking to capture sustained uptrends.
Concepts and Functionality:
1. Momentum Calculation:
The Anit Momentum Indicator begins by calculating the momentum of the closing price over a specified period. Momentum represents the rate of price change, offering clues about the strength and direction of price movements during the chosen duration.
2. RSI for Trend Continuation:
The script then applies the RSI to the previously computed momentum values. The RSI is a well-known oscillator used to measure the speed and magnitude of price changes. By utilizing the RSI on momentum data, the Anit Momentum Indicator gains a distinct advantage in gauging the strength of price momentum, leading to more accurate trend evaluations.
3. Rescaling for Better Visualization:
To enhance visual clarity and maintain consistent representation, the RSI on Momentum is rescaled to range from 0 to 100. This normalization ensures that the indicator's values remain within a fixed range, making it easier for traders to identify crucial overbought and oversold regions.
How to Use the Indicator:
Long-Only Strategy:
The AMI is most effective in long-only strategies. Traders can deploy the indicator to identify promising opportunities to go long on a stock or asset. A long position is established when the AMI crosses above 50, signaling a robust upward momentum.
Trend Continuation Confirmation:
The AMI's ability to capture trend continuation opportunities allows traders to stay invested in an uptrend for an extended period. As long as the AMI remains above 50, the uptrend is considered intact, and traders may continue to hold the position.
Higher Timeframe Advantage:
The AMI's effectiveness is further enhanced on higher timeframes. Longer timeframes provide a more reliable and sustained view of the underlying trend, giving traders greater confidence in their long-only strategies.
Conclusion:
The Anit Momentum Indicator is a valuable tool for traders pursuing trend continuation strategies, specifically long-only approaches. By leveraging the concept of momentum and RSI, the AMI helps traders identify and participate in sustained uptrends. With its focus on trend continuation rather than reversals, the AMI can be a key component in building successful long-only trading strategies, especially on higher timeframes. Traders can use this indicator to stay invested in robust uptrends, maximizing their profit potential while minimizing exposure to counter-trend moves by staying long till AMI value is greater than 50,it is better to stay away or exit from the asst class when AMI value is less than 50.

Big Poppa Code Strat & Momentum Strategy IndicatorThis indicator is a combination of a few things in order to work with a unique trading style gleaned from Callme100k, jrgreatness, TrustMyLevels , FaithInTheStrat, Rob Smith and Saty Mahajan.
This Indicator is created to help you day trade using, ATR Fibonacci Levels, Price Action and Momentum.
It displays Fibonacci Levels Based on ATR to indicate when a security is 0.236, 0.382 +- the Days Open, +- the Days Open, 0.618 +- the Days Open and 1.0 +- Days Open.
To understand this script you need to understand
Average True Range (ATR)
1 Bar Inside Bar
2 Bar Outside Bar (Break either the top or bottom)
3 Bar Engulfing Bar
Strat Setups - 212, 322, 312
Fibonacci - 0.236, 0.382, 0.618, 1.0
Moving Averages
A Trend is considered bullish when (green)
Current Price is greater than the Fast EMA Value (8)
Fast EMA is greater than PIVOT EMA Value (21)
Pivot EMA is greater than SLOW EMA Value (34)
OR Hull is trending up and the Price is above the Volume Weighted Moving Average and price is above VWAP
A trend is considered Bearish when (red)
Current Price is less than the Fast EMA Value (8)
Fast EMA is less than PIVOT EMA Value (21)
Pivot EMA is less than SLOW EMA Value (34)
OR Hull is trending down and the Price is below the Volume Weighted Moving Average and price is below VWAP
If these conditions are not met then the Momentum is in Conflict (orange)
The Momentum band will match the color of the current trend
The table that is present can be turned off at any time lets you see
1) If Moving Averages are showing bullish, bearish or in conflict
2) If There us Time Frame Continuity, (if 5 min up, are all the other timeframes up also)
3) How much of the ATR have we moved on the day
4) Are we in Call or Put range for the day based on ATR Fib Levels
The Ideal situation for entering a call
1) Momentum is Green
2) FTFC on Green
3) A Strat Actionable Signal is present
4) You are in the call range, 0.236 - 0.618 ATR + the Price
5) The ATR still has room, I.e only 50% of the ATR has been run already
Ideal situation from entering a put
1) Momentum is red
2) FTFC on Red
3) A Strat Actionable Signal is present
4) You are in the put range, 0.236 - 0.618 ATR - the Price
5) The ATR still has room, I.e only 50% of the ATR has been run already
Exit the trade for these reasons you entered (for profit or loss)
1) ATR has no more room
2) FTFC is now in conflict
3) Momentum has shifted
Take Profit when
1) You reach a new ATR Level 0.618, 1.0 , -0.618, -1, etc
Passive Stop Loss
1) Open Price if you are aggressive
2) Next ATR Level Down or Up
Feel free to take profit and leave runners
This script does not give signals, you should do your own research, I am not a financial advisors, I am simply applying principles of seasoned veterans to code. You make all decisions about how you buy, sell and trade. The creator of this script makes no promises and takes no responsibility for your personal trading.
To research the methods described above look up
Rob Smith : The Strat
Saty Mahajan : ATR Levels
Fibonacci
Using the HULL Moving Average
Exponential Moving Averages
VWAP
VWMA

Momentum Divergence Oscillator by JJMomentum Divergence Oscillator by JJ
A powerful, all-in-one momentum tool designed to streamline trade confluence, combining multi-timeframe trend analysis with automatic divergence spotting and classic MACD signals.
How to Use This Indicator
This oscillator is designed to be used in the lower pane of your chart, beneath your primary price chart. It provides three main types of signals:
1. Multi-Timeframe (MTF) Trend Confirmation
The background shading is your primary trend filter. It looks at the MACD trend on two higher timeframes (30m and 60m by default) to confirm the market's overarching direction.
Green Shading: Indicates that both higher timeframes are in a bullish trend (MACD above signal line). Focus on looking for BUY signals during this time.
Red Shading: Indicates that both higher timeframes are in a bearish trend. Focus on looking for SELL signals during this time.
Grey/No Shading: The higher timeframes are not in agreement or are consolidating. Exercise caution or stick to standard price action rules.
2. Automatic Divergence Signals
Divergence is a powerful early warning system where the indicator moves in the opposite direction of the price. The indicator automatically flags these occurrences:
"Bull RSI Div" (Green Label-Up): Bullish divergence identified using the RSI oscillator. This suggests a potential reversal to the upside after a downtrend.
"Bear RSI Div" (Red Label-Down): Bearish divergence identified using the RSI oscillator. This suggests a potential reversal to the downside after an uptrend.
Tip: These signals are often most reliable when they occur within the corresponding MTF background colour (e.g., a "Bull RSI Div" during a Green MTF background).
3. Momentum Shifts and Crossovers
The standard plots provide immediate insight into market momentum:
Blue/Orange Lines: The traditional MACD line (Blue) and Signal line (Orange).
Histogram (Green/Red Bars): Represents the momentum difference between the MACD and Signal lines.
Zero-Line Crosses (Triangles): Tiny triangles appear when the MACD line crosses the zero line, indicating a shift in long-term momentum.
Peaks & Troughs (X-Crosses): The 'X' markers identify local peaks and troughs in the histogram, sometimes indicating short-term exhaustion of the current move.
Disclaimer: Trading involves significant risk and is not suitable for every investor. This indicator is for educational purposes only and should not be considered financial advice. Always use appropriate risk management.

Momentum with ATR and Volatility [ST]Momentum with ATR and Volatility
Description in English:
This indicator combines price momentum with market volatility to identify entry and exit points in trades.
It utilizes the difference in closing prices (momentum) and the Average True Range (ATR) to measure volatility. Buy and sell signals are generated based on the combination of these two components.
Detailed Explanation:
Configuration:
Momentum Length: This input defines the period for calculating the momentum, which is the difference between the closing prices. The default value is 10.
ATR Length: This input defines the period for calculating the Average True Range (ATR), which measures market volatility. The default value is 14.
ATR Threshold: This input defines the threshold multiplier for the ATR to generate buy and sell signals. The default value is 3.5.
Momentum Calculation:
Momentum is calculated as the difference between the current closing price and the closing price momentum_length periods ago.
ATR Calculation:
The ATR is calculated based on the specified length and is used to measure market volatility.
Buy and Sell Signals:
Buy Signal: Generated when momentum is positive, the current close is higher than the previous close, and momentum is greater than ATR * threshold.
Sell Signal: Generated when momentum is negative, the current close is lower than the previous close, and momentum is less than -ATR * threshold.
Plotting:
Buy signals are plotted as green triangles below the bars.
Sell signals are plotted as red triangles above the bars.
Momentum and ATR thresholds are plotted in a separate panel below the main chart.
Momentum is plotted as a blue line.
The ATR threshold lines are plotted as solid orange lines.
Indicator Benefits:
Momentum Measurement: Helps traders gauge the momentum of price movements.
Volatility Measurement: Utilizes ATR to measure market volatility, providing a more comprehensive analysis.
Visual Cues: Provides clear visual signals for buy and sell points, aiding in making informed trading decisions.
Justification of Component Combination:
Combining momentum with ATR provides a more robust measure of potential entry and exit points by considering both price movement and market volatility.
How Components Work Together:
The script calculates momentum and ATR for the specified periods.
It generates buy and sell signals based on the conditions of momentum and ATR.
The signals and values are plotted on the chart to provide a visual representation, helping traders identify potential trading opportunities.
Título: Indicador de Momentum com ATR e Volatilidade
Descrição em Português:
Este indicador combina o momentum do preço com a volatilidade do mercado para identificar pontos de entrada e saída em operações.
Utiliza a diferença entre os preços de fechamento (momentum) e o Average True Range (ATR) para medir a volatilidade. Sinais de compra e venda são gerados com base na combinação desses dois componentes.
Explicação Detalhada:
Configuração:
Comprimento do Momentum: Este parâmetro define o período para calcular o momentum, que é a diferença entre os preços de fechamento. O valor padrão é 10.
Comprimento do ATR: Este parâmetro define o período para calcular o Average True Range (ATR), que mede a volatilidade do mercado. O valor padrão é 14.
Limite do ATR: Este parâmetro define o multiplicador de limite para o ATR para gerar sinais de compra e venda. O valor padrão é 3.5.
Cálculo do Momentum:
O momentum é calculado como a diferença entre o preço de fechamento atual e o preço de fechamento momentum_length períodos atrás.
Cálculo do ATR:
O ATR é calculado com base no comprimento especificado e é usado para medir a volatilidade do mercado.
Sinais de Compra e Venda:
Sinal de Compra: Gerado quando o momentum é positivo, o fechamento atual é maior que o fechamento anterior, e o momentum é maior que ATR * threshold.
Sinal de Venda: Gerado quando o momentum é negativo, o fechamento atual é menor que o fechamento anterior, e o momentum é menor que -ATR * threshold.
Plotagem:
Sinais de compra são plotados como triângulos verdes abaixo das barras.
Sinais de venda são plotados como triângulos vermelhos acima das barras.
O momentum e os limites do ATR são plotados em um painel separado abaixo do gráfico principal.
O momentum é plotado como uma linha azul.
As linhas de limite do ATR são plotadas como linhas laranjas sólidas.
Benefícios do Indicador:
Medição do Momentum: Ajuda os traders a avaliar o momentum dos movimentos de preços.
Medição da Volatilidade: Utiliza o ATR para medir a volatilidade do mercado, proporcionando uma análise mais abrangente.
Sinais Visuais: Fornece sinais visuais claros para pontos de compra e venda, auxiliando na tomada de decisões informadas.
Justificação da Combinação de Componentes:
Combinar o momentum com o ATR fornece uma medida mais robusta de potenciais pontos de entrada e saída ao considerar tanto o movimento dos preços quanto a volatilidade do mercado.
Como os Componentes Funcionam Juntos:
O script calcula o momentum e o ATR para os períodos especificados.
Gera sinais de compra e venda com base nas condições de momentum e ATR.
Os sinais e valores são plotados no gráfico para fornecer uma representação visual, ajudando os traders a identificar oportunidades de negociação potenciais.

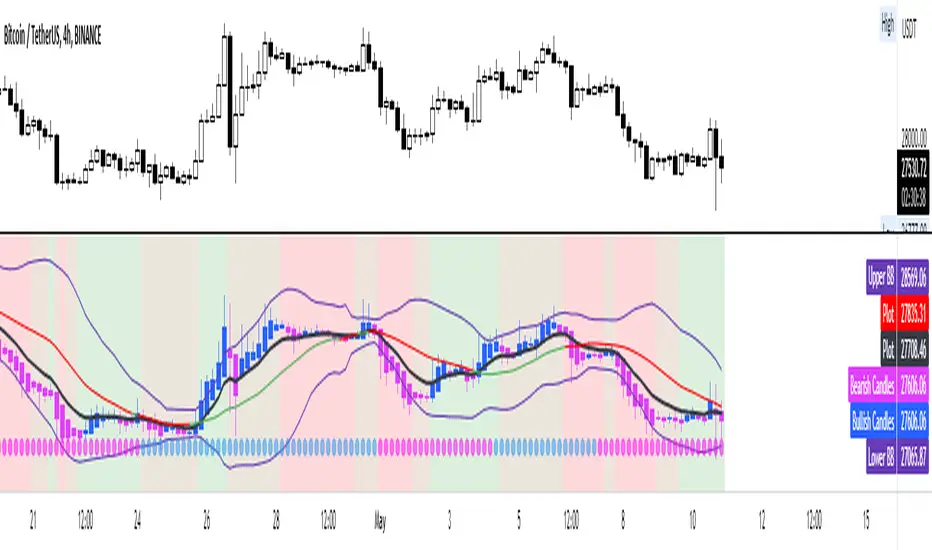
Heikin Ashi with EMA, BB, MomentumConvenient indicator to confirm a trend using heikin ashi candles.
The EMA 9 periods can be used as a trend confirmation using both the location of price and the slope of the EMA
Bollinger bands and their ma20 allows to account for volatility, range, squeeze, excess etc
This is all combined with a fast and slow momentum indicator based on the MACD.
The dots illustrate a slow/long-term momentum while the background color is the fast momentum.
Very useful indicator in my opinion to visualize the trend and momentum at the same time
Stockbee Momentum BurstThis is a script to color code bars based on the bullish- and bearish combination.
Bullish Combination
Percent: Price >= 4% from yesterday and Volume today > Yesterday
Dollar: Price >= 0.9 dollar from open
Base Requirements
- Price > Yesterday's close
- Price > Open
- Price is within 30% of high
- Todays price range >= Yesterdays price range
- Yesterday's move <= 2%
- Volume >= 100 000
Bearish Combination
Percent: Price <= 4% from yesterday and Volume today > Yesterday
Dollar: Price <= 0.9 dollar from open
Base Requirements
- Price < Yesterday's close
- Price < Open
- Price is within 30% of low
- Todays price range >= Yesterdays price range
- Yesterday's move >= -2%
- Minimum volume for each of last 3 days >= 100 000
Momentum Filter
These are based on the 10 and 20 EMA crossover, where the former above would indicate upward momentum and below downward momentum. This can help to narrow down the color code to continuation phases. The linked option will override all other momentum filters, bullish candles will be displayed when EMA 10 > 20 and bearish candles when EMA 10 < 20.

Dynamic Momentum EcosystemTo make emotions obsolete in trading/investing, traders must able to understand the overall trend and disregard with the short term fluctuations of the green and red candles formation. Generally, the moving averages identify the trend, while the MACD-Histogram and Volume measures momentum. As a result, the Impulse System combines trend following and momentum to identify tradable impulses. This unique indicator combination is color coded into the price bars for easy reference.
I've created a script that able help traders to do as such by removing noises and focusing on the momentum + trend. In this Momentum + Trend Following ecosystem, there are 4 colors:
Lime = Price closed higher + volume transacted higher than average + MACD Histogram increases + 13 EMA increases
Green = Price closed higher + MACD Histogram increases + 13 EMA increases
Red = Price closed lower + MACD Histogram decreases + 13 EMA decreases
Blue = Either MACD Histogram increases/decreases + 13 EMA increases/decreases
Lime candle is viewed as a robust bullish sign as price increases, supported by the rising MACD Histogram, 13EMA, and higher than average volumes transacted. Perfect for dip buying near the 20/50 MAs.
Green candle is viewed as bullish with the rising of MACD Histogram and EMA. Good for dip buying near the 20/50 MAs.
Red candle is viewed as bearish with the declining of MACD Histogram and EMA. Good for short entry. Can also be the early sign to take profits, as it could be the preliminary signal for trend reversal.
Blue candle is viewed as neutral.
The upper dotted purple line is the 52candles high.
The vertical grey line appears when the price > MA50 crosses above MA200, which is a golden crossover.
Traders are advised to time their entry using the impulse coloring system for stocks that are trading near the dotted line, following the grey line formation.
Another example, Zoom on daily timeframe (based on its 2020 great bullrun)
Another example, Hartalega on daily timeframe (based on its 2020 great bullrun)

Alpha Candle Breakout Signal on Momentum from Support Resistance
Hello traders,
Let’s start with a brief description of what this strategy/indicator is and what it does and how we trade based on Alpha Candles.
The definition of an Alpha Candle is that it is mathematically calculated, and significantly bigger than the previous candles. This could be a green candle or a red candle, as long as the body is significantly bigger than the previous candles at the end of the calculation. All calculations are done in real time, we do NOT paint the candle sticks after the close of the candle and do not use offset values. This is extremely important. You will see the candle changing it's color as the body of the candle gets bigger with real time data feed. (Recalculate On Every Tick is ON by default). Now besides the mathematical calculations, an Alpha Candle also represents the emotion in the market for that stock in that moment. We can also say that an Alpha Candle is a change in the momentum.
Now that we’ve identified the Alpha candle, the second step is, to have a look at the chart and identify if the Alpha candle is breaking to a new high / low from a consolidation period, or from a good chart pattern (ascending / descending triangle , pennant , sideways consolidation) or a sudden direction change of the stock (bounce). Remember, the script will paint all Alpha candles regardless.
NVAX day trading example
Forex
Crypto
PLUG (Bounce example)
The script will identify the Alpha candles that are breaking to a new high / low from a user input look back period (default is 20 bars back, but this can be changed by the user input). An Alpha candle that breaks the look back period, will have a stop loss line below for Green Alpha or above for Red Alpha Candle and reward targets, like target1 or target2 (both are user input fields, can be adjusted to personal R values, default values are 2R and 3R)
A 2R means two times the reward (profit) of a 1-unit risk. If you are comfortable of loosing $50 per trade which will be considered 1-unit, then 2R means $100 reward (profit) target and a 3R is $150 reward (profit) target. Those R values will be plotted and/or labelled on the chart with dollar amounts if desired. You can change your R values from the user input area, even with decimal points, like 2.5R or 3.75R. If you shoot for at least 2R, you could be wrong 6 times out of 10, and still make 2R profit, as long as the other 4 trades give you a total of 8R. This is a basic trading concept. It will force the new traders to focus on risk/reward rather then a gambling attitude.
The script is meant to work with candle stick chart patterns only, it is NOT meant to work with ranges, line charts or point and figure charts. It will work with time frames like (seconds,1,2,3,5,10 minute or any minutes, daily, weekly). If you are trading IPOs , there might not be enough data for the script to do the calculation, so just be aware.
The script will identify the candles if they are Green Alpha (going up, bullish ) or Red Alpha (going down, bearish ). In order to see them clearly, we’ve greyed out the rest of the candles, and made Green Alpha candles white, and Red Alphas are left as red. You can change the colors from the user input area.
There is also a look back period, between 1-55 and the initial value is 20 for Green Alpha and 10 for Red Alpha. So, if the Alpha Candle breaks this look back period, it will be considered as an opportunity to take the trade. The code will put the stop loss area, possible target1 and target2 areas with a blue diamond and will draw the resistance/support lines for that Alpha candle. Depending on the individual’s risk tolerance, a label on the right side of the screen will show the risk tolerance (user input value) and the number of shares to be traded based on the risk tolerance (# of shares will be for the last Alpha Candle that is formed, it will constantly update itself with the new Alpha Candle)
For those who might be familiar with the three-bar play, we implemented something similar, so the code will find them in real time. Once an Alpha Candle is formed, if the following candle is a very small candle, also called pin bar , it will be painted to orange, so you can see it clearly. This pin bar is significantly smaller than the previous candles and formed right after an Alpha Candle.
Like anything in life, nothing is free. Meaning you have to work for it. So if you are looking to buy/sell blindly based on some indicators and signals, please do not consider this script. However, once you start using it, you will see how patterns repeat, when they repeat and how they repeat. It will identify the action, but you have to check the validity from the charts, so user discretionary is advised. As an example, if the Alpha candle is breaking from a consolidation period at $10. Let’s assume stop loss is at $9 so the 2R target will be $12, but if there is a possible resistance at $11, then the trader has to decide to take the trade for a possible 1R return, or skip the trade.
We try to approach the trading as a set of rules and processing the trades one by one, with a calculated risk and reward. This script will give you the Candle stick formation that is worth consideration and will draw the Stop Loss area (you can tweak this to your liking), will draw the 2-3R Targets, and will calculate the number of shares to be purchased based on the Risk Tolerance user entered in the user input area. The rest is to let the trade take care of it self.
Charts and patterns work better, when there is enough volume in a particular stock. If the stock is trading very low in volume , things will not work as expected. So, we must focus on the abnormal stocks, like gap gainers, volume gainer stocks, or heavily traded stocks (for intraday trading). For swing or long-term traders, one could look for a Green Alpha candle, assess the risk and possible return and trade the plan on a daily chart pattern (long term), or 15,30,60 min charts for swing trades.
If you are looking to short a stock, look for stocks that are weak (gap downs), so look for Red Alpha formations in that stock.
Once the back testing is turned on, code will generate buy/sell signals, otherwise it will work as an indicator. But please keep in mind….. For day trading, the stock has to be abnormally trading, so the chart patterns and the Alpha Candles work correctly. Volume has to be more than usual. It is the best way to have predictable results for day trading. If the volume of the stock is 2-5 times or more than the average of 20 days period (early in the morning), and even more later in the day, it is a good indication that the stock is trading on an abnormal volume with some news (pre-market abnormality is a good sign for possible abnormality for that stock).
For back testing, user can select from the user input area :
• Long or Short Trades or both or use the script as an indicator
• Close any open position if an Alpha candle forms in the opposite direction
• Pyramid the trades up to 4 levels (allow to buy/sell 4 times in the same direction every time another Alpha Candle forms)
• Breakout/breakdown look back period (every time an Alpha Candle forms and breaks this look back period, it will be a trade opportunity)
• Target Reward areas
• Stop Loss area
• Time frame (change the time frame and observe which time frame made good profit. Test the plan for future trades. Test it in as many abnormal stocks for the day they were behaving abnormal as possible). Time frame is not a user input field, just the time frame of the chart, 2,5,10 min, 1 hour etc.
• Selective date testing (between two dates/times). This is very important as most of the good opportunities comes from abnormal price action with volume . If you back test with the maximum amount of data for that abnormal stock on that day, it will produce unrealistic results, because the stock will have a normal course of trend before the news. Remember, we are looking for stocks that are trading abnormal in both price and volume or stocks like AAPL , TSLA which are trading heavily on each day. It is also a good way to learn, how and when to buy/sell, where to put stop losses by observing the chart with the Alpha Candles showing the results.
• All the above values will have an impact on the total profit / loss.
F (Ford Motors)
Now that we’ve covered what the script does, let’s plan the trade and trade the plan.
Side Note:
-------------
We started coding this as an indicator to show the Alpha Candles to find opportunities in the market. Later in the development, we implemented it as a Strategy, to be able to back test the ideas, to tweak some rules for entry/exit and see the effects on our profit/loss percentages in general. We kept the original idea being an Indicator, to show us the Alpha Candles in real time. This requires the option “Indicator Mode” is to be selected from the User Input area, and leaving the “Recalculate On Every Tick” is selected from the Properties tab of the strategy (as of Pine Script v5). Strategy is turning this “On” by default.
Disclaimer: This script is an educational and personal use only tool and should be used accordingly. User can not publish any images created with this code. Do your own due diligence, do not buy / sell stocks based on any indicator, always use stop losses. We do not make any promises as this indicator or any indicator will make you a profitable trader. Trading and technical analysis is difficult, it takes time to build confidence and experience. Study the charts and candlestick formations. Study support/resistance areas and how to identify them. This will help you to tweak the script’s stop loss areas and 2R-3R targets. Do not invest any money you are not comfortable loosing.
This is an invite only strategy. We will give ample time to test it out. After that you will need to subscribe. To get access to this strategy trader can send me an email from the links below.
All the Best
Happy Trading

HFT Momentum BacktesterDefault Settings are meant to be used in XBT/USD chart on 1 hour time frame. If you want to use for another asset on another time frame YOU MUST CHANGE THE SETTINGS
This is momentum-based strategy designed by HFT Research in order to take advantage of volatile, trending markets.
Use ADX
ADX stands for average directional index . It is an indicator that measures volatility in the market. Unfortunately, the worst market condition for this strategy is sideways market. ADX becomes a useful tool since it can detect trend. If the volatility is low and there is no real price movement, ADX will pick that up and will not let you get in trades during a sideways market. It will allow you to enter trades only when the market is trending.
Use MA CrossOver
This strategy’s main driver is the moving average cross over however, unlike many other indicators, this strategy has ALL the moving averages that are on trading view. Total of 13 different moving averages all calculated in a different fashion available in a drop-down menu. You are able to choose two different moving averages to cross for your entry as well as being able to adjust the length of each individual moving average.
Use MA Spread % Filter
As an extra protection, we introduced MA spread % filter. We all know that momentum strategy works when there is actually a trend that has momentum. When there is no trend and market side choppy, we get a lot of noisy signals. In order to battle that we have introduced MA spread % filter. Using this piece of setting, you will be able to chose how strong the cross over actually is. If price is moving sideways, the moving averages will cross each other barely. If the price has actually any steam and momentum, MA 1 will cross over MA 2 aggressively because it will be trending market.
First you chose what the minimum % difference there should be between your 2 moving averages. If you keep this too tight, it won’t be as useful and if you keep this too large then the script will not generate any signals. Trust us, there is a fine balance in between! Then you proceed to chose your moving averages that the bot should keep track of.
Check our website for more information.
Backtest assumes the following;
You have 1000$ to trade
You use 1% of your capital on cross margin with 1% Stop Loss. Therefore, every trade has 100% equity effect on your balance and 1% stop loss has 1% loss effect
0.06% commission taking Binance as base. Please change commission if you are using another exchange.

HFT Momentum IndicatorDefault Settings are meant to be used in XBT/USD chart on 1 hour time frame. If you want to use for another asset on another time frame YOU MUST CHANGE THE SETTINGS
This is momentum-based strategy designed by HFT Research in order to take advantage of volatile, trending markets.
Use ADX
ADX stands for average directional index . It is an indicator that measures volatility in the market. Unfortunately, the worst market condition for this strategy is sideways market. ADX becomes a useful tool since it can detect trend. If the volatility is low and there is no real price movement, ADX will pick that up and will not let you get in trades during a sideways market. It will allow you to enter trades only when the market is trending.
Use MA CrossOver
This strategy’s main driver is the moving average cross over however, unlike many other indicators, this strategy has ALL the moving averages that are on trading view. Total of 13 different moving averages all calculated in a different fashion available in a drop-down menu. You are able to choose two different moving averages to cross for your entry as well as being able to adjust the length of each individual moving average.
Use MA Spread % Filter
As an extra protection, we introduced MA spread % filter. We all know that momentum strategy works when there is actually a trend that has momentum. When there is no trend and market side choppy, we get a lot of noisy signals. In order to battle that we have introduced MA spread % filter. Using this piece of setting, you will be able to chose how strong the cross over actually is. If price is moving sideways, the moving averages will cross each other barely. If the price has actually any steam and momentum, MA 1 will cross over MA 2 aggressively because it will be trending market.
First you chose what the minimum % difference there should be between your 2 moving averages. If you keep this too tight, it won’t be as useful and if you keep this too large then the script will not generate any signals. Trust us, there is a fine balance in between! Then you proceed to chose your moving averages that the bot should keep track of.
Check our website for more information.

Maxx Momentum + TTM SqueezeHi guys here is the new version of the Maxx Momentum. The Maxx Momentum shows when a trend may be losing strength and highlights squeezes with the direction they are likely to go. I have the colours made more predominant than the default I also am using the smooth momentum settings just below show histogram, see settings here = i.gyazo.com
Other things to look for are; is it squeezing and who has the momentum, is it with the bulls or bears ( white above or below orange).
Is there any divergence? If there is wait for the white to cross over the signal line and then start looking for the trade.
You can also use it to see where the current trend is, if it's above or below the zeroiline, and is the white (momentum) above or below the orange (signal line). I have been finding good success using it on the 4hr, but for the long term squeezes the daily and above seems to work quite well.
Feel free to mess around with the settings if you wish, I currently have is set to using a TEMA as the signal line.
If you have any questions drop them below or send me a message.

Anchored Momentum [LazyBear]Anchored Momentum (AMOM), by Rudy Stefenel, is a modified momentum indicator to capture the relative momentum. AMOM uses SMA as the reference for deriving momentum, thereby anchoring it to that MA rather than "value of close n bars back".
Mr.Stefenel suggests using this like other oscillators -- crossing signal line, crossing zero, divergences.
For alerts, use "Momentum", "Signal" and "ZeroLine" plots.
Configurable options:
- Momentum Period: Default is 10.
- Signal Period: Default is 8.
- Smooth Momentum: Default is FALSE. If TRUE, enables EMA(close) to be used rather than "close".
- Smoothing Period: Default is 7. If momentum smoothing is enabled, this period is used.
- Show Histogram: Default is FALSE. This is not histogram per se (indicator - signal), but is used for highlighting the crosses. Check out the histogram pane below to see an example.
- Enable Barcolors: Default is FALSE. If enabled, colors the price data (bars/candles) using histogram color.
More info:
Anchored Momentum, Stocks & Commodities V16:2 (89-98)
Complete list of all my indicators:
docs.google.com

Momentum TrackerMomentum Tracker - Advanced Multi-Timeframe Momentum Oscillator
Overview
The Momentum Tracker is a sophisticated momentum oscillator that employs a proprietary triple-layer exponential smoothing algorithm to measure market momentum with exceptional precision. This indicator transforms complex price movements into clear, actionable signals through an intuitive color-coded display system.
Key Features
• Advanced Calculation Engine
Triple-layer exponential smoothing for noise reduction
Proprietary momentum normalization algorithm
Oscillates smoothly between 0-100
• Multi-Timeframe Analysis (NEW!)
Analyze momentum from any timeframe on your current chart
Perfect for confirming higher timeframe trends on lower timeframe entries
Timeframe display badge for easy reference
• Dynamic Visual System
Blue: Rising momentum (bullish pressure)
Red: Falling momentum (bearish pressure)
Yellow: Neutral/consolidating (no clear direction)
• Reference Levels
90: Overbought zone
50: Equilibrium line
10: Oversold zone
• Professional Features
No repainting - uses only confirmed data
Works on all markets (Forex, Crypto, Stocks, Indices)
Compatible with all timeframes (1m to Monthly)
Clean, uncluttered display
How It Works
The Momentum Tracker uses a sophisticated multi-stage process:
Price Input: Calculates using typical price (HLC/3) for balanced market representation
Triple Smoothing: Applies three layers of adaptive exponential smoothing to filter market noise while preserving trend integrity
Momentum Normalization: Converts raw momentum into a bounded 0-100 oscillator
Dynamic Coloring: Instantly visualizes momentum direction through color changes
Trading Applications
1. Trend Identification
Blue line = Uptrend momentum
Red line = Downtrend momentum
Yellow line = Consolidation/indecision
2. Overbought/Oversold Conditions
Readings above 90 suggest overbought conditions
Readings below 10 suggest oversold conditions
Best used in conjunction with price action
3. Momentum Divergences
Spot regular and hidden divergences
Early warning of potential trend reversals
Confirmation tool for other signals
4. Multi-Timeframe Confirmation
View daily momentum on hourly charts
Confirm entry signals with higher timeframe momentum
Avoid trades against higher timeframe momentum
5. Entry/Exit Timing
Color changes can signal momentum shifts
Midline (50) crosses indicate trend bias changes
Extreme readings suggest potential reversal zones
Settings
• Timeframe: Select any timeframe for momentum calculation (leave empty for chart timeframe)
Best Practices
DO combine with price action and support/resistance levels
DO use multiple timeframe analysis for confirmation
DO wait for clear color changes before making decisions
DON'T use as a standalone trading system
DON'T trade solely based on overbought/oversold levels
DON'T ignore overall market context
Pro Tips
Divergence Trading: Look for momentum making lower highs while price makes higher highs (bearish divergence) or vice versa
Trend Following: Trade in the direction of the momentum color on higher timeframes
Range Trading: Use extreme readings (>90 or <10) for mean reversion trades in ranging markets
Confluence: Best signals occur when momentum aligns across multiple timeframes
Technical Details
Version: 6.0 (Pine Script v6)
Overlay: False (displays in separate pane)
Repainting: No
Calculation: Based on typical price (HLC/3)
Update Frequency: Real-time with each price tick
Risk Disclaimer
Trading financial instruments involves substantial risk and may result in loss of capital. This indicator is provided for informational and educational purposes only and should not be construed as investment advice. Always:
Use proper risk management
Updates
Latest Update: Added multi-timeframe functionality allowing momentum analysis from any timeframe on your current chart view.
Tags: #momentum #oscillator #trend #multitimeframe #norepaint #exponentialsmoothing #momentumindicator #technicalanalysis #trading #forex #crypto #stocks

ASI Momentum CloudASI Momentum Cloud (AMC) — a scaled Accumulative Swing Index (ASI) momentum indicator with an EMA cloud for visual trend context, signal smoothing, and configurable scaling for any instrument.
---
## Overview
The ASI Momentum Cloud visualizes ASI-based momentum while providing a three-EMA cloud that highlights trend bias and momentum strength. The indicator scales ASI values for better visibility across different instruments and adds an SMA signal line for entry/exit clarity. Designed for traders who want a momentum oscillator with trend context and simple alertable signals.
## Key features
* Scaled ASI value (`ASI Multiplier`) for improved chart readability.
* Configurable `Daily Limit` to adapt the ASI calculation to different asset volatilities.
* SMA signal line to smooth ASI and provide clear cross signals.
* Three-EMA cloud (Fast / Mid / Slow) to show bullish/bearish bias and momentum shifts.
* Lightweight, low-latency computation — suitable for multiple timeframes.
* Built-in cloud coloring: green tint when Fast EMA > Slow EMA, red tint otherwise.
## How it works (brief)
1. ASI is calculated each bar using price movement components (high/low/close relationships) and normalized by the `Daily Limit`.
2. `ASI Multiplier` scales the values for visual clarity.
3. A short SMA (`Period Length`) acts as the indicator’s signal/smoother.
4. Three EMAs (Fast / Mid / Slow) form a cloud — their relative positions determine the cloud color and trend bias.
## Inputs (as shown in settings)
* **Daily Limit** — numeric; adjusts ASI normalization (default: `10000`). Tune to instrument volatility.
* **ASI Multiplier** — numeric; scales the ASI for visibility (default: `100`).
* **Period Length** — SMA length for the signal line (default: `14`).
* **EMA Cloud Fast Length** — fast EMA (default: `7`).
* **EMA Cloud Mid Length** — middle EMA (default: `14`).
* **EMA Cloud Slow Length** — slow EMA (default: `28`).
## How to interpret signals
* **Bullish bias:** EMA Fast > EMA Slow → cloud green (favour long bias).
* **Bearish bias:** EMA Fast < EMA Slow → cloud red (favour short bias).
* **Momentum entry:** ASI line crossing **above** the Signal SMA — momentum turning positive.
* **Momentum exit / short entry:** ASI line crossing **below** the Signal SMA — momentum turning negative.
* **Confirmation:** Prefer entries that align with cloud bias (e.g., take long crossovers when cloud is green).
* **Divergence:** Watch for price making new highs/lows while ASI fails to confirm — possible momentum exhaustion.
## Suggested alert messages (copy/paste)
* `ASI Momentum Cloud — ASI crossed above Signal (potential buy)`
* `ASI Momentum Cloud — ASI crossed below Signal (potential sell)`
* `ASI Momentum Cloud — Cloud turned bullish (EMA Fast > EMA Slow)`
* `ASI Momentum Cloud — Cloud turned bearish (EMA Fast < EMA Slow)`
Use these messages in TradingView alert conditions tied to the corresponding cross or condition.
## Recommended usage & timeframes
* Works on any timeframe; commonly useful on 1H, 4H, Daily for trend-following, and lower timeframes for intra-day momentum signals.
* Adjust **Daily Limit** and **ASI Multiplier** for low-volatility instruments (smaller limit, higher multiplier) or high-volatility instruments (larger limit, lower multiplier).
* Combine with price action, support/resistance, or higher-timeframe trend for better signal quality.
## Notes & credits
* Version: 1.0 — initial release.
* If you adapt or redistribute, please credit the original script.
* Built for clarity and practical trading signals — tweak the input values to match your instrument and trading style.
## Risk disclaimer
This indicator is a technical tool and not investment advice. Backtest and paper-trade any strategy before using real capital. Use proper risk management.

Trend-Momentum Matrix [Pro]The Problem: Analysis Paralysis Traders often struggle to align multiple timeframe signals. You might see momentum on the 5-minute chart but fail to notice a major resistance on the 1-hour, or enter a trend just as it loses strength. Juggling multiple indicators (RSI, Moving Averages, ADX, Clouds) on a single chart creates clutter and confusion.
The Solution: Trend-Momentum Matrix The Trend-Momentum Matrix is a professional-grade dashboard that condenses complex market data into a single, high-contrast heatmap. It allows you to monitor the health of a trend across 7 distinct timeframes simultaneously—from scalping charts to long-term views—without cluttering your screen.
This tool is built on a "Strict Compliance" engine. It does not issue signals based on loose guesses; it waits for a high-probability confluence of three market forces: Price Structure, Momentum Velocity, and Trend Strength.
Core Capabilities
1. Dual-Engine Logic The system runs two independent strategies in parallel to catch both sides of the market:
Compounder Engine (Longs) : Identifies high-growth setups where momentum has entered a "Bullish Power Zone," supported by institutional trend strength.
Breakdown Engine (Shorts): Detects structural failures where momentum is accelerating downward and trend support has been breached.
2. The "Squint Test" Visualization Markets move fast. You shouldn't have to read numbers to know the trend. The Matrix utilizes a Heatmap Architecture:
Solid Green Row: Confirmed Bullish Confluence (Safe to Buy).
Solid Red Row: Confirmed Bearish Breakdown (Safe to Short).
Black/Mixed: Noise or Consolidation (Stay Out).
3. Advanced Noise Filtering: Most indicators fail in choppy markets. This tool uses a multi-layered filter:
Trend Strength (ADX) Filter: Signals are ignored if the prevailing trend is too weak or sideways.
Structure Lock: Signals are strictly gated by key moving averages. If the price structure isn't sound, the signal is suppressed.
4. Donchian Breakout Detection The matrix automatically tracks volatility breakouts. It monitors whether the current price action is expanding beyond historical volatility bands (Upper/Lower Donchian channels) to confirm true breakouts versus fake-outs.
Key Features
Multi-Timeframe Matrix: Monitor 7 timeframes (fully customizable with On/Off toggles) in one corner of your screen.
Auto-Adaptive Interface: The table uses a high-contrast Black background that remains clearly visible on both Light and Dark TradingView themes.
Smart Ribbon: Includes an optional, non-intrusive 8-line Moving Average Ribbon to visualize trend flow directly on the chart.
Strict Exit System: The system is designed to protect capital. The moment the specific conditions for Momentum or Structure are lost, the signal immediately converts to an EXIT or COVER command.
Risk Disclaimer: Trading involves substantial risk and is not suitable for every investor. This tool is an analysis aid and does not constitute financial advice. Past performance is not indicative of future results.
Access: This is an Invite-Only premium indicator. Please contact the author to request access.

Squeeze Go Momentum Pro [KingThies] █ OVERVIEW
The Squeeze Momentum Pro indicator identifies volatility compression phases and breakout opportunities by comparing Bollinger Bands to Keltner Channels. When price consolidates (squeeze), the bands contract inside the channels, signaling an imminent breakout. The momentum histogram shows directional bias, helping traders anticipate which way price will move when the squeeze releases.
This indicator displays in a separate panel below the price chart, providing clear visual signals without cluttering price action.
█ KEY FEATURES
Momentum Histogram
The histogram is the primary visual element, displaying momentum strength and direction with four distinct color states:
• Dark Green (#00C853) — Strong bullish momentum that is increasing. This signals strengthening upward pressure and potential continuation.
• Light Green (#26A69A) — Bullish momentum that is decreasing. Price remains in bullish territory but upward force is weakening.
• Dark Red (#D32F2F) — Strong bearish momentum that is increasing. This signals strengthening downward pressure and potential continuation.
• Light Red (#EF5350) — Bearish momentum that is decreasing. Price remains in bearish territory but downward force is weakening.
The color intensity provides immediate feedback on momentum strength and trend health.
Squeeze State Indicator
Colored dots on the zero line communicate the current volatility state:
• Orange Dots — Squeeze is ON. Bollinger Bands have contracted inside Keltner Channels, indicating consolidation and low volatility.
A breakout is building and traders should prepare for directional movement.
• Green Dots — Squeeze is OFF. Bollinger Bands have expanded outside Keltner Channels, indicating active momentum and higher volatility.
Price is moving with conviction in the current direction.
• Gray Dots — Neutral state. The bands are transitioning between squeeze states.
Release Triangles
Triangle shapes mark the exact bar when a squeeze releases, providing precise entry timing:
• Green Triangle Up — Bullish squeeze release. The squeeze has ended with positive momentum, suggesting a long setup opportunity.
• Red Triangle Down — Bearish squeeze release. The squeeze has ended with negative momentum, suggesting a short setup opportunity.
Information Panel
A compact dashboard in the top-right corner displays real-time trading intelligence:
• Squeeze Status — Current state: ON, OFF, or NEUTRAL with color coding
• Momentum Direction — Current bias: BULL or BEAR
• Momentum Value — Precise numerical reading of momentum strength
• Trading Signal — Actionable status: LONG SETUP, SHORT SETUP, WAIT, or MONITOR
Configurable Parameters
All calculation inputs are adjustable to match your trading style and timeframe:
• BB Length — Bollinger Bands period (default: 20)
• BB StdDev — Bollinger Bands standard deviation multiplier (default: 2.0)
• KC Length — Keltner Channels period (default: 20)
• KC ATR Multiplier — Keltner Channels range multiplier (default: 1.5)
• Momentum Length — Linear regression period for momentum calculation (default: 20)
Alert System
Four alert conditions notify you of critical trading opportunities:
• Bullish Squeeze Release — Squeeze has released with bullish momentum, indicating a potential long entry
• Bearish Squeeze Release — Squeeze has released with bearish momentum, indicating a potential short entry
• Squeeze Started — Volatility compression detected, prepare for upcoming breakout
• Squeeze Ended — Volatility expansion confirmed, breakout is active
█ TRADING METHODOLOGY
The indicator follows a clear four-step process for identifying and trading squeeze breakouts:
1 - Wait for Orange Dots . When orange dots appear on the zero line, a squeeze is building. This indicates price consolidation and declining volatility.
Do not enter trades during this phase. Instead, prepare by identifying key support and resistance levels and potential breakout directions.
2 - Watch for Release Triangle . When a triangle appears, the squeeze has released and a breakout is beginning. This is your entry signal.
The triangle color (green up or red down) combined with the histogram direction indicates the breakout direction.
3 - Confirm with Histogram Direction . Check the momentum histogram for directional confirmation:
• Green histogram + green triangle up = Go long. Bullish momentum supports upward breakout.
• Red histogram + red triangle down = Go short. Bearish momentum supports downward breakout.
4 - Monitor Momentum Intensity . Stay in the trade while histogram bars maintain their dark, intense color.
When colors lighten (dark green to light green, or dark red to light red), momentum is weakening and you should consider taking profits or tightening stops.
█ INTERPRETATION GUIDE
Squeeze Detection Logic
A squeeze occurs when Bollinger Bands contract inside Keltner Channels. This happens when:
• Standard deviation of price decreases (BB narrows)
• Price consolidates within a tight range
• Volatility compresses to unsustainable levels
The orange dots signal this condition, warning traders that explosive movement is imminent.
Squeeze Release Logic
A squeeze releases when Bollinger Bands expand outside Keltner Channels. This happens when:
• Price volatility increases sharply
• Price breaks out of consolidation
• Volume typically expands (check volume separately)
The green dots and release triangles signal this condition, indicating the direction and timing of the breakout.
Momentum Reading
The histogram uses linear regression to calculate momentum relative to the midpoint of the recent range:
• Above Zero : Price is trading above the range midpoint with bullish pressure
• Below Zero : Price is trading below the range midpoint with bearish pressure
• Increasing Bars : Momentum is strengthening in the current direction (darker color)
• Decreasing Bars : Momentum is weakening in the current direction (lighter color)
█ BEST PRACTICES
• Timeframe Selection — The indicator works on all timeframes but performs best on 15-minute to daily charts.
Lower timeframes may produce more false signals due to noise.
• Confluence Trading — Combine squeeze releases with support/resistance levels, trend lines, or other indicators for higher probability setups.
• Volume Confirmation — Check that squeeze releases occur with increasing volume. Low volume breakouts are more likely to fail.
• Multiple Timeframe Analysis — Check higher timeframes for overall trend direction. Trade squeeze releases that align with the larger trend.
• Parameter Adjustment — Increase BB and KC lengths for smoother signals on higher timeframes. Decrease for more sensitive signals on lower timeframes.
█ LIMITATIONS
• The indicator does not predict breakout direction before the squeeze releases. The momentum histogram provides bias but is not definitive until the breakout occurs.
• False breakouts can occur, particularly in choppy or low-volume market conditions. Always use proper risk management and stop losses.
• The indicator works best in trending markets. In deeply ranging markets with no clear direction, squeeze signals may be less reliable.
• Momentum calculations use linear regression which can lag during extremely fast price movements. Confirm signals with price action.
█ NOTES
This implementation uses linear regression for momentum calculation rather than simple moving averages, providing more responsive and accurate directional signals. The four-color histogram system gives traders nuanced feedback on momentum strength that binary color schemes cannot provide.
The indicator automatically adjusts to any symbol and timeframe without modification, making it suitable for stocks, forex, crypto, and futures markets.
█ CREDITS
Squeeze methodology inspired by John Carter's TTM Squeeze indicator. Momentum calculation and visual design optimized for modern trading workflows.
