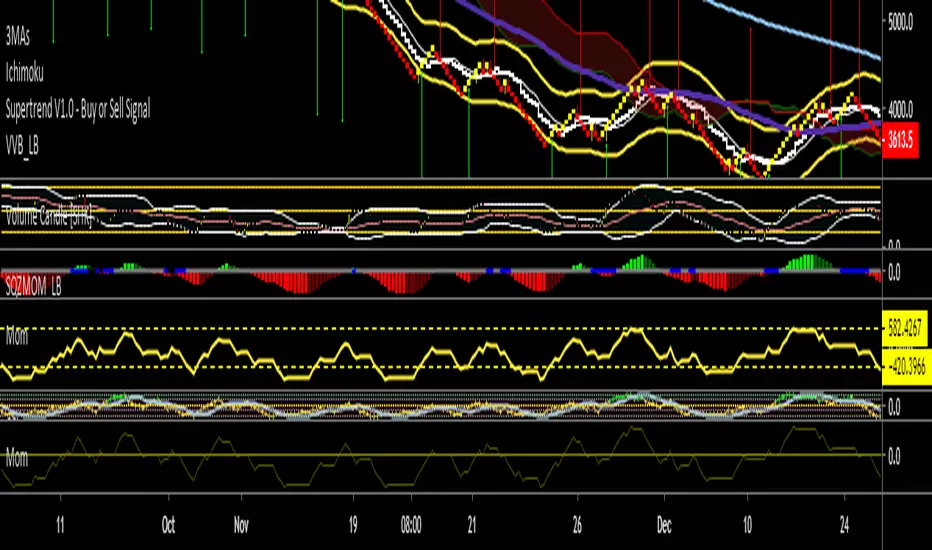
Wave Momentum StrategyWave Momentum Strategy is a momentum and cyclic based strategy. It uses the best indicators I've created in the past along with some other HPT (High Probability Trade) signals I developed to attempt to trade successfully at any time-frame. The primary underlying signal generator is the Wave Momentum Indicator which you'll also find on my profile. This indicator gets more accurate with time (larger timescale) and in general gives an excellent indication of overall market conditions (bullish, bearish, chop).
It works best with Futures because it doesn't fall victim to the gap open or the gap and drop as frequently. I have not tested with stocks/equities because I do not trade them regularly. I traded using this system for most of the past few years until I moved to an automated system I built in C#. It was one of at least 4 strategies I ran at anywhere from 5m to 1d intervals.
스크립트에서 "momentum"에 대해 찾기

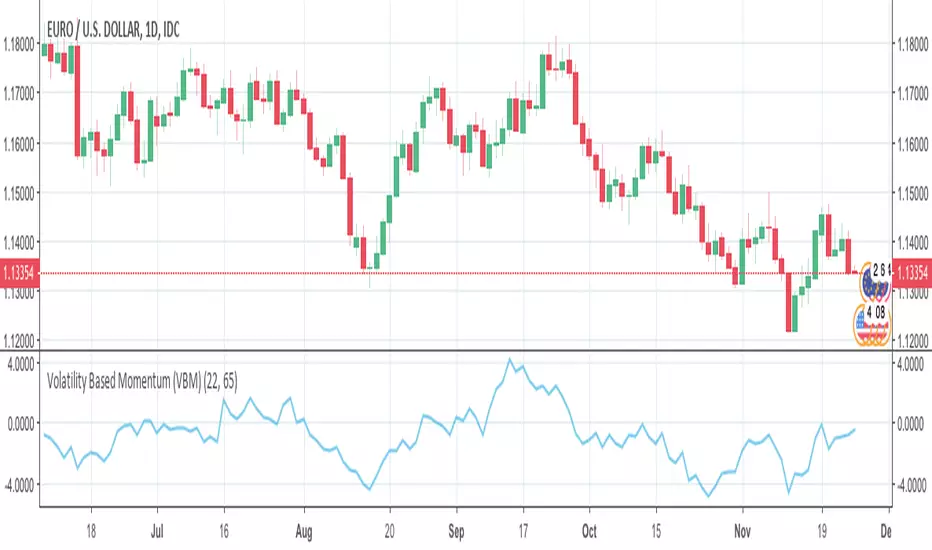
Volatility Based Momentum (VBM)The Volatility Based Momentum (VBM) indicator is a variation on the rate-of-change (ROC) indicator. Instead of expressing momentum in a percentage gain or loss, VBM normalizes momentum using the historical volatility of the underlying security.
The VBM indicator offers numerous benefits to traders who orient their trading around volatility. For these traders, VBM expresses momentum in a normalized, universally applicable ‘multiples of volatility’ (MoV) unit. Given the universal applicability of MoV, VBM is especially suited to traders whose trading incorporates numerous timeframes, different types of securities (e.g., stocks, Forex pairs), or the frequent comparison of momentum between multiple securities.
The calculation for a volatility based momentum (VBM) indicator is very similar to ROC, but divides by the security’s historical volatility instead. The average true range indicator (ATR) is used to compute historical volatility.
VBM(n,v) = (Close - Close n periods ago) / ATR(v periods)
For example, on a daily chart, VBM(22,65) calculates how many MoV price has increased or decreased over the last 22 trading days (approximately one calendar month). The second parameter is the number of periods to use with the ATR indicator to normalize the momentum in terms of volatility.
For more details, there is an article further describing VBM and its applicability versus ROC.
🥢Crypto-Sticks: Momentum 1.0 by Cryptorthyhms🥢 Crypto-Sticks™ Momentum
A new series of indicators brought to you by Cryptorthyhms...giving you an alternate look at your trusted favorites!
🚀 Indicator Specific Info
Momentum can be a tricky indicator sometimes. Since it doesnt go into predictable overbought or oversold zones, it rather just oscillates around zero - making it harder to create a signals strategy. On the default view I tend to look for 2 candle "flat tops" and "flat bottoms" with one or both containing a decent wick.
Heiken Ashi candles adds some more clear entry exit points which can be executed at the second candle going in either direction (applicable only to this chart on 4H - other coins/charts will require their own strategy). For instance, enter on 2nd green, exit on 2nd red.
Volume weighting the HA candles adds a different dimension to the indicator which I have to explore more fully. Please leave me any ideas or feedback you have!
🚫If using HA or VW+HA, the strategy about "flat candles" doesnt apply anymore.
🚀 Crypto-Sticks General Info
💭This series isnt polished 100%, and I have some more options I will add in the future. But for now, I want to just release them, as I am not sure when I will have the time to put more work into them (many other big projects I am working on).
📊Its basically reinterpretations of all your favorite indicators. I calculate the values a little bit differently than normal, but the end result is creating a candlestick chart (for the indicator!). Then I added the option to plot them as Heiken Ashi candles to smooth out noise and make signaling easier. Here's how it looks as Heiken Ashi:
🔊Lastly I implemented a Volume Weighting system for them all which simply integrates volume into the formulas for these indicators. For the most part this feature is experimental and doesn't provide huge utility (yet - I have other ways I want to try it as well - just no time). Though on some of the indicators it already shows great promise. Here is Volume Weighted + Heiken Ashi:
👍Enjoying this indicator or find it useful? Please give me a like and follow! There are many more indicators to be released in this series, not to mention I post crypto analysis and other free indicators regularly.
💬Questions? Comments? Want to get access to an entire suite of proven trading indicators? Come visit us on telegram and chat, or just soak up some knowledge. We make timely posts about the market, news, and strategy everyday. Our community isnt open only to subscribers - everyone is welcome to join.

Dynamic Momentum Index (DMI) Backtest This indicator plots Dynamic Momentum Index indicator. The Dynamic Momentum
Index (DMI) was developed by Tushar Chande and Stanley Kroll. The indicator
is covered in detail in their book The New Technical Trader.
The DMI is identical to Welles Wilder`s Relative Strength Index except the
number of periods is variable rather than fixed. The variability of the time
periods used in the DMI is controlled by the recent volatility of prices.
The more volatile the prices, the more sensitive the DMI is to price changes.
In other words, the DMI will use more time periods during quiet markets, and
less during active markets. The maximum time periods the DMI can reach is 30
and the minimum is 3. This calculation method is similar to the Variable
Moving Average, also developed by Tushar Chande.
The advantage of using a variable length time period when calculating the RSI
is that it overcomes the negative effects of smoothing, which often obscure short-term moves.
The volatility index used in controlling the time periods in the DMI is based
on a calculation using a five period standard deviation and a ten period average
of the standard deviation.
You can change long to short in the Input Settings
WARNING:
- For purpose educate only
- This script to change bars colors.

Momentum Fractal VolatilityThis is another modified macd combined with bollinger bands. The idea is to follow this with the momentum indicator I developed and just like when you look at cycle time frame and higher cycle time frame (Barry Burn), here you can see the higher momentum time frame (fractal energy, Barry Burn).
When the macd line goes above/bellow the bollinger band, it changes the color to green/red for easier identifying possible momentum exhaustion places and times.

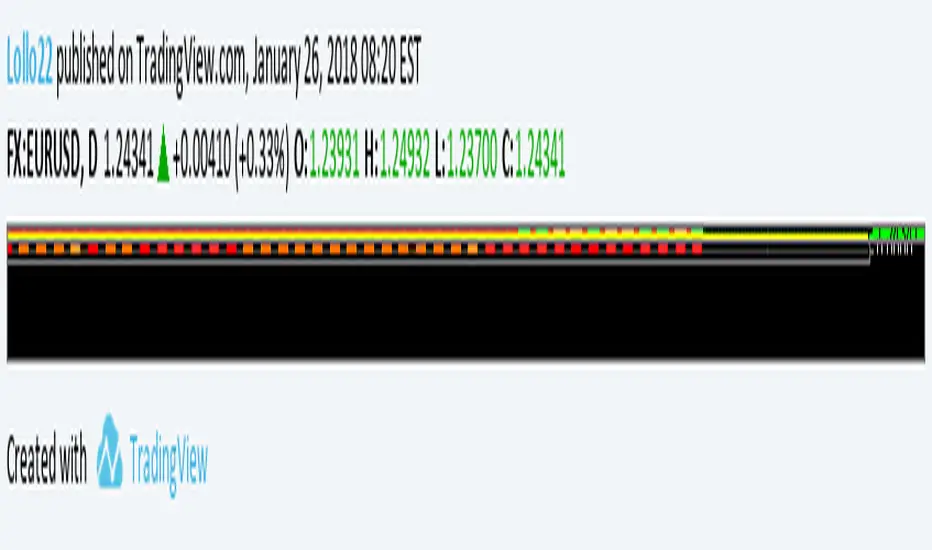
MOMENTUM + strong vs weak momentumThis is a unique custom indicator that shows the real momentum of a currency
With this indicator you can easily trade the strong vs the weak momentum
Each line is a currency pair
aqua= eur
yellow=dollar
purple= pound
green=australian dollar
white=yen
orange=canadian dollar
if the square has one of these colors it means moment UP for this currency
If the square is red it means momentum down for the related currency
The trading signal is at the change of color from previous square against one other currency with opposite color
You can access this indicator for a trial period, just ask for access in comments
Trading is a risky business, i'm not responsible for any profit or loss
rs_Chande's Momentum Oscilator - MMAChande's Momentum Oscilator, with added MA's for momentum strenght.

SuperTrend Momentum OscillatorOverview
The SuperTrend Momentum Oscillator (SMO) is a powerful technical analysis tool designed to identify trend direction and strength in financial markets. It combines short-term and long-term oscillator calculations to provide traders with a comprehensive view of market conditions through an intuitive candle-based visualization system.
Key Features
Dual-period oscillator system (short-term and long-term)
Candle-based visualization showing trend direction and alignment
Color-coded trend direction based on the main (slower) trend line
Candle size reflecting alignment between fast and slow components
High-confidence "Super" signals (green diamonds for buys, purple diamonds for sells)
Market liquidity insights through oscillator readings
Understanding the Candle Visualization
Main Trend vs. Fast Money
The SMO uses two key components that work together:
Main Trend Line (Slower): The longer-period oscillator that acts as the primary trend indicator
Dictates the overall color of the candles (green for uptrend, red for downtrend)
Represents the dominant market direction
Fast Line (Quicker): The shorter-period oscillator that reacts more quickly to price changes
Helps determine the size of candles through its alignment with the main trend
Represents "fast money" or shorter-term price reactions
Candle Components and Their Meaning
1. Candle Color
The color of each candle is determined by the direction of the main trend line:
Green Candles: Main trend line is rising (bullish)
Indicates an overall uptrend regardless of short-term fluctuations
Remains green even when the fast line temporarily moves against the trend
Red Candles: Main trend line is falling (bearish)
Indicates an overall downtrend regardless of short-term fluctuations
Remains red even when the fast line temporarily moves against the trend
2. Candle Body Size
The body size of each candle represents the alignment between fast and main trend lines:
Large Bodies: Both fast and main trend lines are moving in the same direction
Trading Action: Strong confirmation of the trend direction
Confidence Level: High confidence signals
Small Bodies: Fast line is moving against the main trend line
Trading Action: Exercise caution; potential for temporary pullback or consolidation
Confidence Level: Lower confidence in immediate continuation
3. Wick Length
Wicks (shadows) provide additional information about price rejection and volatility:
Long Wicks: Indicate price rejection and potential volatility
Trading Action: Be cautious of trend continuation when long wicks appear
Confidence Level: Reduced confidence in immediate trend continuation
Short Wicks: Indicate strong directional control with minimal rejection
Trading Action: More confidence in trend continuation
Confidence Level: Higher confidence in the current trend direction
Candle Patterns Over Time
The progression of candles provides valuable trend information:
Large Green Candles: Main trend is up and fast line confirms (strong bullish)
Trading Action: Consider entering or adding to long positions
Confidence Level: High confidence in uptrend
Small Green Candles: Main trend is up but fast line is moving down (caution in uptrend)
Trading Action: Hold existing long positions but wait before adding
Confidence Level: Moderate confidence in uptrend, possible short-term pullback
Large Red Candles: Main trend is down and fast line confirms (strong bearish)
Trading Action: Consider entering or adding to short positions
Confidence Level: High confidence in downtrend
Small Red Candles: Main trend is down but fast line is moving up (caution in downtrend)
Trading Action: Hold existing short positions but wait before adding
Confidence Level: Moderate confidence in downtrend, possible short-term bounce
Super Signals - High Confidence Trading Opportunities
The SMO focuses exclusively on high-confidence "Super" signals:
Green Diamond Super Buy Signals
Meaning: Both short-term and long-term oscillators are generating buy signals simultaneously
Visual Indicator: Green diamond markers at the bottom of the indicator (0 level)
Trading Action: Strong entry signal for long positions
Confidence Level: High confidence signal, especially when accompanied by large green candles
Purple Diamond Super Sell Signals
Meaning: Both short-term and long-term oscillators are generating sell signals simultaneously
Visual Indicator: Purple diamond markers at the top of the indicator (100 level)
Trading Action: Strong entry signal for short positions or exit signal for long positions
Confidence Level: High confidence signal, especially when accompanied by large red candles
Market Liquidity Concept
The SMO provides a unique perspective on market conditions that goes beyond traditional oscillator interpretations:
Low Oscillator Readings (Below 20)
When the oscillator shows low readings (below 20), this indicates:
Traditional interpretation: Market is oversold, potential for upward reversal
Liquidity interpretation: Insufficient money in the market
This suggests thin trading conditions where large orders may have outsized impact
Price movements may be more erratic and less predictable
Breakouts may lack follow-through due to insufficient participation
High Oscillator Readings (Above 80)
When the oscillator shows high readings (above 80), this indicates:
Traditional interpretation: Market is overbought, potential for downward reversal
Liquidity interpretation: Abundant money in the market
This suggests deep trading conditions with high participation
Price movements tend to be more orderly and trend-based
Breakouts may have stronger follow-through due to high participation
Trading Strategies with SMO
Strategy 1: Main Trend with Alignment Confirmation
This strategy uses the main trend direction with alignment confirmation:
Entry Criteria:
Main trend direction is established (green or red candles)
Fast line aligns with main trend (large candles)
Super signal confirms (green or purple diamond)
Exit Criteria:
For long positions: When candles turn red or Super Sell signal appears
For short positions: When candles turn green or Super Buy signal appears
Stop Loss Placement:
For long positions: Below recent swing low
For short positions: Above recent swing high
Strategy 2: Counter-Trend Opportunity Detection
This strategy identifies potential counter-trend opportunities:
Entry Criteria:
Small candles appear (indicating disagreement between fast and main trend lines)
Oscillator reaches extreme levels (above 80 or below 20)
Wait for candle color change before entering
Position Sizing:
Use smaller position sizes for counter-trend trades
Increase size only when main trend confirms the new direction
Exit Criteria:
Take profit at the first sign of alignment in the opposite direction
Use tighter stops than with trend-following trades
Strategy 3: Market Liquidity Strategy
This strategy incorporates the market liquidity concept:
For Low Liquidity Conditions (Readings below 20):
Wait for Super Buy signals (green diamond)
Use smaller position sizes
Be prepared for potentially erratic price movements
Look for signs of increasing liquidity (expanding candle bodies) before adding to positions
For High Liquidity Conditions (Readings above 80):
Consider holding positions longer despite "overbought" readings
Use trailing stops to capture extended moves
Be aware that trends may persist longer than expected
Practical Trading Scenarios
Scenario 1: Strong Trend Confirmation
Candle Pattern: Series of large green candles (main trend up, fast line confirms)
Signal: Green diamond Super Buy marker at the bottom (0 level)
Background: Intensifying green gradient
Action: Enter long position with confidence
Stop Loss: Below recent swing low
Take Profit: When candles become small or turn red
Scenario 2: Trend Weakening Detection
Candle Pattern: Green candles becoming smaller (main trend still up, but fast line diverging)
Signal: No new signals
Background: Fading green gradient
Action: Tighten stops on long positions, prepare for potential reversal
Reasoning: Fast money is starting to move against the main trend
Scenario 3: Trend Reversal Identification
Candle Pattern: Transition from small green candles to red candles (main trend changing)
Signal: Appearance of purple diamond Super Sell marker at the top (100 level)
Background: Changing from green to red gradient
Action: Exit long positions and potentially enter short positions
Timing: Most effective when reversal occurs near overbought (80) level

QaSH Momentum EntriesThis script implements a variation of the Rob Hoffman's Inventory Retracement strategy, with entries being triggered by inventory retracement candles. Various confirmation parameters are available, such as
EMA slope for momentum confirmation
multi-timeframe EMA
multi-timeframe Ehler's mother of all moving averages
volume confirmation
Position management tools include
up to 3 orders can be tracked simultaneously and independently as a method of pyramiding into and out of a position
unique order ID's that pass along into the alert message (for helping the automation service manage positions)
entry filters based on current position profit
entry filters based on entry frequency
trade timers that can end a position after a specified amount of time
moving the stoploss when in profit
various parameters can be passed along into the alerts

Visual Squeeze MomentumSqueeze Momentum from LazyBear now visible at the chart so you can check when the Squeeze its about to release. All credits for him.

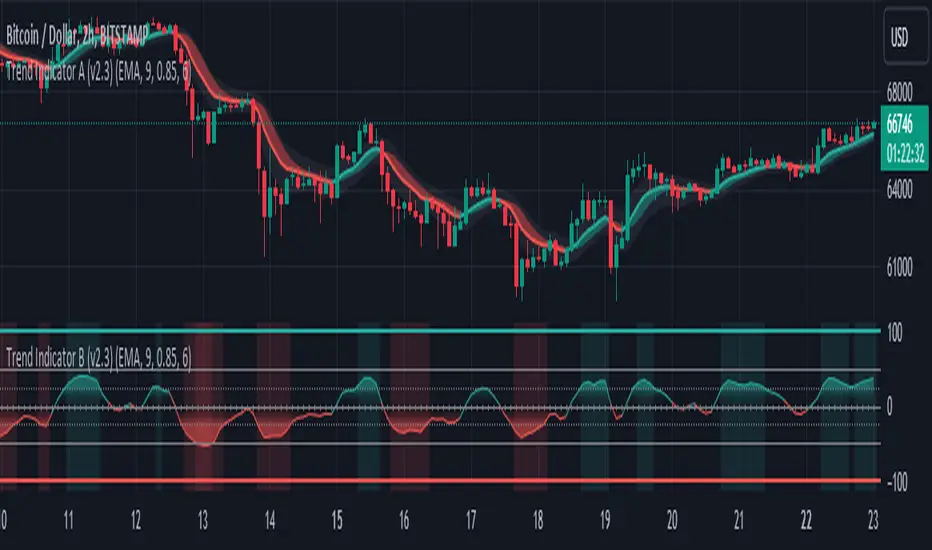
Trend Indicator B-V2 (Momentum measuring)"Trend Indicator A-V2" and "Trend Indicator B-V2" are updated and improved versions of my initial trend indicators. Totally rethinking the code, adding highs and lows in the calculations, including some more customisation through colour schemes.
In practice, this indicator uses EMAs and Heikin Ashi to provide an overall idea of the trend.
The "Trend Indicator A-V2" is an overlay showing “Smoothed Heikin Ashi” .
The "Trend Indicator B-V2" uses the same values in a different way to measure the momentum of the trend and identify potential trend rejections.
Please, take into account that it is a lagging indicator.

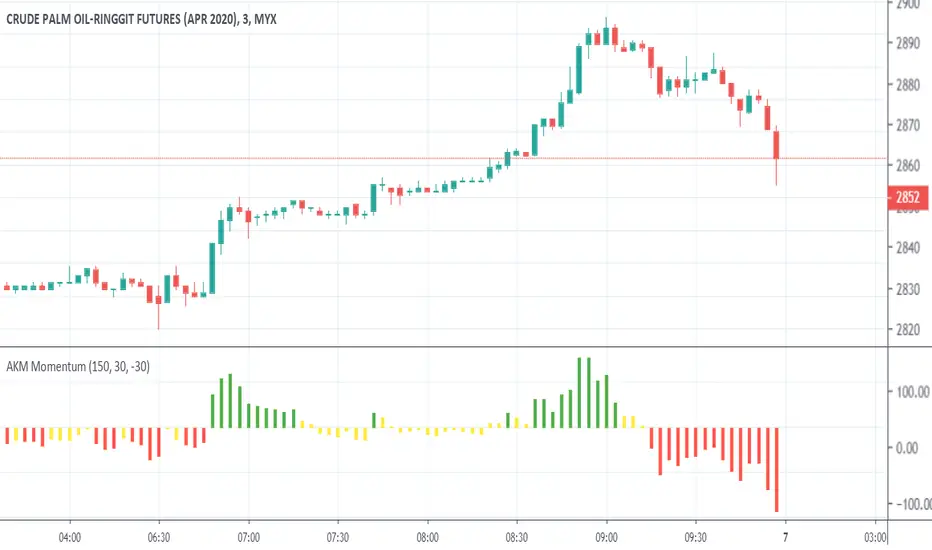
AKM MomentumAKM Momentum
Rekomendasi
FCPO
Timeframe Value LM Upper Value LM Bottom
3M 30 -30
15M 50 -50
Wave Momentumthankyou to the original author of this script Vkn422
Very simple , shows momentum and changes candle colors to match
You only short when negative
you only long when positive
Must have confluence with other forms of analysis like Elliott Wave
This indicator was built with EW in mind and would excel in the hands of those who practice the wave analysis.


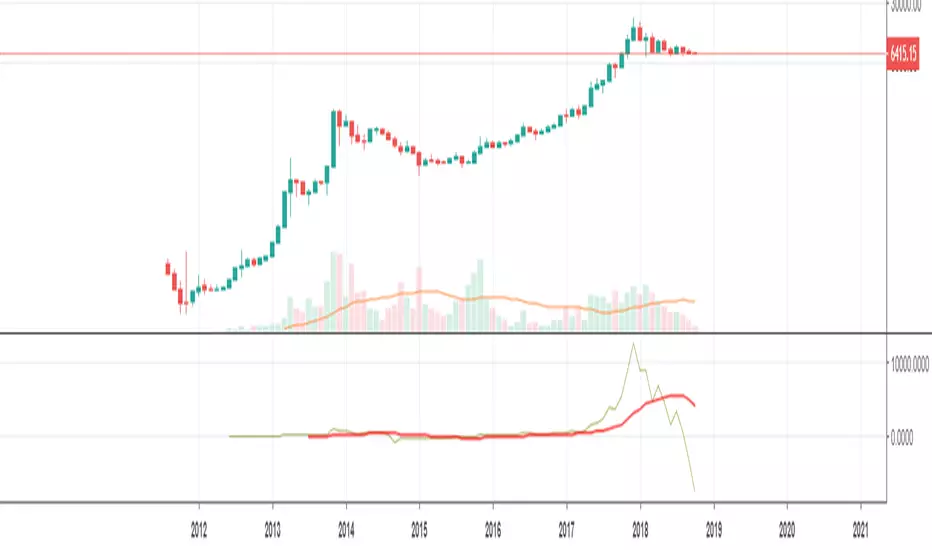

Log MomentumJust like regular momentum indicator except calculated in log space and with a horizontal line centered at zero for easier analysis


[RS]Leading Momentum Oscilator V0EXPERIMENTAL: Momentum oscilator based on offset, can also be used for divergence/convergence
