AlphaMACD - Adaptive MACD with Efficiency RatioOVERVIEW
AlphaMACD is an adaptive implementation of the classic MACD indicator that dynamically adjusts its calculation periods based on market efficiency. Unlike traditional MACD which uses fixed periods (typically 12, 26, 9), this indicator adapts its fast and slow EMA periods in real-time based on how efficiently the market is trending.
WHAT MAKES THIS ORIGINAL
This is not a simple MACD with different settings or colors. The core innovation is the adaptive period calculation using Kaufman's Efficiency Ratio, which was originally developed for the Adaptive Moving Average (AMA). This indicator applies that adaptive logic to MACD itself.
Key Differences from Standard MACD:
- Periods dynamically adjust between user-defined ranges (default: 8-21 for fast, 21-55 for slow)
- Uses Kaufman's Efficiency Ratio to measure market trendiness
- Implements gap protection to prevent extreme spikes from market gaps
- Includes market regime detection to filter signals in choppy conditions
- Provides multi-timeframe trend confirmation
HOW IT WORKS
1. Efficiency Ratio Calculation:
The indicator calculates market efficiency by comparing the absolute price change over a period to the sum of absolute price changes within that period. High efficiency = strong trending market. Low efficiency = choppy/sideways market.
2. Adaptive Period Adjustment:
- In trending markets (high efficiency): Periods move toward the minimum values for faster response
- In choppy markets (low efficiency): Periods move toward the maximum values for slower, more stable signals
- The "Sensitivity" parameter controls how aggressively periods adapt (0.5 to 5.0)
3. Gap Protection:
The custom adaptive EMA function detects abnormal price gaps (moves larger than 3x the typical ATR-based change) and limits their impact on the calculation. This prevents weekends or news gaps from causing extreme MACD spikes.
4. Signal Quality Filtering:
- Market regime detection identifies trending vs sideways conditions
- Momentum filter (RSI-based) prevents signals during overextended moves
- Signal strength calculation helps identify high-confidence setups
- Sideways market signals are marked with warning symbols
5. Multi-Timeframe Analysis:
The indicator compares current timeframe MACD with a higher timeframe (default 60 min) to provide context and filter against-trend signals.
HOW TO USE IT
Settings:
- Core Settings: Define the minimum and maximum periods for fast/slow EMAs
- Sensitivity: Higher values make the indicator more responsive to market changes
- Multi-timeframe: Set a higher timeframe for trend confirmation
- Visual options: Customize appearance and enable/disable features
Signal Interpretation:
- Strong bullish/bearish signals (large triangles): High-confidence entries in trending markets
- Warning signals (small ⚠): Crossovers in sideways markets - use caution or skip
- Divergence labels ("DIV"): Price and MACD diverging - potential reversal
- Background color: Green tint = trending market, Orange tint = sideways market
The Information Table shows:
- Current market regime (trending or sideways)
- Market efficiency percentage (how clean the trend is)
- Current adaptive fast and slow periods
- Higher timeframe trend direction
- Current signal strength
Best Practices:
- In trending markets: Trust strong signals, avoid warning signals
- In sideways markets: Reduce position sizes or skip trades entirely
- Use higher timeframe confirmation for better signal quality
- Adjust sensitivity based on your trading timeframe (higher for intraday, lower for swing)
TECHNICAL DETAILS
Calculation Method:
- Efficiency Ratio = ABS(Close - Close ) / SUM(ABS(Close - Close ), Period)
- Smoothed Efficiency = EMA(Efficiency Ratio, 5)
- Fast Period = Fast_Min + (Fast_Max - Fast_Min) × (1 - Smoothed_Efficiency × Sensitivity)
- Slow Period = Slow_Min + (Slow_Max - Slow_Min) × (1 - Smoothed_Efficiency × Sensitivity)
- Adaptive EMA uses standard EMA formula with gap detection and limiting
- MACD = Fast Adaptive EMA - Slow Adaptive EMA
- Signal = EMA(MACD, Signal Period)
- Histogram = MACD - Signal
The adaptive periods are calculated on every bar, so the MACD responds faster in trending conditions and stabilizes during consolidation.
WHAT THIS SOLVES
Standard MACD Problems:
- Fixed periods don't adapt to changing market conditions
- Too many false signals in sideways markets
- Whipsaws during low-volatility consolidation
- Price gaps can cause misleading spikes
AlphaMACD Solutions:
- Periods automatically adjust to market state
- Market regime filter identifies and warns about sideways conditions
- Adaptive smoothing reduces whipsaws
- Gap protection prevents false extremes
LIMITATIONS
- Like all indicators, this does not predict the future
- Requires trending markets for optimal performance
- Adaptive calculation means backtesting results will differ from fixed-period MACD
- More complex than standard MACD - requires understanding of adaptive concepts
- The adaptive periods mean you cannot directly compare this to traditional MACD studies
This indicator is best used as part of a complete trading system, not as a standalone signal generator.
EDUCATIONAL VALUE
For traders learning about:
- Adaptive indicators and market efficiency concepts
- Kaufman's Adaptive Moving Average principles applied to oscillators
- Market regime detection and signal filtering
- Gap handling in technical indicators
- Multi-timeframe analysis integration
Not Financial advice.
스크립트에서 "macd"에 대해 찾기

MACD Forecast [Titans_Invest]MACD Forecast — The Future of MACD in Trading
The MACD has always been one of the most powerful tools in technical analysis.
But what if you could see where it’s going, instead of just reacting to what has already happened?
Introducing MACD Forecast — the natural evolution of the MACD Full , now taken to the next level. It’s the world’s first MACD designed not only to analyze the present but also to predict the future behavior of momentum.
By combining the classic MACD structure with projections powered by Linear Regression, this indicator gives traders an anticipatory, predictive view, redefining what’s possible in technical analysis.
Forget lagging indicators.
This is the smartest, most advanced, and most accurate MACD ever created.
🍟 WHY MACD FORECAST IS REVOLUTIONARY
Unlike the traditional MACD, which only reflects current and past price dynamics, the MACD Forecast uses regression-based projection models to anticipate where the MACD line, signal line, and histogram are heading.
This means traders can:
• See MACD crossovers before they happen.
• Spot trend reversals earlier than most.
• Gain an unprecedented timing advantage in both discretionary and automated trading.
In other words: this indicator lets you trade ahead of time.
🔮 FORECAST ENGINE — POWERED BY LINEAR REGRESSION
At its core, the MACD Forecast integrates Linear Regression (ta.linreg) to project the MACD’s future behavior with exceptional accuracy.
Projection Modes:
• Flat Projection: Assumes trend continuity at the current level.
• LinReg Projection: Applies linear regression across N periods to mathematically forecast momentum shifts.
This dual system offers both a conservative and adaptive view of market direction.
📐 ACCURACY WITH FULL CUSTOMIZATION
Just like the MACD Full, this new version comes with 20 customizable buy-entry conditions and 20 sell-entry conditions — now enhanced with forecast-based rules that anticipate crossovers and trend reversals.
You’re not just reacting — you’re strategizing ahead of time.
⯁ HOW TO USE MACD FORECAST❓
The MACD Forecast is built on the same foundation as the classic MACD, but with predictive capabilities.
Step 1 — Spot Predicted Crossovers:
Watch for forecasted bullish or bearish crossovers. These signals anticipate when the MACD line will cross the signal line in the future, letting you prepare trades before the move.
Step 2 — Confirm with Histogram Projection:
Use the projected histogram to validate momentum direction. A rising histogram signals strengthening bullish momentum, while a falling projection points to weakening or bearish conditions.
Step 3 — Combine with Multi-Timeframe Analysis:
Use forecasts across multiple timeframes to confirm signal strength (e.g., a 1h forecast aligned with a 4h forecast).
Step 4 — Set Entry Conditions & Automation:
Customize your buy/sell rules with the 20 forecast-based conditions and enable automation for bots or alerts.
Step 5 — Trade Ahead of the Market:
By preparing for future momentum shifts instead of reacting to the past, you’ll always stay one step ahead of lagging traders.
🤖 BUILT FOR AUTOMATION AND BOTS 🤖
Whether for manual trading, quantitative strategies, or advanced algorithms, the MACD Forecast was designed to integrate seamlessly with automated systems.
With predictive logic at its core, your strategies can finally react to what’s coming, not just what already happened.
🥇 WHY THIS INDICATOR IS UNIQUE 🥇
• World’s first MACD with Linear Regression Forecasting
• Predictive Crossovers (before they appear on the chart)
• Maximum flexibility with Long & Short combinations — 20+ fully configurable conditions for tailor-made strategies
• Fully automatable for quantitative systems and advanced bots
This isn’t just an update.
It’s the final evolution of the MACD.
______________________________________________________
🔹 CONDITIONS TO BUY 📈
______________________________________________________
• Signal Validity: The signal will remain valid for X bars .
• Signal Sequence: Configurable as AND or OR .
🔹 MACD > Signal Smoothing
🔹 MACD < Signal Smoothing
🔹 Histogram > 0
🔹 Histogram < 0
🔹 Histogram Positive
🔹 Histogram Negative
🔹 MACD > 0
🔹 MACD < 0
🔹 Signal > 0
🔹 Signal < 0
🔹 MACD > Histogram
🔹 MACD < Histogram
🔹 Signal > Histogram
🔹 Signal < Histogram
🔹 MACD (Crossover) Signal
🔹 MACD (Crossunder) Signal
🔹 MACD (Crossover) 0
🔹 MACD (Crossunder) 0
🔹 Signal (Crossover) 0
🔹 Signal (Crossunder) 0
🔮 MACD (Crossover) Signal Forecast
🔮 MACD (Crossunder) Signal Forecast
______________________________________________________
______________________________________________________
🔸 CONDITIONS TO SELL 📉
______________________________________________________
• Signal Validity: The signal will remain valid for X bars .
• Signal Sequence: Configurable as AND or OR .
🔸 MACD > Signal Smoothing
🔸 MACD < Signal Smoothing
🔸 Histogram > 0
🔸 Histogram < 0
🔸 Histogram Positive
🔸 Histogram Negative
🔸 MACD > 0
🔸 MACD < 0
🔸 Signal > 0
🔸 Signal < 0
🔸 MACD > Histogram
🔸 MACD < Histogram
🔸 Signal > Histogram
🔸 Signal < Histogram
🔸 MACD (Crossover) Signal
🔸 MACD (Crossunder) Signal
🔸 MACD (Crossover) 0
🔸 MACD (Crossunder) 0
🔸 Signal (Crossover) 0
🔸 Signal (Crossunder) 0
🔮 MACD (Crossover) Signal Forecast
🔮 MACD (Crossunder) Signal Forecast
______________________________________________________
______________________________________________________
🔮 Linear Regression Function 🔮
______________________________________________________
• Our indicator includes MACD forecasts powered by linear regression.
Forecast Types:
• Flat: Assumes prices will stay the same.
• Linreg: Makes a 'Linear Regression' forecast for n periods.
Technical Information:
• Function: ta.linreg()
Parameters:
• source: Source price series.
• length: Number of bars (period).
• offset : Offset.
• return: Linear regression curve.
______________________________________________________
______________________________________________________
⯁ UNIQUE FEATURES
______________________________________________________
Linear Regression: (Forecast)
Signal Validity: The signal will remain valid for X bars
Signal Sequence: Configurable as AND/OR
Table of Conditions: BUY/SELL
Conditions Label: BUY/SELL
Plot Labels in the graph above: BUY/SELL
Automate & Monitor Signals/Alerts: BUY/SELL
Linear Regression (Forecast)
Signal Validity: The signal will remain valid for X bars
Signal Sequence: Configurable as AND/OR
Table of Conditions: BUY/SELL
Conditions Label: BUY/SELL
Plot Labels in the graph above: BUY/SELL
Automate & Monitor Signals/Alerts: BUY/SELL
______________________________________________________
📜 SCRIPT : MACD Forecast
🎴 Art by : @Titans_Invest & @DiFlip
👨💻 Dev by : @Titans_Invest & @DiFlip
🎑 Titans Invest — The Wizards Without Gloves 🧤
✨ Enjoy!
______________________________________________________
o Mission 🗺
• Inspire Traders to manifest Magic in the Market.
o Vision 𐓏
• To elevate collective Energy 𐓷𐓏
🎗️ In memory of João Guilherme — your light will live on forever.

RedK K-MACD : a MACD with some more musclesMoving Averages are probably the most commonly used analysis tools, and MACD is possibly the first charting indicator a trader gets to learn about.
MACD Basic concept
----------------------------
Without repeating all the tons of documentation about what MACD does, let's quickly re-visit the MACD concept from a 10-mile altitude (note we're keen on simplifying here rather than being technically accurate - so please forgive the use of any "common lingos")
- MACD goal is to represent the distance between 2 Moving Averages (MAs) - one fast and one slow, relatively - as an unrestricted zero-based oscillator.
- The value of the main MACD line is the distance, or the displacement between the 2 MA's
- usually a signal line is used (which is another MA of that distance value) to enable better visualization of the change (and rate of change, since this is all depicted on a time axis) of that displacement - this represents price momentum (price movement in the recent period versus movements for a relatively longer period).
- the difference between the main MACD line and its signal is then represented as a histogram above and below the zero line. in this case, that histogram is really redundant, since it shows a value that is already represented visually by the main line and its signal line.
How K-MACD is different
---------------------------------
K-MACD takes that simple concept of the classic MACD and expands around it - the idea is to use the same simple approach to representing price momentum while bringing in more insight to price moves in the short, medium and long terms, ability to represent more than 2 MA's and to enable better identification of tradeable patterns (like Volatility Contraction and others) - while still keeping things simple and visually clean.
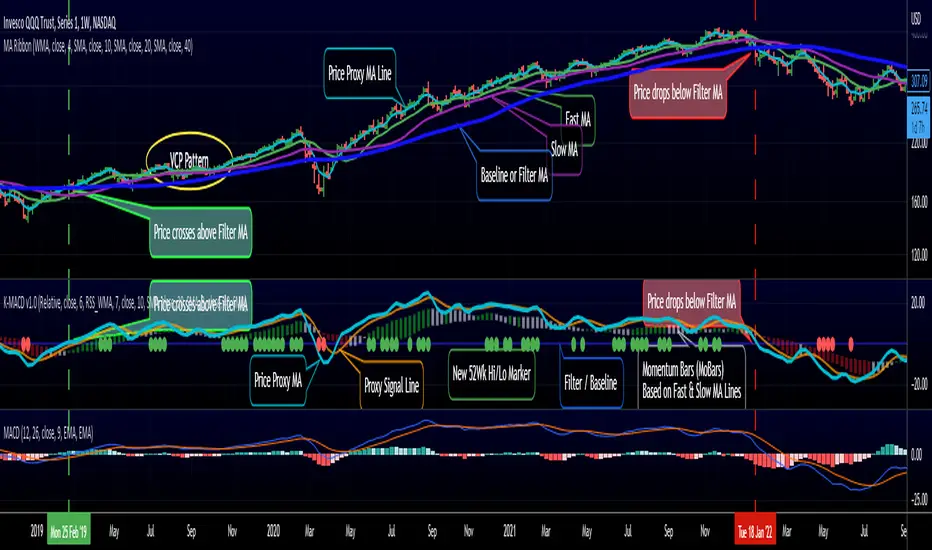
K-MACD is an indicator that allows us to view how price moves against 3 moving averages: a fast / slow pair, and a "market" Filter or Baseline (very long) that will be used as a flag for Bear/Bull market mode. Many traders and trading literature use the 200 day (40 week) SMA as that key filter
so in total, there are 4 MA lines in K-MACD (excluding the "orange" signal line):
* Price Proxy: Which is a very fast moving average that will represent the price itself - let's use a WMA(3) or something close to that here - there will be a signal line to enable better visualization of this similar to a classic MACD - that's the orange line
* Fast & Slow MA's : Use whatever represents the "medium term" momentum for your trading - Some traders use 20 and 50, others use 10 and 20 .. if on your price chart, you keep using a pair of MA's for this, use the same settings in K-MACD - these will be represented by the 3-color Momentum Bars that fluctuate above and below the baseline
* Filter/Baseline MA: Should be your long (Bullish/Bearish Mode) MA. so 100 or 200 or any other value you consider your market to be bearish below and bullish above. on K-MACD this is actually the blue zero line - everything else is "relative" to it
Review the sample chart which explains various elements and the "price chart" setup that K-MACD represents. With K-MACD you can clean up your chart from those various Moving Averages - or use a different set than the ones you already have K-MACD represent - or other indicators (like ATR channels..etc)
Other "muscles" in the K-MACD
---------------------------------------------
- Relative vs Classic Calculation Mode
A key issue with the classic MACD is that the displacement between the 2 moving averages is represented as "absolute or direct" values - as the price of the underlying increases with time, you can't really use these values to make useful comparison between the past and now (see below example) - also you can't use them to compare 2 different instruments.
- The "Relative" calculation option in K-MACD addresses that issue by relating all "distances" to the Baseline MA as percentage (above or below) - you can see this clear when you look at the above chart the far left versus the far right and compare K-MACD with the classic MACD - the Classic option is still available
- More MA "type" options for all MA lines: choose between SMA, EMA, WMA, and RSS_WMA (which i use a lot in my trading and is my default for the Price Proxy)
- More Alerts: a total or 9 alerts (in 3 groups) are available with K-MACD (Momentum above or below baseline, Price Proxy crossing signal line, and Price Proxy crossing baseline)
- New 52 week High / Low markers: These will show as Green/red circles on the zero line in K-MACD. this will only work for 1D timeframe and above, i'm just using a simple approach and would like to keep it that way.
- i know i added some more features not covered above :) -- if you have questions about any of the settings, feel free to ask below
Closing thoughts
-------------------------
K-MACD is a combination of couple of indicators i published in the past (xMACD and Mo_Bars) - so you can go back and read about them if needed - I then added improvements to accommodate ideas from swing trading literature and common practices that i plan to focus on in future. So K-MACD is really part of my own trading setup.
I assume here that most traders are familiar with what a MACD is - so kept this post short - if you thing we should expand more about the concepts covered here let me know in the comments - i can make some separate posts with examples and more details.
I hope many fellow traders find this work useful - and feel free let me know in comments below if you do.
MACD Divergence low repaintjiuc:
jiuc:
This MACD Divergence indicator can show your more acurrate divergence. It won't show you the divergence if the signal lines or MACD lines had crossed the zero line during the price get lower lower and macd get higher higher etc.
Used two range to calculate divergence. which can provide more divergence signals.

3C MACD & RSI Scalper no repaintThis is not a set and forget strategy. It needs constant tweaking to maintain a high winrate. Also what works on one pair can be horrible on another.
This strategy works best on the 1 min or 5 min TF but also works well on the 15 min. Haven't done any testing in higher TF's as im only interested in scalping.
If enabled you can retrive data on the MACD and RSI from any timeframe.
The strategy do not repaint.
You can filter on sessions as well as days. Often trading during say only the EU times and not trading during weekends yields better results. This is because weekeds and eg. the Asia Sessions are alot less volatile.
You do not need a 3c subscription to run this strategy as the bot turns on and off the bot itself.
Instructions for the 3commas connector:
1. First, you need to prepare 3commas Long/Short bots that will only listen to custom TV signals.
2. Inputs for the 3commas bot can be found at the end of the user inputs.
3. Once you have entered the required details into the inputs, turn on 3commas comments. They should appear on the chart (looks messy).
4. Now you can add the alert where you should paste the 3commas Webhook URL: 3commas.io
5. For the alert message text insert the placeholder {{strategy.order.comment}} and delete the rest. 6. Once the alert is saved, you can turn off those 3commas comments to have a clearer chart.
7. With a new alert, the bot and trade should launch.
Long or Short trades are determined with a crossing of the fast MA over the slow MA for Long and the opposite for Short. Trades should only happen close to the crossovers.
You can select from various different MA's and of course lenghts. I often find that using HEMA as the fast MA and DEMA as the slow give more trades while also maintaining a high winrate.
Then for Long we use the MACD indicator where we look for high peaks in negative values for Long and vice versa for Shorts. These should be significantly higher than other peaks (or if you will lower peaks for a Long).
The key is to detect high peaks on the histogram, which we will try to achieve by checking if the last 2 values were higher than X bars back. If you want to make it even more specific, then you can turn on the additional checkbox which compares the current value to the average value of X bars back, and if it is greater than, say, 72% the value of the average then it's ok to enter the trade.
The RSI filter, sets the maximum RSI threshold for a long position and the minimum for a short. By default and what i recomend is that you enter Longs when RSI is above 50 and shorts when RSI are below 50.
-You can set confirmation of the trade direction with RSI, i.e. for Long the RSI must rise a specified number of bars back, vice versa for Short.
Enabling the pullback filter is great to avoid Longing tops and Shorting bottoms.
Whats ahead. I really want to incorporate RSI divergencies, but haven't figured out how yet. Any other ideas would be greatly appreciated.
Have a look at my other strategies. They are similar to this but works abit differently.
The 3 strike line and the engulfing candles are not something that has an impact on the script yet, and might never be. But i do like to turn them on for a visual to see if the trade the strategy opened is a good one.

Vision Essentials - MACDVision Essentials - MACD is the second indicator in our Essentials pack. It's a fully customizable MACD indicator with some extra perks the Vision team feels provides helpful & simplified insight when studying a chart.
What makes this indicator different?
Under the Standard mode you'll feel right at home compared to a standard macd indicator. Our Advanced mode is where things change a bit more. Under Advanced mode outside of the visual customization we provide visual outputs identifying bullish/bearish crossovers of the macd & signal, and track the high and low points of the macd with a second set of colors which users can customize. We also plot text in these areas so there's a clear indication of what the changing colors mean.
How do I use this indicator?
To start, it's best you have an understanding of what MACD (moving average convergence divergence) is. There are lots of great educational ideas here on TradingView which we recommend absorbing. We highly recommend you start with this article directly from the TradingView Help Center
Settings
MACD Mode - Standard provides you with a closer to traditional style MACD whereas Advanced at a glance highlights areas such as crossover points, highs, lows, and current direction relative to histogram movement.
MACD Settings - Select the source & values used for the macd calculations. close is the most commonly used source, and 12/26/9 are the most common length values. Adjust these to see how the indicator behaves. Lowering the fast and slow values will result in more activity, but be aware that doesn't = more accuracy.
Standard Visual Settings - STANDARD MODE: These settings will adjust the color you want to use as an indication of bullish & bearish movement.
Advanced Visual Settings - ADVANCED MODE: Use these settings to adjust the color you want to use as an indication of bullish, bearish, recent macd highs, recent macd lows, and text color.
High/Low Distance - ADVANCED MODE: This setting defines how far back the indicator looks to find the most recent highs/lows of macd.
Enable Crossover Bars - ADVANCED MODE: This settings enables the vertical bars that connect the center of the histogram to the macd/signal "wave" to indicate where crossovers are happening.

[Sidders] MACDEMASAR IndicatorCame across a cool idea for a strategy that couldn't find in the indicator database, so decided to code it up myself for your pleasure.
Indicators consists of 3 indicators: EMA(200) to determine the overall trend, and the MACD & Parabolic SAR to determine entries (and exits).
Long entry contains 4 conditions and is generated when price is above the 200EMA (1), the MACD crosses above the signal line (2), while they are both below 0 line (3) and when the parabolic SAR is below the closing price of the bar (4).
Short entry is build up the same but in reverse: price is below the 200EMA(1), signal line crosses below the MACD line (2), while they are both above the 0 line (3) and when the parabolic SAR is above the closing price of the bar (4).
Place the stoploss on the parabolic SAR dot below/above the candle that created the signal. Profit target 1:1 risk:reward ratio, but can ofcourse be changed according to your risk apetite. Might add automatically drawn SL/TPs in a later update.
Concept behind the strategy should work on all timeframes, but will require proper backtesting. I think with additional filters the strategy can also be way more finetuned and profitable, personally haven't had the time yet to dive into that.
Have also added alerts for your convenience.
Enjoy!

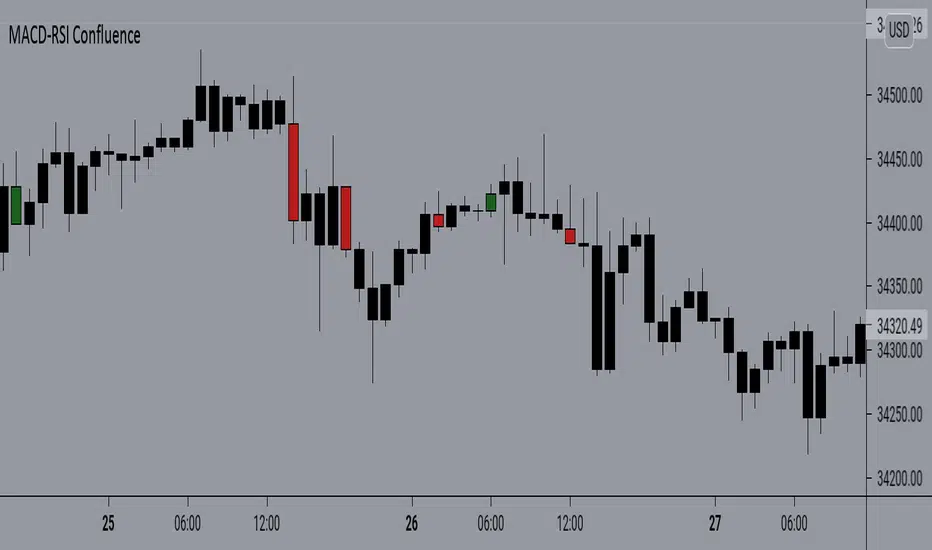
MACD-RSI Confluence SimplifiedAnother simple version of the MACD RSi Confluence script. But this is one is more simplified with simple signals. Again to fully understand macd & RSI you should already have some type of knowledge of how they work. With understanding this script & it's signals are great for those who do. This script is based on Barcolor signals reflected by macd & RSI data
Double Exponential MACDA modification of the classic MACD to use Double EMAs which tends to have less lag than the standard indicator.
Alert conditions are pre-configured for simple line crosses and you can enable/disable the histogram from the indicator options menu.
Enjoy!

[SCL] MACD DoubleCrossCounts crosses of the MACD and signal lines and derives entry signals. The code for counting the crosses, for deciding what counts as "close enough", and for auto-adjusting for resolutions 1D or longer, might be useful for Pinescripters. The entries and exits themselves are not intended to be used on their own, but could be used as confluence within a trading system. Full explanation is in the script introduction.
EVWMA VWAP MACD Strategy [QuantNomad]Based on comment of @coondawg71 I tried to compare VWAP and EVWMA.
Both are sort of moving averages so I decided to create a MACD based on these 2 indicators.
In parameters you can set EVWMA Length and 2 smoothing lengths for "macd" and "signal".
Strategy seems to work pretty good at 2h-8h timeframes for crypto.
What do you thing about it?

Zero Lag MACD [ChuckBanger]This is an MACD indicator with the ability to use zeror lag moving average instead of exponential moving average. I also added different background color when histogram is over or under center line, MACD Leader, Laguerre filter and dots to indicate when Leader line crosses macd line. Good luck traders!
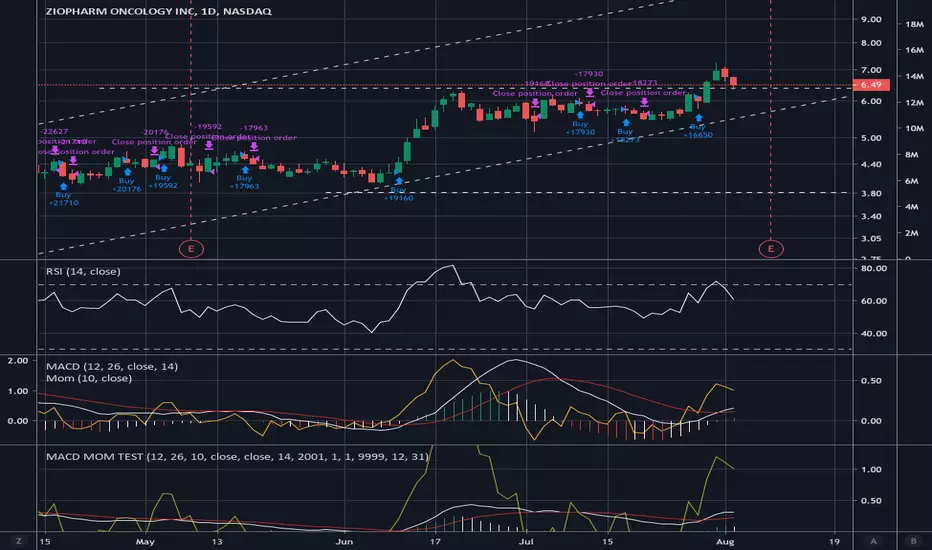
MACD MOMENTUM STRATEGYHey,
First of I'm not so familiar with Pine Editor, yet.
But a do need some help with a trick thing I*ve been working on.
As you can see I*ve merge the MACD and the MOMENTUM indicators in the same "chart" this have been working pretty well for me as a trading strategy. But now a chat tho create a real strategy with Pine Editor based on the same data. The thing is that I can't seem tho get the MOMENTUM indicator to and the MACD indicator in the same (different) scale in my strategy as when I merge them.
I suspect this got something to do with my chose of source för the MOMENTUM indicator, but I'm not 100.
I would be grateful for all kinds of feedback and tips for a solutions on this.
Thanks.

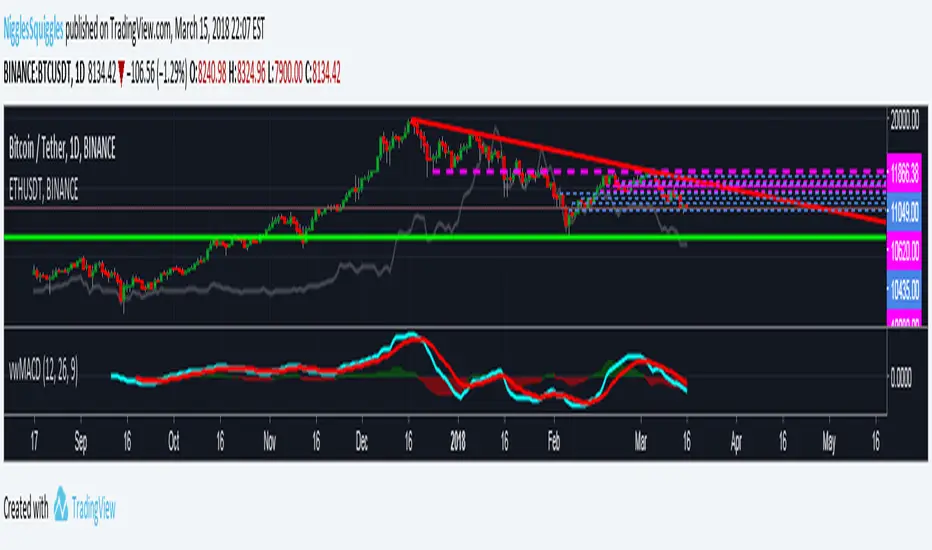
VW-MACDHello traders!
I am reading "Investing with Volume Analysis: Identify, Follow, and Profit from Trends" by Buff Pelz Dormeier so I am going to implement all indicators that are considered there.
VW-MACD was developed by Buff Pelz Dormeier in 2000 and is based on the difference between a short-term volume-weighted moving average and a long-term volume-weighted moving average. The signal line is traditionally left as an exponential moving average.
Like and follow for more cool indicators!
Happy Trading!


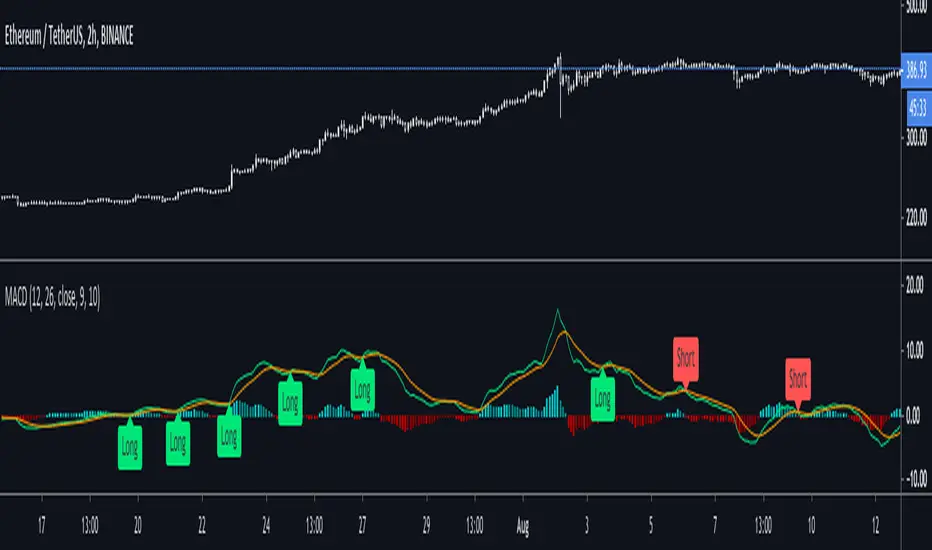
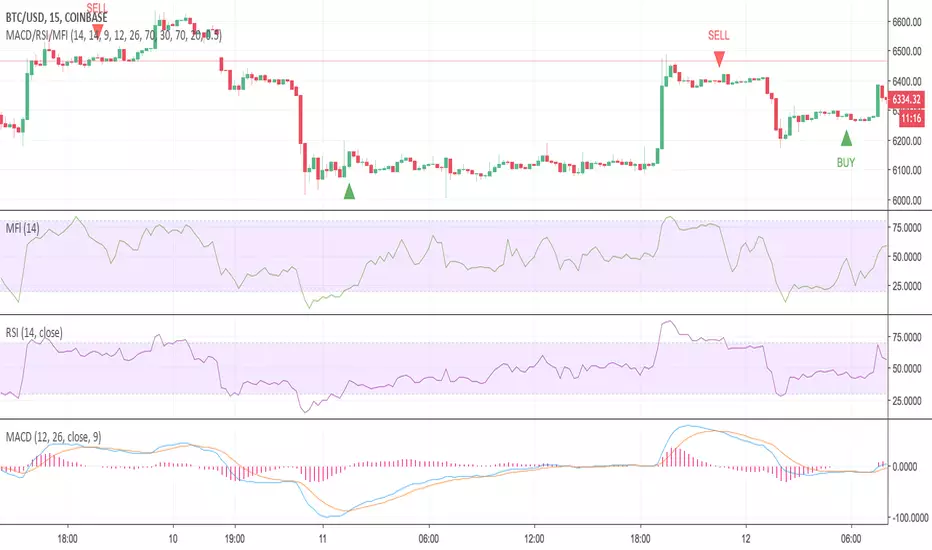
MACD/RSI/MFI with AlertsThis indicator allows you to trade RSI and MFI oversold and overbought zones with MACD confirmation. It is also possible to take an early trade by checking the " delta " (difference between the fast MACD line and the signal line) (histogram) value of the MACD.
Buy Condition
Both RSI and MFI must be in the oversold area
After that, wait for a MACD crossover
Note: At the time of MACD crossover, RSI and MFI might not still be in the oversold area. The indicator knows that they were both in the oversold area, and then waits for a MACD crossover to happen to confirm an uptrend.
Sell Condition
Both RSI and MFI must be in the overbought area
After that, wait for a MACD cross-under
Note: At the time of MACD cross-under, RSI and MFI might not still be in the overbought area. The indicator knows that they were both in the overbought area, and then waits for a MACD cross-under to happen to confirm a downtrend.
Inputs
MFI Length: Length of the Money Flow Index
RSI Length: Length of the RSI
MACD Length: Length of the MACD
MACD Fast Length: Fast Length of the MACD
MACD Slow Length: Slow Length of the MACD
RSI Overbought: Overbought boundary of the RSI
RSI Oversold: Oversold boundary of the RSI
MFI Overbought: Overbought boundary of the MFI
MFI Oversold: Oversold boundary of the MFI
Use delta to trade early?: Use this if you want to take a trade early by checking the MACD histogram
Delta: Absolute value of the MACD histogram. Whenever the "MACD Histogram" is less than the given "delta", a trade will be triggered if possible
Feel free to ask any questions you have.
Please report any bugs you found, with a screenshot of the chart. You can leave a comment or send me a DM.
Volume Weighted MACDThis is just like the normal MACD indicator, except that the values are Volume Weighted and the Histogram changes colour depending on the positive or negative value
Multi-Functional Fisher Transform MTF with MACDL TRIGGERWhat this indicator gives you is a true signal when price is exhausted and ready for a fast turnaround. Fisher Transform is set for multi-time frame and also allows the user to change the length. This way a user can compare two or more time spans and lengths to look for these MACDL divergent triggers after a Fisher exhaustion. With so many indicators, it's probably best to merge these indicators and change the Fisher and Trigger colors so you can still have a look at price action (remember to scale right after merger). I've noticed from time to time when you have Fisher 34 100 and 300 up and running on two different time frames such as 5 and 15 min charts, with MACDL triggers on the 100/300 or 34/100 you get a high probability trade trigger. However, there are rare exceptions such as when price moves in a parabolic state up or down for a long period where this indication does not work. Ideally this indicator works best in a sideways market or slow rising/descending moving market.
This indicator was worked on by Glaz, nmike and myself
LazyBear also introduced the MACDL indicator

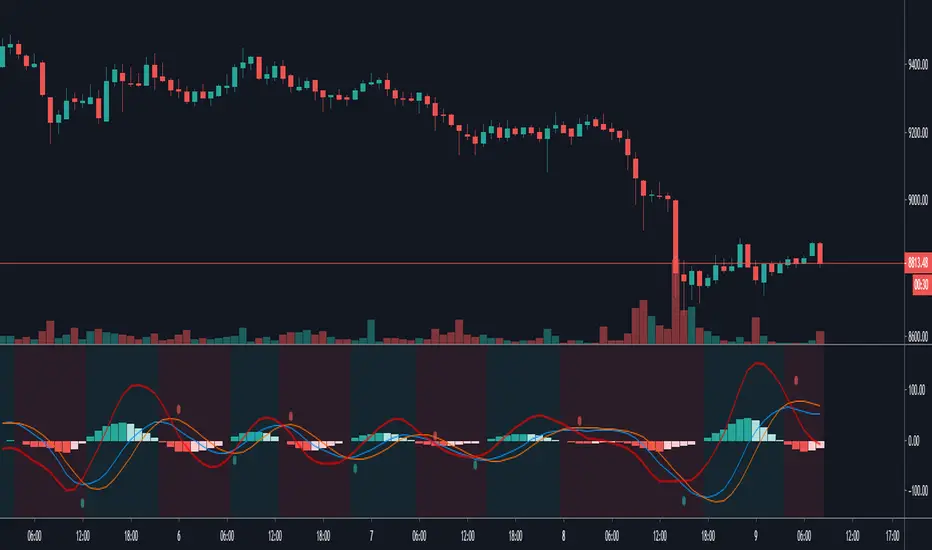
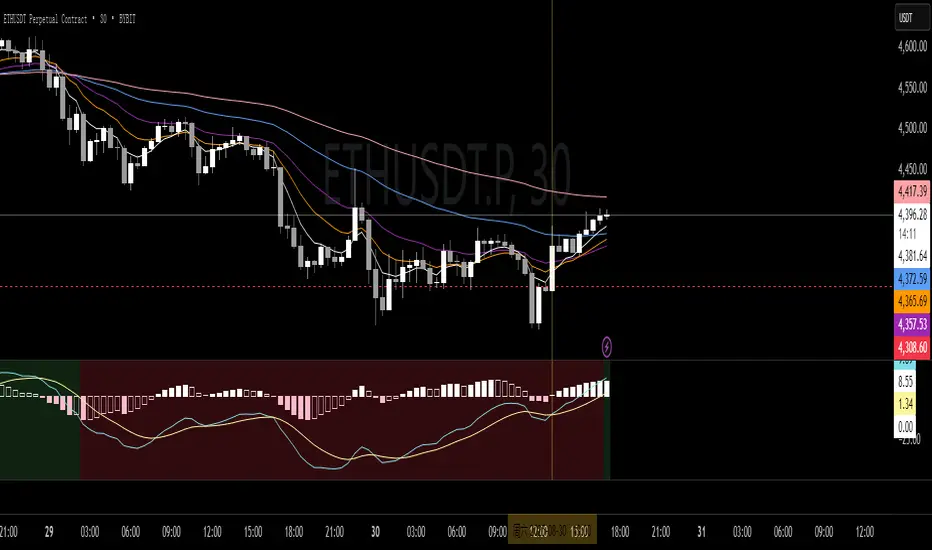
MIT MACD • Filled/Hollow Momentum HistogramThe MIT MACD • Filled/Hollow Momentum Histogram is an enhanced version of the classic MACD.
- Dual-style histogram (filled for acceleration, hollow for deceleration).
- Customizable colors for bars, MACD/Signal lines, and background.
- Background highlight when the slow line crosses the zero-line.
- Fully adjustable parameters, keeping TradingView defaults.
此脚本是经典 MACD 的进阶版,支持实心/空心动能柱体,零轴背景高亮,参数与配色可自由调整,更直观捕捉趋势与动能变化。
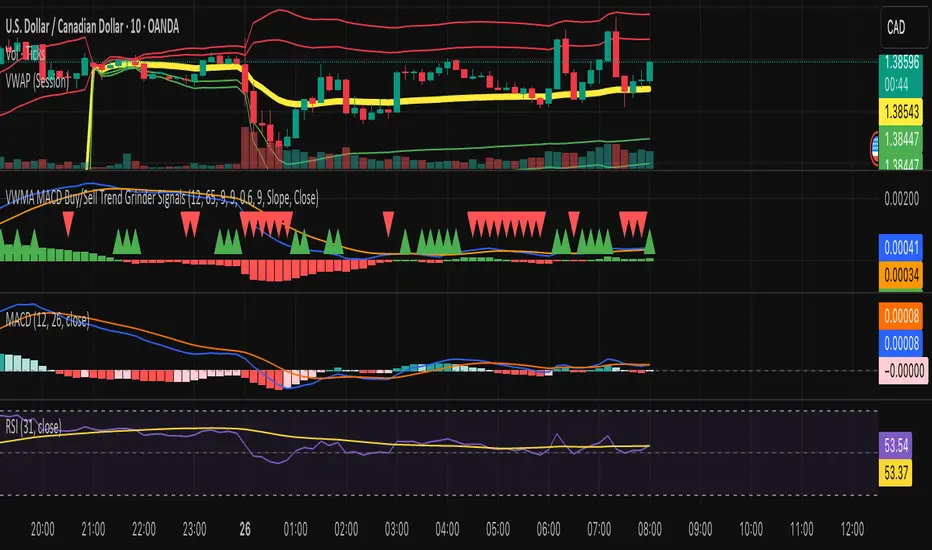
VWMA MACD Trend Grinder Buy/Sell SignalsDescription:
This indicator combines a VWMA-based MACD with volume and trend filters to reduce false buy and sell signals.
It is designed to give more reliable entry and exit points in trending markets while avoiding low-volume noise.
Features:
1. VWMA MACD:
- MACD is calculated using Volume-Weighted Moving Averages (VWMA) instead of standard EMAs.
- Histogram shows the difference between MACD and its signal line.
2. Volume Filter:
- Signals are only triggered when current volume exceeds a multiple of its moving average.
- Reduces false signals in low-volume periods.
3. Trend Filter:
- Only triggers buy signals when price is above a long-term VWMA (uptrend).
- Only triggers sell signals when price is below the long-term VWMA (downtrend).
- Helps avoid counter-trend trades.
4. Plots:
- MACD (blue), Signal (orange), Histogram (green/red)
- Trend VWMA (purple)
- Buy and Sell arrows in the indicator pane (green/red)
5. Alerts:
- Configurable alerts for buy and sell signals filtered by volume and trend.
Inputs:
- Fast Length: VWMA period for the fast MACD line (default 12)
- Slow Length: VWMA period for the slow MACD line (default 26)
- Signal Length: EMA period for the MACD signal line (default 9)
- Volume MA Length: Length for volume moving average filter (default 20)
- Volume Threshold Multiplier: Multiplier for volume filter (default 1.2)
- Trend VWMA Length: Period for long-term trend VWMA (default 50)
- Price Source: Close, HL2, HLC3, OHLC4
Usage:
- Use as a confirmation tool along with other analysis techniques.
- Buy when the green triangle appears (MACD crossover, above trend VWMA, sufficient volume).
- Sell when the red triangle appears (MACD crossunder, below trend VWMA, sufficient volume).
- Trend VWMA helps visually confirm the market trend.
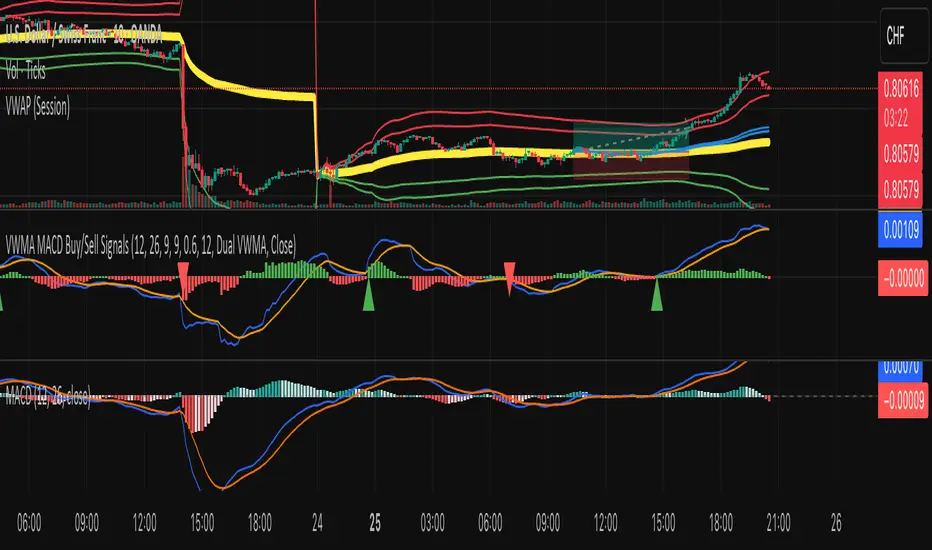
VWMA MACD Amanita Buy/Sell Signals VWMA MACD Amanita Buy/Sell Signals – Volume-Weighted Momentum Indicator
A twist on the classic MACD: this indicator uses Volume Weighted Moving Averages (VWMA) instead of EMAs, giving more weight to price moves backed by higher volume.
Features:
VWMA-based MACD line & signal line
Histogram highlights bullish/bearish momentum
Color-coded for easy visualization
Quick Guide:
MACD above Signal → bullish
MACD below Signal → bearish
Rising histogram → strengthening trend
Falling histogram → weakening trend
Perfect for traders who want momentum confirmed by volume.
Institutional MACD (Z-Score Edition) [VolumeVigilante]📈 Institutional MACD (Z-Score Edition) — Professional-Grade Momentum Signal
This is not your average MACD .
The Institutional MACD (Z-Score Edition) is a statistically enhanced momentum tool, purpose-built for serious traders and breakout hunters . By applying Z-Score normalization to the classic MACD structure, this indicator uncovers statistically significant momentum shifts , enabling cleaner reads on price extremes, trend continuation, and potential reversals.
💡 Why It Matters
The classic MACD is powerful — but raw momentum values can be noisy and relative , especially on volatile assets like BTC/USD . By transforming the MACD line, signal line, and histogram into Z-scores , we anchor these signals in statistical context . This makes the Institutional MACD:
✔️ Timeframe-agnostic and asset-normalized
✔️ Ideal for spotting true breakouts , not false flags
✔️ A reliable tool for detecting momentum divergence and exhaustion
🧪 Key Features
✅ Full Z-Score normalization (MACD, Signal, Histogram)
✅ Highlighted ±Z threshold bands for overbought/oversold zones
✅ Customizable histogram coloring for visual momentum shifts
✅ Built-in alerts for zero-crosses and Z-threshold breaks
✅ Clean overlay with optional display toggles
🔁 Strategy Tip: Mean Reversion Signals with Statistical Confidence
This indicator isn't just for spotting breakouts — it also shines as a mean reversion tool , thanks to its Z-Score normalization .
When the Z-Score histogram crosses beyond ±2, it marks a statistically significant deviation from the mean — often signaling that momentum is overstretched and the asset may be due for a pullback or reversal .
📌 How to use it:
Z > +2 → Price action is in overbought territory. Watch for exhaustion or short setups.
Z < -2 → Momentum is deeply oversold. Look for reversal confirmation or long opportunities.
These zones often precede snap-back moves , especially in range-bound or corrective markets .
🎯 Combine Z-Score extremes with:
Candlestick confirmation
Support/resistance zones
Volume or price divergence
Other mean reversion tools (e.g., RSI, Bollinger Bands)
Unlike the raw MACD, this version delivers statistical thresholds , not guesswork — helping traders make decisions rooted in probability, not emotion.
📢 Trade Smart. Trade Vigilantly.
Published by VolumeVigilante
